首页 文章 精选 留言 我的

精选列表

搜索[elk],共1229篇文章
优秀的个人博客,低调大师

ELK+kafka集成

1、因为本项目采用的log4j2,所以在log4j2中直接配置 <Kafkaname="Kafka"topic="XX_log"> <PatternLayoutpattern="%d{yyyy-MM-ddHH:mm:ss}||%p||%c{1}||XX_web||%m%n"/> <Propertyname="bootstrap.servers">127.0.0.1:9092</Property> <Propertyname="timeout.ms">500</Property> </Kafka> PatternLayout 中格式采用了||将内容连接起来目的为了logstash进行切分,其中增加timeout.ms属性为了保证日志系统挂掉的情况不会对业务系统产生较大影响,当然kafka可以采用集群的方式,bootstrap.servers多个地址用“,”分隔。XX_web代表当前业务平台。 2、搭建kafka集群这里就不多介绍了官网很全, zookeeper.connect=127.0.0.1:2181,127.0.0.1:2182,127.0.0.1:2183 3、创建logstash动态模板 { "template":"*", "settings":{ "index.refresh_interval":"5s", "number_of_replicas":"0", "number_of_shards":"3" }, "mappings":{ "_default_":{ "_all":{ "enabled":false }, "dynamic_templates":[ { "message_field":{ "match":"message", "match_mapping_type":"string", "mapping":{ "type":"string", "index":"analyzed" } } }, { "string_fields":{ "match":"*", "match_mapping_type":"string", "mapping":{ "type":"string", "index":"not_analyzed" } } } ], "properties":{ "dateTime":{ "type":"date", "format":"yyy-MM-ddHH:mm:ss" }, "@version":{ "type":"integer", "index":"not_analyzed" }, "context":{ "type":"string", "index":"analyzed" }, "level":{ "type":"string", "index":"not_analyzed" }, "class":{ "type":"string", "index":"not_analyzed" }, "server":{ "type":"string", "index":"not_analyzed" } } } } } 4、配置logstash input{ kafka{ zk_connect=>"127.0.0.1:2181,127.0.0.1:2182,127.0.0.1:2183" group_id=>"logstash" topic_id=>"XX_log" reset_beginning=>false consumer_threads=>5 decorate_events=>true } } filter{ mutate{ split=>["message","||"] add_field=>{ "dateTime"=>"%{[message][0]}" } add_field=>{ "level"=>"%{[message][1]}" } add_field=>{ "class"=>"%{[message][2]}" } add_field=>{ "server"=>"%{[message][3]}" } add_field=>{ "context"=>"%{[message][4]}" } remove_field=>["message"] } date{ match=>["logdate","yyyy-MM-ddHH:mm:ss"] } } output{ elasticsearch{ hosts=>["127.0.0.1:9200"] index=>"XX_log-%{+YYYY-MM}" codec=>"json" manage_template=>true template_overwrite=>true flush_size=>50000 idle_flush_time=>10 workers=>2 template=>"E:\logstash\template\template_log.json" } } 按照年月将日志保存进ES索引中index => "XX_log-%{+YYYY-MM}",logstash从kafka集群中读取日志信息。 5、搭建ZK集群,这里就不多介绍了,网上资料比较多 6、搭建ES集群,ES集群比较简单,设置的参数不要太多就可以使用。 7、配置kibana server.port:5601#服务端口 #Thehosttobindtheserverto. server.host:"115.28.240.113" elasticsearch.url:http://127.0.0.1:9200ES地址-集群 kibana.index:"kibana" 8、版本 JKD 1.7 ES-2.4, logstash 2.4, kafka-2.10,kibana-4.6.4


优秀的个人博客,低调大师

elk组件 基础语法

1 2 3 4 5 6 7 8 9 10 11 12 13 14 15 16 17 18 19 20 21 22 23 24 25 26 27 28 29 30 31 32 33 34 35 36 37 38 39 40 41 42 43 44 45 46 47 48 49 50 51 52 53 54 55 56 57 58 59 60 61 62 63 64 65 66 67 68 69 70 71 72 73 74 75 76 77 78 79 80 81 82 83 84 85 86 87 88 89 90 91 92 93 94 95 96 97 98 99 100 101 102 103 104 105 106 107 108 109 110 111 112 113 114 115 116 117 118 119 120 121 122 123 124 125 126 127 128 129 130 131 132 133 134 135 136 137 138 139 140 141 142 143 144 145 146 147 148 149 150 151 152 153 154 155 156 157 158 159 160 161 162 163 164 165 166 167 168 169 170 171 172 173 174 175 176 177 178 179 180 181 182 183 184 185 186 187 188 189 190 191 192 193 194 195 196 197 198 199 200 201 202 203 204 Shipper->Broker->Indexer->ES 1.input input{stdin{}} output{ stdout{codec=>rubydebug} } file { codec=>multiline{ pattern=> "^\s" what=> "previous" } path=>[ "xx" , "xx" ] exclude=> "1.log" add_field=>[ "log_ip" , "xx" ] tags=> "tag1" #设置新事件的标志 delimiter=> "\n" #设置多长时间扫描目录,发现新文件 discover_interval=>15 #设置多长时间检测文件是否修改 stat_interval=>1 #监听文件的起始位置,默认是end start_position=>beginning #监听文件读取信息记录的位置 sincedb_path=> "E:/software/logstash-1.5.4/logstash-1.5.4/test.txt" #设置多长时间会写入读取的位置信息 sincedb_write_interval=>15 } 2.filter filter{ multiline{ #指定合并规则——所有不是以数字开头的行需要被合并 pattern=> "^[^\d]" #合并到哪里——上一行 what=> "previous" } filter{ multiline{ type => "type" #类型,不多说 pattern=> "pattern,aregexp" #参数,也可以认为是字符,有点像grep,如果符合什么字符就交给下面的what去处理 negate=>boolean what=> "previous" or "next" #这个是符合上面pattern的要求后具体怎么处理,处理方法有两种,合并到上面一条日志或者下面的日志 } } filter{ grep { match=>[ "@message" , "PHPFatalerror" ] drop=> false add_tag=>[fatal_error] } grep { tags=>[fatal_error] match=>[ "@message" , ".*(xbox\.com|xbox\.mib\.com\.cn|supports\.game\.mib\.com\.cn)" ] drop=> false add_tag=>[xboxerror] } } #过滤掉内容包含5.3.3与down以外日志 filter{ if [message]!~ "5.3.3|down" { ruby{ code=> "event.cancel" } } } #使用自带的过滤规则显示更多的字段 filter{ grok{ match=>{ "message" => "%{COMBINEDAPACHELOG}" } } } #合并不是以[开头的日志 filter{ multiline{ pattern=> "^[^[]" negate=> true what=> "previous" } } filter{ if [path]=~ "error" { mutate{replace=>{ "type" => "apache_error" }} grok{ match=>{ "message" => "%{COMBINEDAPACHELOG}" } } } date { match=>[ "timestamp" , "dd/MMM/yyyy:HH:mm:ssZ" ] } } filter{ if [path]=~ "access" { mutate{replace=>{ type => "apache_access" }} grok{ match=>{ "message" => "%{COMBINEDAPACHELOG}" } } date { match=>[ "timestamp" , "dd/MMM/yyyy:HH:mm:ssZ" ] } } else if [path]=~ "error" { mutate{replace=>{ type => "apache_error" }} } else { mutate{replace=>{ type => "random_logs" }} } } 3.output 发邮件 output{ email{ match=>[ "@message" , "aaaaa" ] to=> "storyskya@gmail.com" from=> "monitor@mib.com.cn" options=>[ "smtpIporHost" , "smtp.mibnet.com" , "port" , "25" , "userName" , "monitor@mib.com.cn" , "starttls" , "true" , "password" , "opmonitor" , "authenticationType" , "login" ] subject=> "123" body=> '123' via=>smtp } } output{ if [ type ]== "syslog" { elasticsearch{ hosts=> "172.16.0.102:9200" index=> "syslog-%{+YYYY.MM.dd}" } } if [ type ]== "nginx" { elasticsearch{ hosts=> "172.16.0.102:9200" index=> "nglog-%{+YYYY.MM.dd}" } } #匹配内容包含paramiko与simplejson的日志通邮件发送 if [message]=~ /paramiko |simplejson/{ email{ to=> "12222222@wo.cn" from=> "good_zabbix@163.com" contenttype=> "text/plain;charset=UTF-8" address=> "smtp.163.com" username=> "test@163.com" password=> "12344" subject=> "服务器%{host}日志异常" body=> "%{@timestamp}%{type}:%{message}" } } } output{ stdout{codec=>rubydebug} redis{ host=> '192.168.1.104' data_type=> 'list' key=> 'logstash:redis' } } output{ elasticsearch{host=>localhost} stdout{codec=>rubydebug} } 替换 mutate{ type => "phplog" gsub=>[ "@message" , "'" , "\"" ] } 调试 #/usr/local/logstash-1.5.2/bin/logstash-e'input{stdin{}}output{stdout{}}' curl' logstash-e 'input{stdin{}}output{stdout{codec=>rubydebug}}' # logstash agent -f logstash-simple.conf --verbose //开启debug模式 本文转自 liqius 51CTO博客,原文链接:http://blog.51cto.com/szgb17/1865408,如需转载请自行联系原作者

优秀的个人博客,低调大师

ELK多行日志收集

版本:filebeat5.2.2 日志如下: 1 2 3 4 5 6 7 8 9 10 11 12 13 192.168.1.187[10.10.2.5,192.168.2.2,192.168.3.4][2017-03-0500:01:00]["POSTwww.test.com/Service.asmx"][""1.0"encoding="utf-8"?><soap12:Envelopexmlns:xsi="http://www.w3.org/2001/XMLSchema-instance"xmlns:xsd="http://www.w3.org/2001/XMLSchema"xmlns:soap12="http://www.w3.org/2003/05/soap-envelope"><soap12:Body><SaveExceptionxmlns="http://tempuri.org/"><Content>java.lang.UnsatisfiedLinkError:Nativemethodnotfound:com.igexin.push.extension.mod.SecurityUtils.m:([B[B)[B atcom.igexin.push.extension.mod.SecurityUtils.m(NativeMethod) atcom.igexin.push.util.EncryptUtils.altAesDecSocket(UnknownSource) atcom.igexin.push.d.a.c.a(UnknownSource) atcom.igexin.push.d.a.c.b(UnknownSource) atcom.igexin.push.d.a.c.a(UnknownSource) atcom.igexin.push.d.a.c.b(UnknownSource) atcom.igexin.push.d.a.c.c(UnknownSource) atcom.igexin.a.a.b.a.a.j.a_(UnknownSource) atcom.igexin.a.a.d.g.a(UnknownSource) atcom.igexin.a.a.d.g.run(UnknownSource) atjava.lang.Thread.run(Thread.java:841) </Content><Mobile>561128</Mobile><Source>android</Source></SaveException></soap12:Body></soap12:Envelope>"]["Dalvik/1.6.0(Linux;U;Android4.4.4;SM-G8508SBuild/KTU84P)"]["java\.lang"] 如果不作任何处理,filebeat会把每行日志作为一条数据传输给redis,这样elasticsearch收集到数据就无法把日志分类了。所有必须让filebeat把上面的这条日志当成一条数据传输给redis。 vim filebeat.yml 1 2 3 4 5 6 7 8 9 10 11 12 13 14 15 16 17 18 19 20 21 22 23 #===========================Filebeatprospectors===== filebeat.prospectors: #------------------------------Logprospector-------- -input_type:log paths: -c:\programdata\elasticsearch\logs\* multiline.pattern:^\d+\.\d+ #日志开头以“数字.数字”的格式开头,不是以此开头的日志计算上一行日志 multiline.negate:true multiline.match:after #-------------------------------Redisoutput-------- output.redis: enabled:true hosts:["192.168.10.10:6379"] port:6379 key:log db:2 datatype:list worker:2 loadbalance:true logging.to_files:true logging.files: 本文转自 irow10 51CTO博客,原文链接:http://blog.51cto.com/irow10/1904664,如需转载请自行联系原作者

优秀的个人博客,低调大师

elk入门概念详解

开始第一步 我们现在开始进行一个简单教程,它涵盖了一些基本的概念介绍,比如索引(indexing)、搜索(search)以及聚合(aggregations)。通过这个教程,我们可以让你对Elasticsearch能做的事以及其易用程度有一个大致的感觉。 我们接下来将陆续介绍一些术语和基本的概念,但就算你没有马上完全理解也没有关系。我们将在本书的各个章节中更加深入的探讨这些内容。 所以,坐下来,开始以旋风般的速度来感受Elasticsearch的能力吧! 让我们建立一个员工目录 假设我们刚好在Megacorp工作,这时人力资源部门出于某种目的需要让我们创建一个员工目录,这个目录用于促进人文关怀和用于实时协同工作,所以它有以下不同的需求: 数据能够包含多个值的标签、数字和纯文本。 检索任何员工的所有信息。 支持结构化搜索,例如查找30岁以上的员工。 支持简单的全文搜索和更复杂的短语(phrase)搜索 高亮搜索结果中的关键字 能够利用图表管理分析这些数据 索引员工文档 我们首先要做的是存储员工数据,每个文档代表一个员工。在Elasticsearch中存储数据的行为就叫做索引(indexing),不过在索引之前,我们需要明确数据应该存储在哪里。 在Elasticsearch中,文档归属于一种类型(type),而这些类型存在于索引(index)中,我们可以画一些简单的对比图来类比传统关系型数据库: Relational DB -> Databases -> Tables -> Rows -> Columns Elasticsearch -> Indices -> Types -> Documents -> Fields Elasticsearch集群可以包含多个索引(indices)(数据库),每一个索引可以包含多个类型(types)(表),每一个类型包含多个文档(documents)(行),然后每个文档包含多个字段(Fields)(列)。 「索引」含义的区分 你可能已经注意到索引(index)这个词在Elasticsearch中有着不同的含义,所以有必要在此做一下区分: 索引(名词)如上文所述,一个索引(index)就像是传统关系数据库中的数据库,它是相关文档存储的地方,index的复数是indices 或indexes。 索引(动词)「索引一个文档」表示把一个文档存储到索引(名词)里,以便它可以被检索或者查询。这很像SQL中的INSERT关键字,差别是,如果文档已经存在,新的文档将覆盖旧的文档。 倒排索引传统数据库为特定列增加一个索引,例如B-Tree索引来加速检索。Elasticsearch和Lucene使用一种叫做倒排索引(inverted index)的数据结构来达到相同目的。 默认情况下,文档中的所有字段都会被索引(拥有一个倒排索引),只有这样他们才是可被搜索的。 我们将会在倒排索引章节中更详细的讨论。 所以为了创建员工目录,我们将进行如下操作: 为每个员工的文档(document)建立索引,每个文档包含了相应员工的所有信息。 每个文档的类型为employee。 employee类型归属于索引megacorp。 megacorp索引存储在Elasticsearch集群中。 实际上这些都是很容易的(尽管看起来有许多步骤)。我们能通过一个命令执行完成的操作: PUT /megacorp/employee/1 { "first_name" : "John", "last_name" : "Smith", "age" : 25, "about" : "I love to go rock climbing", "interests": [ "sports", "music" ] } 我们看到path:/megacorp/employee/1包含三部分信息: 名字 说明 megacorp 索引名 employee 类型名 1 这个员工的ID 请求实体(JSON文档),包含了这个员工的所有信息。他的名字叫“John Smith”,25岁,喜欢攀岩。 很简单吧!它不需要你做额外的管理操作,比如创建索引或者定义每个字段的数据类型。我们能够直接索引文档,Elasticsearch已经内置所有的缺省设置,所有管理操作都是透明的。 接下来,让我们在目录中加入更多员工信息: PUT /megacorp/employee/2 { "first_name" : "Jane", "last_name" : "Smith", "age" : 32, "about" : "I like to collect rock albums", "interests": [ "music" ] } PUT /megacorp/employee/3 { "first_name" : "Douglas", "last_name" : "Fir", "age" : 35, "about": "I like to build cabinets", "interests": [ "forestry" ] } 结果: [root@master elasticsearch]# 1 2 3 4 5 6 7 8 9 curl-i-XPUT127.0.0.1:9200 /megacorp/employee/1 -d' { "first_name" : "John" , "last_name" : "Smith" , "age" :25, "about" : "Ilovetogorockclimbing" , "interests" :[ "sports" , "music" ] } ' 结果: 集群数据目录多一个了index megacorp名名称的(indices目录是 index名称的复数) [root@master elasticsearch]# 1 ls -l /tmp/elasticsearch/data/elasticsearch-cluster/nodes/0/indices/megacorp/ 1 2 3 4 5 6 7 total24 drwxr-xr-x5elasticsearchelasticsearch4096May1519:320 drwxr-xr-x5elasticsearchelasticsearch4096May1519:311 drwxr-xr-x5elasticsearchelasticsearch4096May1519:322 drwxr-xr-x5elasticsearchelasticsearch4096May1519:313 drwxr-xr-x5elasticsearchelasticsearch4096May1519:334 drwxr-xr-x2elasticsearchelasticsearch4096May1519:33_state 本文转自残剑博客51CTO博客,原文链接http://blog.51cto.com/cuidehua/1773685如需转载请自行联系原作者 cuizhiliang

优秀的个人博客,低调大师

elk之elasticsearch 入门

一、概述: 1、查看elasticsearch集群的健康状况: 1 [root@node115 kibana]# curl -X GET http://192.168.39.115:9200/_cat/health?v 2 epoch timestamp cluster status node.total node.data shards pri relo init unassign pending_tasks max_task_wait_time active_shards_percent 3 1487146452 16:14:12 elasticsearch green 2 2 42 21 0 0 0 0 - 100.0% 2、查看elasticsearch集群的节点信息: 1 [root@node115 kibana]# curl -X GET http://192.168.39.115:9200/_cat/nodes?v 2 ip heap.percent ram.percent cpu load_1m load_5m load_15m node.role master name 3 192.168.39.115 30 24 1 0.43 0.20 0.22 mdi * node-1 4 192.168.39.175 43 100 1 0.53 0.42 0.39 mdi - node-2 3、查看index信息: 1 [root@node115 kibana]# curl -X GET http://192.168.39.115:9200/_cat/indices?v 2 health status index uuid pri rep docs.count docs.deleted store.size pri.store.size 3 green open .kibana e1EFtVxJSeS1jLxeX7kLSg 1 1 2 0 21.4kb 10.7kb 4 green open logstash-2017.02.15 i2rSKoflRtiEZoj9CmgEOA 5 1 6916294 0 4.3gb 2.1gb 5 green open logstash-2017.02.14 zMnftdmDQRShH86XsmwWlw 5 1 6127 0 4.8mb 2.4mb 6 green open filebeat-2017.02.15 alVH725IQgmwZiYvuW3Dsg 5 1 6922434 0 3.8gb 1.9gb 7 green open filebeat-2017.02.14 E2v3vgcPQz6jrDhxZMprOw 5 1 6127 0 4mb 2mb 4、创建index 1 PUT /customer?pretty #创建名为customer的index 5、查看index的详细信息: 1 curl -X GET http://192.168.39.115:9200/logstash-2017.02.15?pretty 6、删除index: 1 DELETE /customer?pretty #删除index (customer) 7、查看index上设置信息: 1 [root@node115 kibana]# curl -X GET http://192.168.39.115:9200/logstash-2017.02.16/_settings 2 { 3 "logstash-2017.02.16":{ 4 "settings":{ 5 "index":{ 6 "refresh_interval":"5s", 7 "number_of_shards":"5", 8 "provided_name":"logstash-2017.02.16", 9 "creation_date":"1487203204821", 10 "number_of_replicas":"1", 11 "uuid":"-Bwpq-5TT8mzLMJeU7PQ7A", 12 "version":{ 13 "created":"5020099" 14 } 15 } 16 } 17 } 18 } 8、修改index上的配置信息: 二、kafka相关: 查看topic bin/kafka-topics.sh --list --zookeeper localhost:2181

优秀的个人博客,低调大师

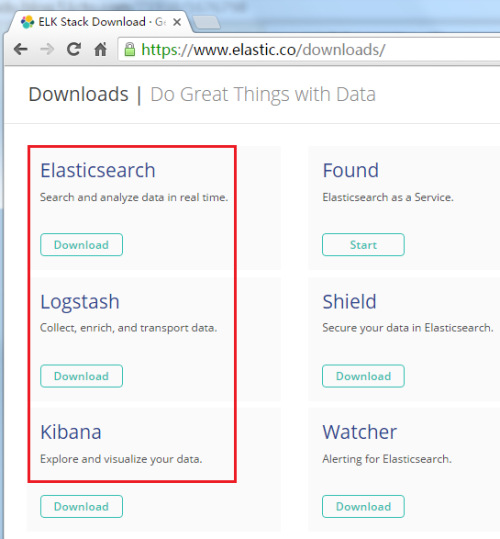
ELK 下载地址elastic

lasticsearch 2.3.5 Elasticsearch can also be installed from our repositories using apt or yum. SeeRepositoriesin the Guide. ZIPsha1 TARsha1 DEBsha1 RPMsha1 Installation Steps Download and unzip the latest Elasticsearch distribution Runbin/elasticsearchon Unix orbin\elasticsearch.baton Windows Run curl -X GET http://localhost:9200/ https://www.elastic.co/downloads/elasticsearch Logstash 2.3.4 Logstash can also be installed from our repositories using apt or yum. SeeRepositoriesin the Guide. Java 7 or higher is required for Logstash 2.x. TAR.GZsha1 ZIPsha1 DEBsha1 RPMsha1 View GitHub Project Documentation Past Releases All Downloads See Release Notes Logstash 2.3.4 All Plugins Logstash bundled with the latest version of all availablepluginsat time of release. This full package can be convenient when working in offline environments. Java 7 or higher is required for Logstash 2.x. ZIPsha1 TAR.GZsha1 DEBsha1 RPMsha1 Installation Steps 1. Download and unzip the latest logstash release 2. Prepare alogstash.confconfig file 3. Runbin/logstash agent -f logstash.conf View GitHub Project Documentation Past Releases All Downloads https://www.elastic.co/downloads/logstash Kibana 4.5.4 Compatible with Elasticsearch 2.3.x. Kibana can also be installed from our repositories using apt or yum. SeeRepositoriesin the Guide. WINDOWSsha1 MACsha1 LINUX 64-BITsha1 LINUX 32-BITsha1 RPM 64-BITsha1 RPM 32-BITsha1 DEB 64-BITsha1 DEB 32-BITsha1 Installation Steps Download and unzip Kibana 4 Note: Kibana 4.5.xrequires Elasticsearch 2.3.x Extract your archive Openconfig/kibana.ymlin an editor Set theelasticsearch.urlto point at your Elasticsearch instance Run./bin/kibana(orbin\kibana.baton Windows) Point your browser athttp://yourhost.com:5601 Check out theREADME.md View GitHub Project Documentation Past Releases All Downloads https://www.elastic.co/downloads/kibana

优秀的个人博客,低调大师

ELK实时日志分析平台(elk+kafka+metricbeat)-kibana部署(六)

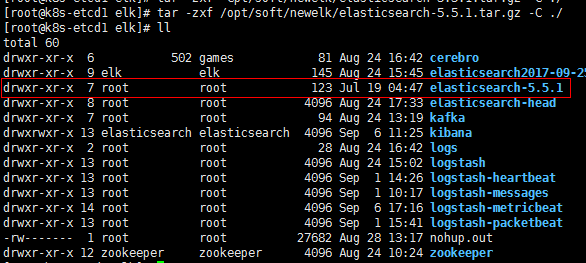
解压(192.168.30.121上执行): tar -zxf /opt/soft/newelk/kibana-5.5.1-linux-x86_64.tar.gz -C ./ mv kibana-5.5.1-linux-x86_64 kibana 修改配置文件: #cat>kibana/config/kibana.yml<<EOF server.port: 5601 server.host: "192.168.30.121" server.basePath: "" server.maxPayloadBytes: 1048576 elasticsearch.url: "http://192.168.30.121:9200" elasticsearch.preserveHost: true kibana.index: ".kibana" kibana.defaultAppId: "discover" elasticsearch.username: "elastic" elasticsearch.password: "changeme" elasticsearch.pingTimeout: 1500 elasticsearch.requestTimeout: 30000 elasticsearch.shardTimeout: 0 elasticsearch.startupTimeout: 5000 pid.file: /var/run/kibana.pid logging.dest: stdout logging.silent: false logging.quiet: false logging.verbose: false ops.interval: 5000 i18n.defaultLocale: "en" EOF 启动: 以metricbeat为例导入模板: tar -zxf/opt/soft/newelk/metricbeat-5.5.1-linux-x86_64.tar.gz -C /opt/soft/newelk cd/opt/soft/newelk/metricbeat-5.5.1-linux-x86_64 创建test索引: curl -XPUT'192.168.30.121:9200/test?pretty' 导入模板到指定索引: ./scripts/import_dashboards -es http://192.168.30.121:9200 -k test 在kibana中关联索引: 本文转自 zhuxtqw 51CTO博客,原文链接:http://blog.51cto.com/1054054/1968690,如需转载请自行联系原作者

优秀的个人博客,低调大师

ELK实时日志分析平台(elk+kafka+metricbeat)-搭建说明(一)

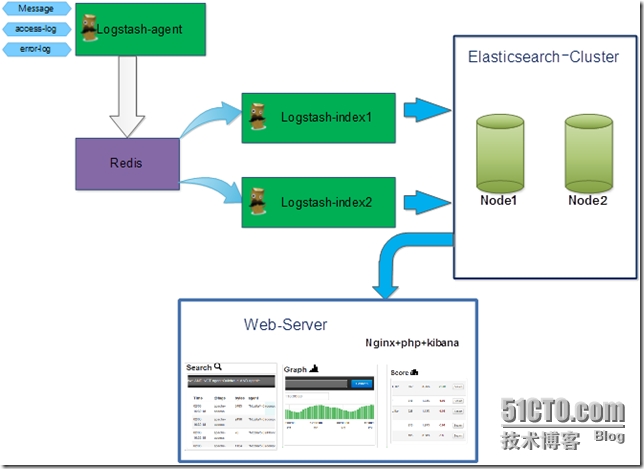
数据流向: metricbeat->kafka->logstash->elasticsearch->kibana. 应用分布: 主机 应用 备注 192.168.30.121 java version "1.8.0_144" zookeeper-3.4.10.tar.gz kafka_2.12-0.11.0.0.tgz elasticsearch-5.5.1.tar.gz logstash-5.5.1.tar.gz kibana-5.5.1-linux-x86_64.tar.gz 192.168.30.122 java version "1.8.0_144" zookeeper-3.4.10.tar.gz kafka_2.12-0.11.0.0.tgz elasticsearch-5.5.1.tar.gz 192.168.30.123 java version "1.8.0_144" zookeeper-3.4.10.tar.gz kafka_2.12-0.11.0.0.tgz elasticsearch-5.5.1.tar.gz 192.168.30.125 客户端 metricbeat-5.5.1-linux-x86_64 本文转自 zhuxtqw 51CTO博客,原文链接:http://blog.51cto.com/1054054/1963636,如需转载请自行联系原作者

资源下载

更多资源
Mario

Mario

马里奥是站在游戏界顶峰的超人气多面角色。马里奥靠吃蘑菇成长,特征是大鼻子、头戴帽子、身穿背带裤,还留着胡子。与他的双胞胎兄弟路易基一起,长年担任任天堂的招牌角色。

腾讯云软件源

腾讯云软件源

为解决软件依赖安装时官方源访问速度慢的问题,腾讯云为一些软件搭建了缓存服务。您可以通过使用腾讯云软件源站来提升依赖包的安装速度。为了方便用户自由搭建服务架构,目前腾讯云软件源站支持公网访问和内网访问。

Nacos

Nacos

Nacos /nɑ:kəʊs/ 是 Dynamic Naming and Configuration Service 的首字母简称,一个易于构建 AI Agent 应用的动态服务发现、配置管理和AI智能体管理平台。Nacos 致力于帮助您发现、配置和管理微服务及AI智能体应用。Nacos 提供了一组简单易用的特性集,帮助您快速实现动态服务发现、服务配置、服务元数据、流量管理。Nacos 帮助您更敏捷和容易地构建、交付和管理微服务平台。

WebStorm

WebStorm

WebStorm 是jetbrains公司旗下一款JavaScript 开发工具。目前已经被广大中国JS开发者誉为“Web前端开发神器”、“最强大的HTML5编辑器”、“最智能的JavaScript IDE”等。与IntelliJ IDEA同源,继承了IntelliJ IDEA强大的JS部分的功能。

用户登录
用户注册