ELK-Logstash收集haproxy日志
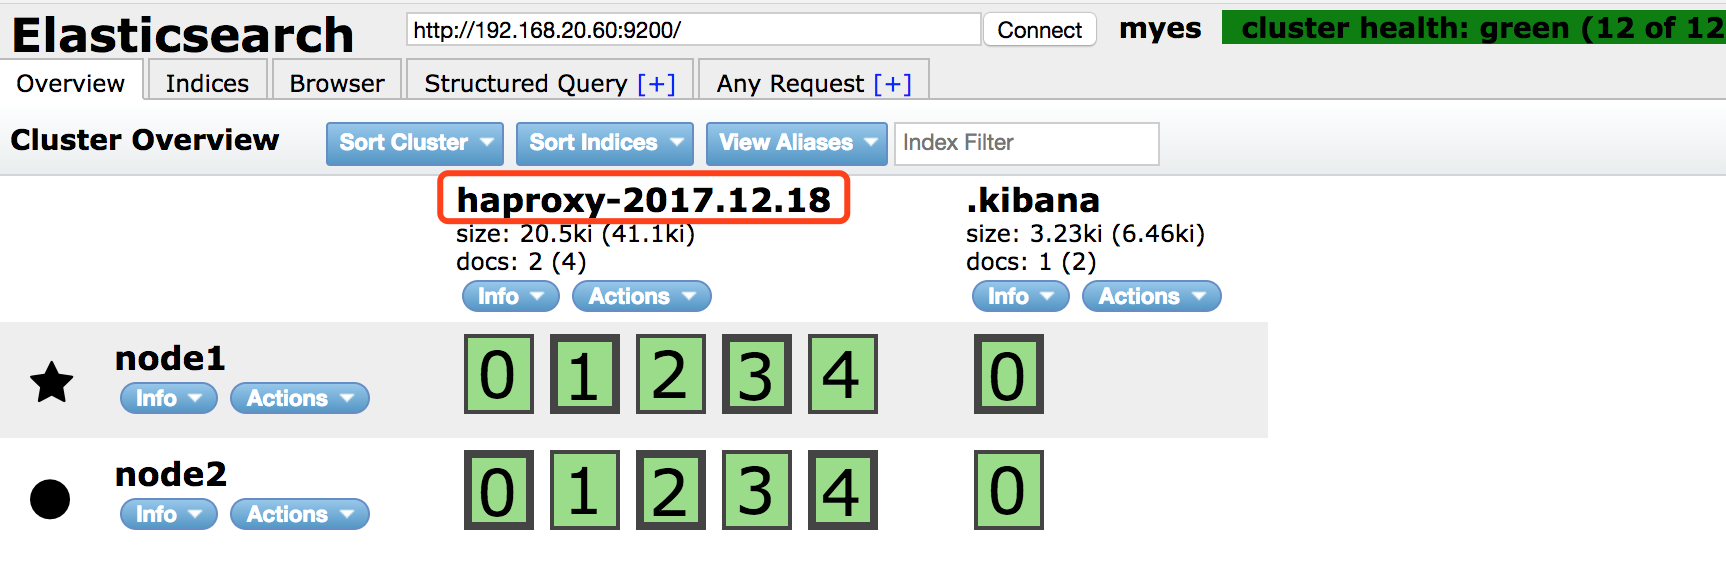
场景需求 使用logstash收集haproxy的日志到Elasticsearch,并使用kibana对日志进行展示。由于 HAProxy的运行信息不写入日志文件,但它依赖于标准的系统日志协议将日志发送到远程服务器(通常位于同一系统上)。所以需要借助于使用rsyslog的方式来收集haproxy的日志. 环境说明 haproxy代理kibana的访问,使用logstash 收集kibana平台的访问信息。 node1: kibana Elasticsearch node2: haproxy logstash Elasticsearch 配置步骤 准备好node1和node2的环境,默认使用rpm包和yum安装。 在node2安装haproxy 在官网下载gz的压缩文件:http://www.haproxy.org/ 上传至服务器,解压编译: tar xf haproxy-1.8.1.tar.gz cd haproxy-1.8.1 安装依赖工具: [root@node2 haproxy-1.8.1]# yum install gcc pcre pcre-devel openssl openssl-devel -y 编译安装,需要在install的时候指定安装路径,否则会以默认路径安装: [root@node2 haproxy-1.8.1]# make TARGET=linux2628 USE_PCRE=1 USE_OPENSSL=1 USE_ZLIB=1 PREFIX=/usr/local/haproxy [root@node2 haproxy-1.8.1]# make install PREFIX=/usr/local/haproxy 确认安装版本: [root@node2 haproxy-1.8.1]# /usr/local/haproxy/sbin/haproxy -v HA-Proxy version 1.8.1 2017/12/03 Copyright 2000-2017 Willy Tarreau <willy@haproxy.org> 提示:使用haproxy 1.8.1版本编译时,不会生成haproxy-systemd-wrapper文件,而在1.7.9版本中可以生成,可以对1.7.9编译后拷贝出haproxy-systemd-wrapper添加到systemd文件中启动,使用haproxy命令作为systemd文件启动会报错。 使用systemd管理haproxy,编写systemd文件如下: [root@node2 haproxy-1.8.1]# cat /usr/lib/systemd/system/haproxy.service [Unit] Description=HAProxy Load Balancer After=syslog.target network.target [Service] EnvironmentFile=/etc/sysconfig/haproxy ExecStart=/usr/sbin/haproxy-systemd-wrapper -f /etc/haproxy/haproxy.cfg -p /run/haproxy.pid $OPTIONS ExecReload=/bin/kill -USR2 $MAINPID [Install] WantedBy=multi-user.target 将对应的命令复制到指定目录: [root@node2 ~]# cp /usr/local/haproxy/sbin/haproxy /usr/sbin/ 配置系统配置文件: [root@node2 ~]# vim /etc/sysconfig/haproxy # Add extra options to the haproxy daemon here. This can be useful for # specifying multiple configuration files with multiple -f options. # See haproxy(1) for a complete list of options. OPTIONS="" 创建主配置文件: [root@node2 ~]# mkdir /etc/haproxy [root@node2 ~]# vim /etc/haproxy/haproxy.cfg global maxconn 100000 chroot /usr/local/haproxy uid 1000 gid 1000 daemon nbproc 1 pidfile /usr/local/haproxy/run/haproxy.pid log 127.0.0.1 local6 info defaults option http-keep-alive option forwardfor maxconn 100000 mode http timeout connect 300000ms timeout client 300000ms timeout server 300000ms listen stats mode http bind 0.0.0.0:9999 stats enable log global stats uri /haproxy-status stats auth haadmin:123456 #frontend web_port frontend web_port bind 192.168.20.61:80 mode http log global default_backend kibana_web backend kibana_web mode http option httplog # balance source balance roundrobin server kibana-server 192.168.20.60:5601 check inter 2000 rise 3 fall 2 weight 1 创建用户: [root@node2 ~]# useradd haproxy.haproxy -M -s /sbin/nologin --gid 1000 --uid 1000 启动haproxy: [root@node2 ~]# systemctl daemon-reload [root@node2 ~]# systemctl start haproxy 配置rsyslog 记录haproxy日志 由于haproxy使用rsyslog记录日志,需要配置rsyslog将日志写到文件 对/etc/rsyslog.conf进行配置: vim /etc/rsyslog.conf # 打开15,16,19,20行注释 $ModLoad imudp $UDPServerRun 514 $ModLoad imtcp $InputTCPServerRun 514 文件末尾添加haproxy中配置的对应日志级别: local6.* /var/log/haproxy/haproxy.log # 日志记录文件 local6.* @@192.168.20.61:516 # 本地IP和监听端口 创建日志目录,并授权: [root@node2 ~]# mkdir /var/log/haproxy [root@node2 ~]# chown -R haproxy.haproxy /var/log/haproxy 重启rsyslog和haproxy: [root@node2 ~]# systemctl restart rsyslog [root@node2 ~]# systemctl restart haproxy 查看是否生成haproxy日志: [root@node2 ~]# tail -f /var/log/haproxy/haproxy.log Dec 18 19:12:12 localhost haproxy[6959]: Proxy stats started. Dec 18 19:12:12 localhost haproxy[6959]: Proxy web_port started. ... 查看使用haproxy是否能直接访问node1上的kibana. 提示: 使用haproxy不同主机代理Kibana需要将Kibana开启非本地监听状态。 配置logstash 在node2上安装好logstash,具体操作过程这里忽略。 配置logstash的conf文件: [root@node2 ~]# cat /etc/logstash/conf.d/haproxy_log.conf input { syslog{ type => "haproxy" port => "516" # 监听本地rsyslog端口 } } output{ stdout{ codec => "rubydebug" } } 测试文件,看是否能从rsyslog中直接接受日志到前台输出: [root@node2 conf.d]# /usr/share/logstash/bin/logstash -f /etc/logstash/conf.d/haproxy_log.conf -t WARNING: Could not find logstash.yml which is typically located in $LS_HOME/config or /etc/logstash. You can specify the path using --path.settings. Continuing using the defaults Could not find log4j2 configuration at path /usr/share/logstash/config/log4j2.properties. Using default config which logs errors to the console Configuration OK 前台测试,访问haproxy: [root@node2 conf.d]# /usr/share/logstash/bin/logstash -f /etc/logstash/conf.d/haproxy_log.conf -t WARNING: Could not find logstash.yml which is typically located in $LS_HOME/config or /etc/logstash. You can specify the path using --path.settings. Continuing using the defaults Could not find log4j2 configuration at path /usr/share/logstash/config/log4j2.properties. Using default config which logs errors to the console Configuration OK [root@node2 conf.d]# /usr/share/logstash/bin/logstash -f /etc/logstash/conf.d/haproxy_log.conf WARNING: Could not find logstash.yml which is typically located in $LS_HOME/config or /etc/logstash. You can specify the path using --path.settings. Continuing using the defaults Could not find log4j2 configuration at path /usr/share/logstash/config/log4j2.properties. Using default config which logs errors to the console { "severity" => 6, "pid" => "7271", "program" => "haproxy", "message" => "Connect from 192.168.20.3:54571 to 192.168.20.61:9999 (stats/HTTP)\n", "type" => "haproxy", "priority" => 182, "logsource" => "localhost", "@timestamp" => 2017-12-18T14:46:30.000Z, "@version" => "1", "host" => "192.168.20.61", "facility" => 22, "severity_label" => "Informational", "timestamp" => "Dec 18 22:46:30", "facility_label" => "local6" } { "severity" => 6, "pid" => "7271", "program" => "haproxy", "message" => "Connect from 192.168.20.3:54572 to 192.168.20.61:9999 (stats/HTTP)\n", "type" => "haproxy", "priority" => 182, "logsource" => "localhost", "@timestamp" => 2017-12-18T14:46:30.000Z, "@version" => "1", "host" => "192.168.20.61", "facility" => 22, "severity_label" => "Informational", "timestamp" => "Dec 18 22:46:30", "facility_label" => "local6" } 出现上面的日志,说明配置成功。 将输出到前台改为输出到Elaticsearch: [root@node2 ~]# cat /etc/logstash/conf.d/haproxy_log.conf input { syslog{ type => "haproxy" port => "6666" # 在使用后台启动logstash时,普通用户无法启动1024以内的端口,修改为大于1024的端口 } } output{ elasticsearch{ hosts => ["192.168.20.60:9200"] index => "haproxy-%{+YYYY.MM.dd}" } } 测试通过后重启logstash: [root@node2 conf.d]# systemctl restart logstash 修改rsyslog 日志输出端口也为6666: [root@node2 ~]# tail -2 /etc/rsyslog.conf local6.* /var/log/haproxy/haproxy.log local6.* @@192.168.20.61:6666 重启rsyslog: [root@node2 ~]# systemctl restart rsyslog 通过Elasticsearch的header插件,查看到日志已经写入: 在Kibana上添加haproxy日志 日志展示: 本文转自 酥心糖 51CTO博客,原文链接:http://blog.51cto.com/tryingstuff/2051930