Elastic Stack学习--Beats组件
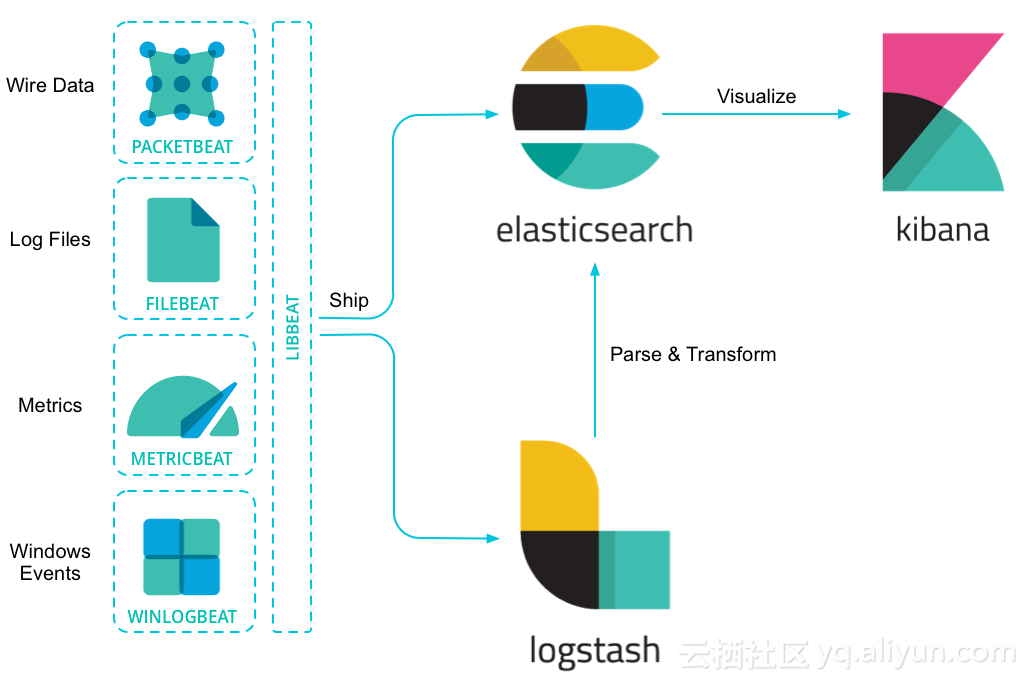
简介 beats组件是一系列用于采集数据的轻量级代理程序,用于从服务端收集日志、网络、监控数据,并最终汇总到elasticsearch。beats组件收集的数据即可以直接上报给elasticsearch,也可以通过logstash中转处理后上报给elasticsearch。 beats根据功能划分有多种: PacketBeat:用于分析和收集服务器的网络包数据; FileBeat:用于收集服务器的日志文件; MetricBeat:用于收集操作系统及业务的运行状态等监控数据; HeartBeat: WinlogBeat:用于收集windows系统的event log; beats组件也支持根据需求定制实现自己的beat。整个beats框架使用go语言实现,提供了对接elasticsearch、配置输入选项、日志记录等API。 FileBeat对接ES,监控logback日志 filebeat用于采集服务器上的各种日志文件数据,由多个prospector组成,每个prospector负责监控和采集某一类日志。prospector由用户自定义配置,多个prospector可以独立配置和运行; 第1步. 修改logback配置,输出json格式日志(非必需) 该步骤不是必需步骤,只是为了能够方便日志的后续处理,配置日志格式为json格式;1)在pom.xml中添加如下依赖: <!--日志转json格式存储--> <dependency> <groupId>net.logstash.logback</groupId> <artifactId>logstash-logback-encoder</artifactId> <version>5.0</version> </dependency> 2)修改logback.xml配置文件,新增输出json的appender: <!--json日志文件输出--> <appender name="json" class="ch.qos.logback.core.rolling.RollingFileAppender"> <file>${jsonLogfile}</file> <rollingPolicy class="ch.qos.logback.core.rolling.TimeBasedRollingPolicy"> <fileNamePattern>${LOG_PATH}/${LOG_FILE}.%d{yyyy-MM-dd}.json</fileNamePattern> <maxHistory>10</maxHistory> </rollingPolicy> <encoder class="net.logstash.logback.encoder.LoggingEventCompositeJsonEncoder"> <providers> <pattern> <pattern> { "logfile": "${LOG_FILE}", "service": "omark-profile-microservice", "timestamp": "%date{\"yyyy-MM-dd'T'HH:mm:ss,SSSZ\"}", "log_level": "%level", "thread": "%thread", "logger": "%logger", "line_number": "%line", "message": "%message", "stack_trace": "%exception" } </pattern> </pattern> </providers> </encoder> </appender> 上面pattern标签中配置的json格式日志,在日志中会以一行输出;类似如下: {"logfile":"profile-service.log","service":"omark-profile-microservice","timestamp":"2018-04-10T15:32:55,488+0800","log_level":"INFO","thread":"main","logger":"org.elasticsearch.plugins.PluginsService","line_number":"177","message":"loaded plugin [org.elasticsearch.percolator.PercolatorPlugin]","stack_trace":""} {"logfile":"profile-service.log","service":"omark-profile-microservice","timestamp":"2018-04-10T15:32:55,488+0800","log_level":"INFO","thread":"main","logger":"org.elasticsearch.plugins.PluginsService","line_number":"177","message":"loaded plugin [org.elasticsearch.script.mustache.MustachePlugin]","stack_trace":""} {"logfile":"profile-service.log","service":"omark-profile-microservice","timestamp":"2018-04-10T15:32:55,489+0800","log_level":"INFO","thread":"main","logger":"org.elasticsearch.plugins.PluginsService","line_number":"177","message":"loaded plugin [org.elasticsearch.transport.Netty3Plugin]","stack_trace":""} {"logfile":"profile-service.log","service":"omark-profile-microservice","timestamp":"2018-04-10T15:32:55,489+0800","log_level":"INFO","thread":"main","logger":"org.elasticsearch.plugins.PluginsService","line_number":"177","message":"loaded plugin [org.elasticsearch.transport.Netty4Plugin]","stack_trace":""} 3)将appender添加到logger中,使appender生效: <!--生产环境--> <springProfile name="prod"> <logger name="org.springframework" level="info" additivity="false"> <appender-ref ref="system"/> <appender-ref ref="json"/> </logger> <logger name="org.hibernate" level="error" additivity="false"> <appender-ref ref="system"/> <appender-ref ref="json"/> </logger> <!--根日志--> <root level="info"> <appender-ref ref="system"/> <appender-ref ref="json"/> </root> </springProfile> 第2步. FileBeat安装&配置 linux下filebeat的安装很简单,直接下载压缩包解压即可:1)下载beat,上传服务器并解压; tar -zxvf filebeat-6.2.2-linux-x86_64.tar.gz cd filebeat-6.2.2-linux-x86_64 可以看到filebeat的目录结构如下: data fields.yml filebeat filebeat.reference.yml filebeat.yml kibana LICENSE.txt logs module modules.d NOTICE.txt README.md 主要文件功能如下: filebeat:filebeat执行的二进制文件; filebeat.yml:filebeat的核心配置文件; fields.yml:filebeat上报日志前,需要先在elasticsearch上建好index模板,从而在日志上报时,elasticsearch能够根据index模板自动创建index;该配置文件用于指定创建index时所需要的字段名及类型; filebeat.reference.yml:存放filebeat所有配置样例;实际运行不会使用,仅作为配置参考; 2)修改filebeat.yml: # prospector配置,可以配置多个; filebeat.prospectors: # 日志组件类型,此处是普通日志,故使用log - type: log # 启用prospector的开关,设置为true下面配置才生效 enabled: true # 收集日志路径,支持通配符; paths: - /home/work/logs/mylog*.json # 日志、日志文件过滤规则,支持正则表达式,此处不配置; #exclude_lines: ['^DBG'] #include_lines: ['^ERR', '^WARN'] #exclude_files: ['.gz$'] #fields: # level: debug # review: 1 #multiline.pattern: ^\[ #multiline.negate: false #multiline.match: after # 配置组件配置文件加载路径,默认即可; filebeat.config.modules: # Glob pattern for configuration loading path: ${path.config}/modules.d/*.yml # Set to true to enable config reloading reload.enabled: false # Period on which files under path should be checked for changes #reload.period: 10s # 配置filebeat生成index模板时的规则 setup.template.settings: index.number_of_shards: 6 index.refresh_interval: 10s index.number_of_replicas: 1 index.codec: best_compression #_source.enabled: false # 允许自动生成index模板 setup.template.enabled: true # 生成index模板时字段配置文件 setup.template.fields: fields.yml # 生成index模板的名称 setup.template.name: mytemplate-name # 生成index模板匹配的index格式 setup.template.pattern: myindex-name-* # 生成kibana中的index pattern,便于检索日志 setup.dashboards.index: myindex-name-* # 在kibana中生成filebeats的图标模板,此处没有用到,故不启用; setup.dashboards.enabled: false # 设置对接的kibana,主要用于生成dashboard时使用; setup.kibana: host: "ip:port" username: "myuser" password: "mypasswd" # 设置对接的elasticsearch信息 output.elasticsearch: # Array of hosts to connect to. hosts: ["ip1:port1", "ip2:port2",] # 设置上报index名称格式,需要和setup.template.pattern匹配; index: myindex-name-%{+yyyy.MM.dd} # Optional protocol and basic auth credentials. protocol: "http" username: "myuser" password: "mypasswd" # 启用xpack监控 xpack.monitoring.enabled: true # 设置filebeat自身监控数据上报elasticsearch信息,如果未指定,则默认使用output.elasticsearch配置 xpack.monitoring.elasticsearch: username: "myuser" password: "mypasswd" protocol: http 3)修改fields.yml文件,删除不必要的字段;因为我们只用到了log组件以及beat自身的监控组件,因而仅保留key为beat和log的字段配置,其余组件的字段配置均删除; 4)启动filebeat: nohup ./filebeat -e -c filebeat.yml > /dev/null 2>&1 & 注:启动filebeat时,会在elasticsearch中自动生成index模板,如果设置setup.template.enabled: false,则不会自动生成。可以通过如下命令手工生成index模板: ./filebeat setup template 第3步. 在kibana上查看是否有日志上报: 1)查看Monitor菜单,发现新增beat组件监控: 2)查看Monitor菜单的index菜单栏,发现已经创建所需index; 3)在Discover页面检索日志,发现已经有日志上报过来; 使用HeartBeat监控java进程 HeartBeat组件用来监控远程服务器上的服务是否正常运行。heartbeat由一系列的monitor组成,这些monitor能够周期性的检查服务的运行状态,每个monitor都可以独立配置和运行。heartbeat目前支持ICMP/TCP/HTTP协议接口的检测。 1)下载安装包,并解压至部署目录; tar -zxvf heartbeat-6.2.2-linux-x86_64.tar.gz cd heartbeat-6.2.2-linux-x86_64 heartbeat目录结构如下: fields.yml heartbeat heartbeat.reference.yml heartbeat.yml kibana LICENSE.txt NOTICE.txt README.md 和filebeat类似,heartbeat的核心文件如下: heartbeat:运行heartbeat的二进制程序; heartbeat.yml:heartbeat的核心配置文件; fields.yml:heartbeat自动创建index模板时,用于指定模板中的字段配置; heartbeat.reference.yml:存放heartbeat所有配置样例,用作参考; 2)修改heartbeat.yml: # monitor配置,支持多个; heartbeat.monitors: # 监控类型配置,支持icmp/tcp/http等 - type: http # 监控url配置,支持多个; urls: ["http://ip1:port1/addr1", "http://ip2:port2/addr2", "http://ip3:port3/addr3"] # 监控周期配置,支持crontab表达式 schedule: '@every 10s' # 监控模式:any,只要有一个url正常即可;all,所有url均正常才算正常; mode: all # 连接及请求超时时间 #timeout: 16s # index模板配置,同filebeat setup.template.settings: index.number_of_shards: 6 index.refresh_interval: 10s index.number_of_replicas: 1 index.codec: best_compression #_source.enabled: false # 允许自动生成index模板 setup.template.enabled: true setup.template.fields: fields.yml setup.template.name: mytemplate_name setup.template.pattern: myindex-* setup.dashboards.index: myindex-* # 允许自动生成dashboard图表 setup.dashboards.enabled: true # kibana配置,同filebeat setup.kibana: host: "ip:port" username: "myuser" password: "mypasswd" # 数据上报elasticsearch配置,同filebeat output.elasticsearch: # Array of hosts to connect to. hosts: ["ip1:port1", "ip2:port2", "ip3:port3"] index: myindex-%{+yyyy.MM.dd} # Optional protocol and basic auth credentials. protocol: "http" username: "myuser" password: "mypasswd" # heartbeat监控配置,同filebeat xpack.monitoring.enabled: true xpack.monitoring.elasticsearch: protocol: "http" username: "myuser" password: "mypasswd" 通过上面配置可以看出,heartbeat和filebeat配置相似,对接elasticsearch、logstash、配置xpack监控、配置index模板的代码完全相同。 3)启动heartbeat: nohup ./heartbeat -e -c heartbeat.yml > /dev/null 2>&1 & 注:启动heartbeat时,会在elasticsearch中自动生成index模板,如果设置setup.template.enabled: false,则不会自动生成。可以通过如下命令手工生成index模板: ./heartbeat setup --template 同理,如果设置setup.dashboards.enabled: false,则启动heartbeat时不会自动生成dashboard图表。可以通过如下命令手工生成dashboard: ./heartbeat setup --dashboards 4)登录kibana,查看index模板、index pattern、index以及dashboard是否创建成功,是否有心跳监控数据上报; 监控数据dashboard图表展现: heartbeat自身监控: 使用Metricbeat收集指标数据 metricbeat用于收集服务器及服务的监控指标,比如cpu、内存、网络、进程等;metricbeat由一些列module组成,每个module负责收集某一类指标; 1)下载metricbeat,上传服务器并解压; tar -zxvf metricbeat-6.2.2-linux-x86_64.tar.gz cd metricbeat-6.2.2-linux-x86_64 可以看到metricbeat的目录结构如下: fields.yml kibana LICENSE.txt metricbeat metricbeat.reference.yml metricbeat.yml modules.d NOTICE.txt README.md 主要文件功能如下: metricbeat:metricbeat执行的二进制文件; metricbeat.yml:metricbeat的核心配置文件; fields.yml:metricbeat上报日志前,需要先在elasticsearch上建好index模板,从而在日志上报时,elasticsearch能够根据index模板自动创建index;该配置文件用于指定创建index时所需要的字段名及类型; metricbeat.reference.yml:存放metricbeat所有配置样例;实际运行不会使用,仅作为配置参考; 2)修改metricbeat.yml:除了modules外,其余配置包括elasticsearch配置、logstash配置、xpack监控、index模板配置等,与filebeat、heartbeat的配置相同。 metricbeat.modules: - module: system metricsets: - cpu # CPU usage - filesystem # File system usage for each mountpoint - fsstat # File system summary metrics - load # CPU load averages - memory # Memory usage - network # Network IO - process # Per process metrics - process_summary # Process summary - uptime # System Uptime #- core # Per CPU core usage #- diskio # Disk IO #- socket # Sockets and connection info (linux only) enabled: true period: 10s processes: ['.*'] # Configure the metric types that are included by these metricsets. cpu.metrics: ["percentages"] # The other available options are normalized_percentages and ticks. core.metrics: ["percentages"] # The other available option is ticks. 3)启动metricbeat: nohup ./metricbeat -e -c metricbeat.yml > /dev/null 2>&1 & 使用Packetbeat收集网络数据 packetbeat是轻量级的网络包分析工具,用于收集网络包数据; 1)下载packetbeat,上传服务器并解压; tar -zxvf packetbeat-6.2.2-linux-x86_64.tar.gz cd packetbeat-6.2.2-linux-x86_64 可以看到packetbeat的目录结构同其它beat组件目录结构相似: fields.yml kibana LICENSE.txt NOTICE.txt packetbeat packetbeat.reference.yml packetbeat.yml README.md 主要文件功能如下: packetbeat:packetbeat执行的二进制文件; packetbeat.yml:packetbeat的核心配置文件; fields.yml:packetbeat上报日志前,需要先在elasticsearch上建好index模板,从而在日志上报时,elasticsearch能够根据index模板自动创建index;该配置文件用于指定创建index时所需要的字段名及类型; packetbeat.reference.yml:存放packetbeat所有配置样例;实际运行不会使用,仅作为配置参考; 2)修改packetbeat.yml:除了网络协议相关配置外,其余配置包括elasticsearch配置、logstash配置、xpack监控、index模板配置等,与filebeat、heartbeat的配置相同。 # 网卡选择策略,any表示任意一个; packetbeat.interfaces.device: any # Set `enabled: false` or comment out all options to disable flows reporting. packetbeat.flows: # Set network flow timeout. Flow is killed if no packet is received before being # timed out. timeout: 30s # Configure reporting period. If set to -1, only killed flows will be reported period: 10s # 设置监听的协议类型及端口信息,根据实际需要配置; packetbeat.protocols: - type: http # Configure the ports where to listen for HTTP traffic. You can disable # the HTTP protocol by commenting out the list of ports. ports: [8088] 3)启动packetbeat: nohup ./packetbeat -e -c packetbeat.yml > /dev/null 2>&1 & 注:packetbeat需要GLIBC >= 2.7,否则运行报错如下: ./packetbeat: /lib64/tls/libc.so.6: version `GLIBC_2.7' not found (required by ./packetbeat) 参考 beats官方文档Getting Started With Filebeatslf4j-logback 日志以json格式导入ELKGetting Started With HeartbeatGetting started with MetricbeatGetting started with Packetbeat