首页 文章 精选 留言 我的

精选列表

搜索[elk],共1238篇文章
优秀的个人博客,低调大师

ELK系统之logstash问题:retrying failed action with response code: 429

版权声明:本文为博主原创文章,如需转载,请标明出处。 https://blog.csdn.net/alan_liuyue/article/details/78926015 问题来源 logstash在进行单机导入数据的时候,效果一直都是不错的,但是,当使用es集群之后,多台集群服务器一起运行logstash导入程序,一开始还是没问题的,但是运行了一段时间之后,就可能会产生以下的问题: [ERROR][logstash.outputs.elasticsearch]Retrying individual actions [INFO][logstash.outputs.elasticsearch]retrying failed action with response code: 429 (“reason”=>”rejected execution of org.elasticsearch.transport.TransportService…… [ERROR][logstash.outputs.elasticsearch]Attempted to send a bulk request to elasticsearch’ but Elasticsearch appears to be unreachable or down! …… 问题说明 从报错的内容提示来看,说明logstash写入到elasticsearch的速度赶不上从数据库读取数据的速度,输出数据阶段未完成的情况下,logstash仍然在不断的、快速的给ES发送bulk reuqest,从而导致ES集群的网络io过载,进而产生以上的问题提示,表明elasticsearch无法继续接收数据; 解决方法 根据以上问题的产生提示,再参照官网的建议和网友的解决方案,以下则是解决问题的一些步骤: 1. 首先,需要了解解决这个问题的相关的几个参数: (1). flush_size: 批量写入ES数量,累计缓冲event事件条数达到flush_size值会flush一次,这个参数默认是500; 这个参数就是调整缓冲区大小的; 为了高效使用elasticsearch的bulk API调用,我们将在刷新事件到Elasticsearch之前缓冲一定数量的事件; flush_size这个参数就是控制有多少事件在被批量写入到Elasticsearch之前需要被缓冲,增大flush_size的同时也增大Logstash的Heap大小; 这个参数在logstash.conf的output进行设置; (2). idle_flush_time: 批量写入ES频率,距离上次flush的时间之后idle_flush_time秒后也会flush一次,通常会结合flush_size一起来控制写入es的数量和频率,提高es的插入性能; 这个参数在logstash.conf的output进行设置; (3). pipeline.workers: pipeline管道线程数,官方建议是等于CPU内核数; (4). pipeline.output.workers: pipeline管道实际output时的线程数,一般小于或等于管道线程数,建议等于cpu内核数; (5). pipeline.batch.size: 单个工作线程在尝试执行过滤器和输出之前收集的最大事件数,默认125; 数值越大,处理则通常更高效,但增加了内存开销; 某些硬件配置要求通过设置LS_HEAP_SIZE变量来增加JVM堆大小,以避免使用此选项导致性能下降; 此参数的值超过最佳范围会导致由于频繁的垃圾回收或与内存不足异常相关的JVM崩溃而导致性能下降; 调整pipeline.batch.size设置大小可调整发送到Elasticsearch的批量请求的大小。 (6). pipeline.batch.delay: 此设置调整Logstash管道的延迟,默认5; 流水线批处理延迟是Logstash在当前管道工作线程中接收到事件后等待新消息的最大时间(毫秒); 在此时间过后,Logstash开始执行过滤器和输出.Logstash在接收事件和在过滤器中处理该事件之间等待的最大时间是pipeline.batch.delay和pipeline.batch.size设置的乘积。 (7). 流动计数: logstash管道处理事件的总数由pipeline.workers和pipeline.batch.size设置的乘积确定,称为流动计数; 在调整pipeline.workers和pipeline.batch.size设置时,应考虑当接收事件总数过大时,保证管道需要足够的内存来处理这些尖峰。 2. 解决途径: 延长管道接收事件等待事件,增大单个工作线程接收的批量处理的事件数,从而降低bulk-request的发送频率,防止网络io过载; 同时在输出端使用flush_size和idle_flush_time结合去控制批量写入es的数量和刷新频率; 3. 结果参数(参数配置需结合自身的生产环境,需自行去调优,这里仅供参考): logstash.conf文件的output参数: flush_size=>1000 idle_flush_time=>15 logstash.yml文件的配置参数: pipeline.workers:10 pipeline.output.workers:10 pipeline.batch.size:3000 pipeline.batch.delay:100

优秀的个人博客,低调大师

centos7安装配置ELK(Elasticsearch+Logstash+Kibana)

1.server端安装 #安装elasticsearch yum install java-1.8.0-openjdk ruby yum install elasticsearch-2.1.0.rpm vi/etc/elasticsearch/elasticsearch.yml # cluster.name: my-application cluster.name: wc # network.host: 192.168.0.1 network.host: 127.0.0.1 systemctl start elasticsearch rpm -qc elasticsearch curl -X GEThttp://localhost:9200/ vi/etc/nginx/conf.d/elasticsearch.conf server { listen 80; server_name 110.110.110.110;: location / { proxy_pass http://110.110.110.110:9200; proxy_redirect off; proxy_set_header Host $host; proxy_set_header X-Real-IP $remote_addr; proxy_set_header X-Forwarded-Proto https; proxy_set_header X-Forwarded-For $proxy_add_x_forwarded_for; } } 浏览器输入http://110.110.110.110:9200/ #安装redis yum install redis mkdir -p /opt/redis cd /opt/redis mkdir {db,log,etc} redis-server /etc/redis.conf & 启动默认的redis配置文件 #安装kibana tar -zxvf kibana-5.0.0-snapshot-linux-x64.tar.gz mv kibana-5.0.0-snapshot-linux-x64 kibana cp -R kibana /opt/ vi /etc/systemd/system/kibana.service [Service] ExecStart=/opt/kibana/bin/kibana [Install] WantedBy=multi-user.target systemctl start kibana systemctl enable kibana systemctl status kibana http://IP:5601 报错1:Unable to connect to Elasticsearch at http://localhost:9200. Retrying in 2.5 seconds 解决1: vi/etc/elasticsearch/elasticsearch.yml network.host: 127.0.0.1 报错2:No existing Kibana index found 解决2: 报错3:Warning No default index pattern. You must select or create one to continue. 解决3: #安装logstash yum install logstash-2.1.0-1.noarch.rpm cd /etc/pki/tls openssl req -config /etc/pki/tls/openssl.cnf -x509 -days 3650 -batch -nodes -newkey rsa:2048 -keyout private/logstash-forwarder.key -out certs/logstash-forwarder.crt vi /etc/logstash/conf.d/logstasg-hello.conf input { lumberjack { # The port to listen on port => 5000 # The paths to your ssl cert and key ssl_certificate => "/etc/pki/tls/certs/logstash-forwarder.crt" ssl_key => "/etc/pki/tls/private/logstash-forwarder.key" type => "this forwarder's file have no type!" } } filter { if [type] == "syslog" { grok { match => { "message" => "%{SYSLOGTIMESTAMP:syslog_timestamp} %{SYSLOGHOST:syslog_hostname} %{DATA:syslog_program}(?:\[%{POSINT:syslog_pid}\])?: %{GREEDYDATA:syslog_message}" } add_field => [ "received_at", "%{@timestamp}" ] add_field => [ "received_from", "%{host}" ] } syslog_pri { } date { match => [ "syslog_timestamp", "MMM d HH:mm:ss", "MMM dd HH:mm:ss" ] } } } output { elasticsearch { host => localhost } stdout { codec => rubydebug } } /opt/logstash/bin/logstash -f /etc/logstash/conf.d/logstash-hello.conf #安装lnmp环境 yum install nginx php vi /etc/nginx/conf.d/logstash.conf server { listen 80; server_name IP; location / { proxy_pass http://localhost:5601; proxy_redirect off; proxy_set_header Host $host; proxy_set_header X-Real-IP $remote_addr; proxy_set_header X-Forwarded-For $proxy_add_x_forwarded_for; client_max_body_size 10m; client_body_buffer_size 128k; proxy_connect_timeout 90; proxy_send_timeout 90; proxy_read_timeout 90; proxy_buffer_size 4k; proxy_buffers 4 32k; proxy_busy_buffers_size 64k; proxy_temp_file_write_size 64k; } } systemctl start nginx 2.client端安装 3.elasticsearch配置文件详解 cat /etc/elasticsearch里的logging.yml用默认配置,elasticsearch.yml配置如下: cluster.name: elasticsearch 配置es的集群名称,默认是elasticsearch,es会自动发现在同一网段下的es,如果在同一网段下有多个集群,就可以用这个属性来区分不同的集群。 node.name: "Franz Kafka" 节点名,默认随机指定一个name列表中名字,该列表在es的jar包中config文件夹里name.txt文件中,其中有很多作者添加的有趣名字。 node.master: true 指定该节点是否有资格被选举成为node,默认是true,es是默认集群中的第一台机器为master,如果这台机挂了就会重新选举master。 node.data: true 指定该节点是否存储索引数据,默认为true。 index.number_of_shards: 5 设置默认索引分片个数,默认为5片。 index.number_of_replicas: 1 设置默认索引副本个数,默认为1个副本。 path.conf: /path/to/conf 设置配置文件的存储路径,默认是es根目录下的config文件夹。 path.data: /path/to/data 设置索引数据的存储路径,默认是es根目录下的data文件夹,可以设置多个存储路径,用逗号隔开,例: path.data: /path/to/data1,/path/to/data2 path.work: /path/to/work 设置临时文件的存储路径,默认是es根目录下的work文件夹。 path.logs: /path/to/logs 设置日志文件的存储路径,默认是es根目录下的logs文件夹 path.plugins: /path/to/plugins 设置插件的存放路径,默认是es根目录下的plugins文件夹 bootstrap.mlockall: true 设置为true来锁住内存。因为当jvm开始swapping时es的效率 会降低,所以要保证它不swap,可以把ES_MIN_MEM和ES_MAX_MEM两个环境变量设置成同一个值,并且保证机器有足够的内存分配给es。 同时也要允许elasticsearch的进程可以锁住内存,linux下可以通过`ulimit -l unlimited`命令。 network.bind_host: 192.168.0.1 设置绑定的ip地址,可以是ipv4或ipv6的,默认为0.0.0.0。 network.publish_host: 192.168.0.1 设置其它节点和该节点交互的ip地址,如果不设置它会自动判断,值必须是个真实的ip地址。 network.host: 192.168.0.1 这个参数是用来同时设置bind_host和publish_host上面两个参数。 transport.tcp.port: 9300 设置节点间交互的tcp端口,默认是9300。 transport.tcp.compress: true 设置是否压缩tcp传输时的数据,默认为false,不压缩。 http.port: 9200 设置对外服务的http端口,默认为9200。 http.max_content_length: 100mb 设置内容的最大容量,默认100mb http.enabled: false 是否使用http协议对外提供服务,默认为true,开启。 gateway.type: local gateway的类型,默认为local即为本地文件系统,可以设置为本地文件系统,分布式文件系统,hadoop的HDFS,和amazon的s3服务器,其它文件系统的设置方法下次再详细说。 gateway.recover_after_nodes: 1 设置集群中N个节点启动时进行数据恢复,默认为1。 gateway.recover_after_time: 5m 设置初始化数据恢复进程的超时时间,默认是5分钟。 gateway.expected_nodes: 2 设置这个集群中节点的数量,默认为2,一旦这N个节点启动,就会立即进行数据恢复。 cluster.routing.allocation.node_initial_primaries_recoveries: 4 初始化数据恢复时,并发恢复线程的个数,默认为4。 cluster.routing.allocation.node_concurrent_recoveries: 2 添加删除节点或负载均衡时并发恢复线程的个数,默认为4。 indices.recovery.max_size_per_sec: 0 设置数据恢复时限制的带宽,如入100mb,默认为0,即无限制。 indices.recovery.concurrent_streams: 5 设置这个参数来限制从其它分片恢复数据时最大同时打开并发流的个数,默认为5。 discovery.zen.minimum_master_nodes: 1 设置这个参数来保证集群中的节点可以知道其它N个有master资格的节点。默认为1,对于大的集群来说,可以设置大一点的值(2-4) discovery.zen.ping.timeout: 3s 设置集群中自动发现其它节点时ping连接超时时间,默认为3秒,对于比较差的网络环境可以高点的值来防止自动发现时出错。 discovery.zen.ping.multicast.enabled: false 设置是否打开多播发现节点,默认是true。 discovery.zen.ping.unicast.hosts: ["host1", "host2:port", "host3[portX-portY]"] 设置集群中master节点的初始列表,可以通过这些节点来自动发现新加入集群的节点。 下面是一些查询时的慢日志参数设置 index.search.slowlog.level: TRACE index.search.slowlog.threshold.query.warn: 10s index.search.slowlog.threshold.query.info: 5s index.search.slowlog.threshold.query.debug: 2s index.search.slowlog.threshold.query.trace: 500ms index.search.slowlog.threshold.fetch.warn: 1s index.search.slowlog.threshold.fetch.info: 800ms index.search.slowlog.threshold.fetch.debug:500ms index.search.slowlog.threshold.fetch.trace: 200ms 本文转自 guowang327 51CTO博客,原文链接:http://blog.51cto.com/guowang327/1718601,如需转载请自行联系原作者

优秀的个人博客,低调大师

CENTOS6.5安装日志分析ELK elasticsearch + logstash + redis + kibana

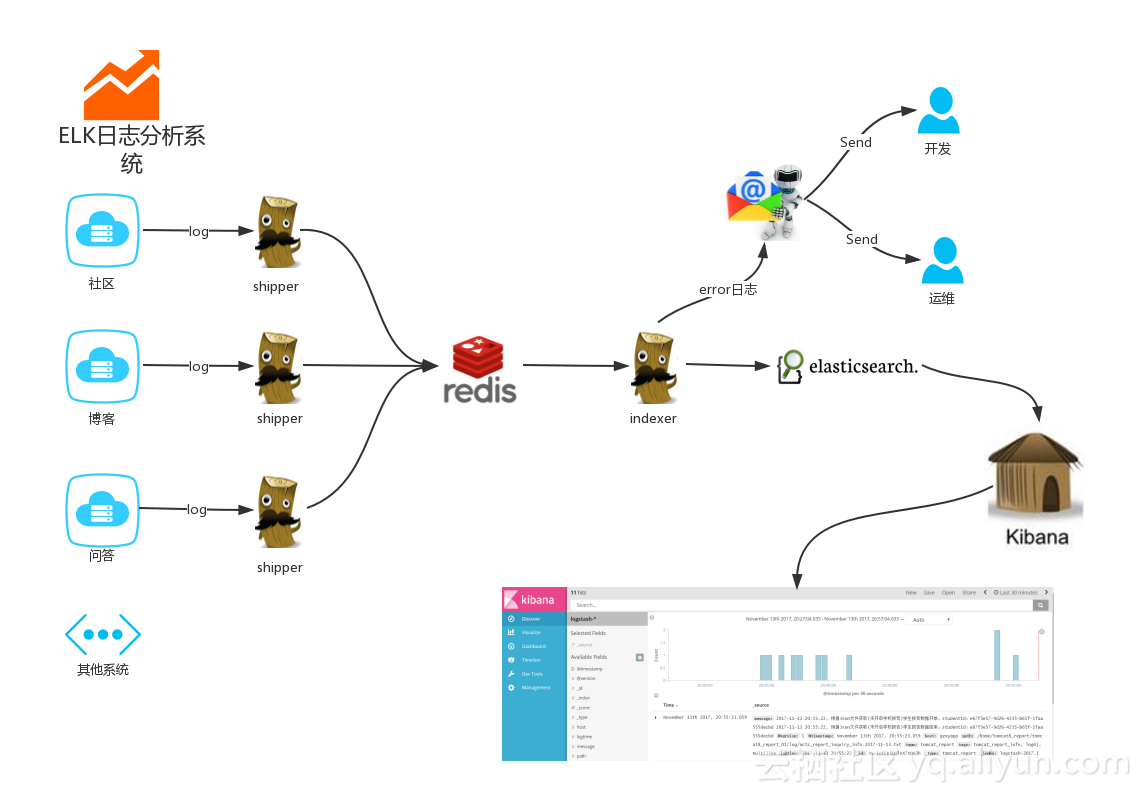
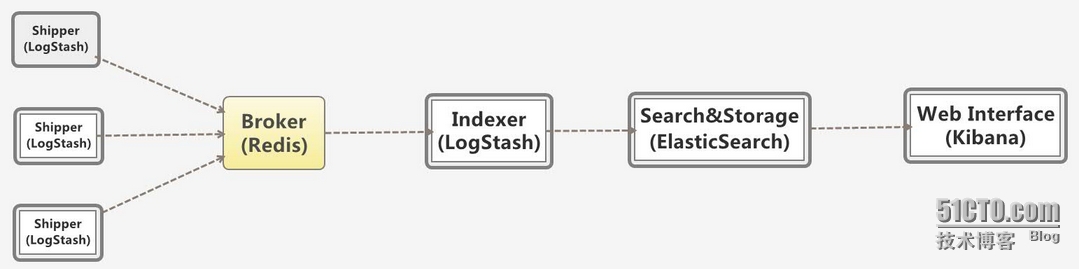
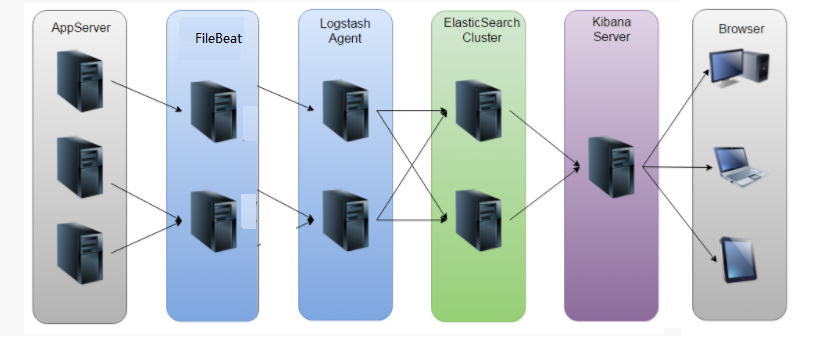
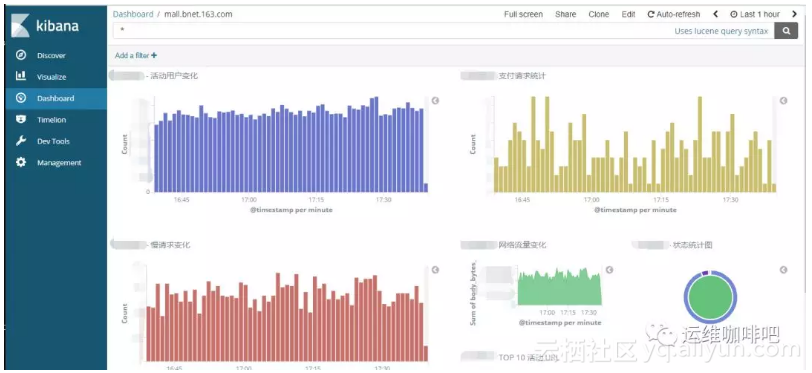
1、日志平台的工作流程 多个独立的agent(Shipper)负责收集不同来源的数据,一个中心agent(Indexer)负责汇总和分析数据,在中心agent前的Broker(使用redis实现)作为缓冲区,中心agent后的ElasticSearch用于存储和搜索数据,前端的Kibana提供丰富的图表展示。 Shipper表示日志收集,使用LogStash收集各种来源的日志数据,可以是系统日志、文件、redis、mq等等; Broker作为远程agent与中心agent之间的缓冲区,使用redis实现,一是可以提高系统的性能,二是可以提高系统的可靠性,当中心agent提取数据失败时,数据保存在redis中,而不至于丢失; 中心agent也是LogStash,从Broker中提取数据,可以执行相关的分析和处理(Filter); ElasticSearch用于存储最终的数据,并提供搜索功能; Kibana提供一个简单、丰富的web界面,数据来自于ElasticSearch,支持各种查询、统计和展示; 2、机器的部署情况 192.168.1.140 # redis 服务器,角色broker 192.168.1.140 # logstash 角色indexer 服务器,集成elasticsearch,kibana,必须有安装web服务 192.168.1.132 # nginx服务器,角色生产服务器,logstash需要收集它的日志 这里选用的软件的版本: logstash-1.4.2 elasticsearch-1.4.2 redis-2.6.16 kibana 是logstash内带的 这些软件之间有兼容性问题,请用其他代替版本的同学注意。 2.1安装logstash-1.4.2 yum-y install java-1.7.0-openjdk 安装logstash需要jdk的支持 wget https://download.elasticsearch.org/logstash/logstash/logstash-1.4.2.tar.gz tar xzvf logstash-1.4.2.tar.gz-C /app/ && mv /app/logstash-1.4.2 /app/logstash mkdir -p /app/logstash/conf 注:如果yum出现这样的问题: 需要按照epel rpm -ivhhttp://dl.fedoraproject.org/pub/epel/6/x86_64/epel-release-6-8.noarch.rpm rpm --import /etc/pki/rpm-gpg/RPM-GPG-KEY-EPEL-6 测试安装 cd /app/logstash/bin ./logstash-e'input { stdin { } } output { stdout {} }' 输入“good job”, 如果出现类似下图,说明logstash正常工作 2.2 安装elasticsearch-1.4.2 wget https://download.elasticsearch.org/elasticsearch/elasticsearch/elasticsearch-1.4.2.tar.gz tar xzvf elasticsearch-1.4.2.tar.gz-C /app/ cd /app/elasticsearch-1.4.2/config 修改配置文件elasticsearch.yml discovery.zen.ping.multicast.enabled:false #关闭广播,如果局域网有机器开9300 端口,服务会启动不了 network.host:192.168.1.140 #指定主机地址,其实是可选的,但是最好指定因为后面跟kibana集成的时候会报http连接出错(直观体现好像是监听了:::9200 而不是0.0.0.0:9200) http.cors.allow-origin:"/.*/" http.cors.enabled:true #这2项都是解决跟kibana集成的问题,错误体现是 你的elasticsearch 版本过低 启动elasticsearch cd /app/elasticsearch-1.4.2/bin ./elasticsearch # 配置阶段建议直接启动,日志会输出到stdout,-d 选项表示以daemon的方式启动,如果没有出现error ,表示服务正常启动 测试logstash 跟elasticsearch数据交互 /app/logstash/bin/logstash-e'input { stdin { } } output { elasticsearch { host => 192.168.1.140 } }' 输入you know curl 'http://192.168.1.140:9200/_search?pretty' # 如果有输出且没有出现错误表示服务器交互成功 注:可能出现如下错误信息,我也不知道什么原因,我没有管 不过不耽误后面的搭建 有谁知道这个是怎么回事 或者怎么解决的请留言 谢谢!! 2.3 安装kibana cd /app/logstash/vendor vim kibana/config.js #elasticsearch: "http://"+window.location.hostname+":9200",修改成"http://192.168.1.140:9200" cp -Rv kibana /var/www/html 拷贝网页的配置 /etc/init.d/httpd start / service httpd start 能够访问urlhttp://192.168.1.140/kibana/index.html 看到这样的画面 2.4安装redis #tar xzvf redis-2.6.16.tar.gz-C /app #cd /app/redis-2.6.16 && mkdir conf #make target=linux26 (报错 可能缺少一些编译的工具,按照提示,yum安装就行了 如果出现如下报错: 可以执行 make MALLOC=libc +++++++++++++++++++++++++++++++++++++++++++++++++++++++++++++++++++++++++++ 原因:查看redis的源码src/zmalloc.c可以看到如下代码: #if defined(USE_TCMALLOC) #define malloc(size) tc_malloc(size) #define calloc(count,size) tc_calloc(count,size) #define realloc(ptr,size) tc_realloc(ptr,size) #define free(ptr) tc_free(ptr) #elif defined(USE_JEMALLOC) #define malloc(size) je_malloc(size) #define calloc(count,size) je_calloc(count,size) #define realloc(ptr,size) je_realloc(ptr,size) #define free(ptr) je_free(ptr) 可以看到源码中首先会判断系统中是否存在tcmalloc内存分配器,如果没有,则使用jemalloc内存分配器,如果连jemalloc分配器也没有找到,就会报错了。 本次现网部署Redis后,因为没有jemalloc分配器,导致碎片率达到了1.59,redis的内存占用率也就是实际内存占用的1.59倍,这个数据量是非常恐怖的,对内存资源是个相当大的损耗。 在现网环境的linux系统中,可能没有预先安装Jemalloc分配器,需要手动安装。 1、wget http://www.canonware.com/download/jemalloc/jemalloc-3.2.0.tar.bz2 2、tar jxfjemalloc-3.2.0.tar.bz2(tar.bz2的压缩格式使用tar jxf解压) 3、cdjemalloc-3.2.0 4、./configure 5、make && make install 6、ldconfig 过程完成后,在切回到redis-2.6.14目录中,重新执行make命令 当然如果不想使用jemalloc分配器,可以强制使用如下命令来安装redis: make MALLOC=libc(libc是默认的内存分配器,不过经过验证,碎片率是最高的) 经现网验证: 1)使用libc内存分配器的话,内存碎片率可以达到1.6左右 2)但是使用jemalloc,碎片率一般在1.1以内 3)对于tcmalloc,和jemalloc的结果差不多,但是因为redis暂时还没有集成tcmalloc,所以需要另外来安装,过程详见: http://blog.nosqlfan.com/html/3490.html ++++++++++++++++++++++++++++++++++++++++++++++++++++++++++++++++++++++ #./src/redis-serverredis.conf # daemonize yes 使用默认的配置文件 2.5 集成logstash redis vim /app/logstash/conf/nginx_acces.conf 写入如下内容 input { redis { host => '192.168.1.140' # 我方便测试没有指定password,最好指定password data_type => 'list' port => "6379" key => 'logstash:redis' #自定义 type => 'redis-input' #自定义 } } output { elasticsearch { host => "192.168.1.140" # 由于redis和elasticsearch在一台机器上所以IP是一个 codec => "json" protocol => "http" #版本1.0+ 必须指定协议http } } 验证配置文件 cd /app/logstash #bin/logstash-f ./conf/nginx_access.conf-t # 无误后启动 #bin/logstash -f ./conf/nginx_access.conf --verbose # 要检查错误 --debug 启动成功 有警告没有管 2.6 日志接入 另一台机器 安装logstash 过程 跟上面一样 但是 nginx_access.conf 配置如下 input { file { type=>"nginx_access" path=>"/var/log/nginx/access.log" 日志的路径 } } output { stdout { codec=>rubydebug } redis { host=>'192.168.1.140' 对接的redisIP data_type=>'list' key=>'logstash:redis' } } 到此配置告一段落,下面验收成果 刷新nginx日志 然后在132上的logstash能够看到如下 然后在140端能够看到: 重点是访问http://192.168.1.140/kibana/index.html 验收最后的页面 这个是一个简单的格式 已经设计好的 当然可以自己定义了。 定义的方法:http://blog.chinaunix.net/xmlrpc.php?r=blog/article&id=4938039&uid=24940078 点进去以后的界面是这样的: 3 安装插件 安装bigdesk 要想知道整个插件的列表,请访问http://www.elasticsearch.org/guide/reference/modules/plugins/ 插件还是很多的,个人认为比较值得关注的有以下几个,其他的看你需求,比如你要导入数据当然就得关注river了。 该插件可以查看集群的jvm信息,磁盘IO,索引创建删除信息等,适合查找系统瓶颈,监控集群状态等,可以执行如下命令进行安装,或者访问项目地址:https://github.com/lukas-vlcek/bigdesk 先上一张效果图: 这里我是按照https://github.com/lukas-vlcek/bigdesk 上面的第二种 git clone的方式做的(第一种没成功。。。) 首先确保安装git yum install -y git 然后将按照上面的命令做: git clonehttps://github.com/lukas-vlcek/bigdesk.git cd bigdesk/ git tag [... some tags left out for brevity ....] v2.2.2 v2.2.3 v2.4.0 git checkout v2.4.0 然后将整个bigdesk目录拷贝到http下 cp -ar bigdesk /var/www/html/ 然后就可以访问了 http://192.168.1.140/bigdesk 先修改host 然后连接 然后会出来一个小图标(成果展示图里的) 点击小图标就能出现监控的选项了。 声明:该文参考了如下几位的博客,但是是我亲自搭建了整个过程,对整个的流程进行了新的把控和优化。 http://blog.chinaunix.net/xmlrpc.php?r=blog/article&uid=17291169&id=4898582 http://www.mamicode.com/info-detail-475881.html http://nkcoder.github.io/blog/20141031/elkr-log-platform-deploy/ 本文转自 憬薇 51CTO博客,原文链接:http://blog.51cto.com/welcomeweb/1684696
资源下载

更多资源
Mario

Mario

马里奥是站在游戏界顶峰的超人气多面角色。马里奥靠吃蘑菇成长,特征是大鼻子、头戴帽子、身穿背带裤,还留着胡子。与他的双胞胎兄弟路易基一起,长年担任任天堂的招牌角色。

腾讯云软件源

腾讯云软件源

为解决软件依赖安装时官方源访问速度慢的问题,腾讯云为一些软件搭建了缓存服务。您可以通过使用腾讯云软件源站来提升依赖包的安装速度。为了方便用户自由搭建服务架构,目前腾讯云软件源站支持公网访问和内网访问。

Nacos

Nacos

Nacos /nɑ:kəʊs/ 是 Dynamic Naming and Configuration Service 的首字母简称,一个易于构建 AI Agent 应用的动态服务发现、配置管理和AI智能体管理平台。Nacos 致力于帮助您发现、配置和管理微服务及AI智能体应用。Nacos 提供了一组简单易用的特性集,帮助您快速实现动态服务发现、服务配置、服务元数据、流量管理。Nacos 帮助您更敏捷和容易地构建、交付和管理微服务平台。

Sublime Text

Sublime Text

Sublime Text具有漂亮的用户界面和强大的功能,例如代码缩略图,Python的插件,代码段等。还可自定义键绑定,菜单和工具栏。Sublime Text 的主要功能包括:拼写检查,书签,完整的 Python API , Goto 功能,即时项目切换,多选择,多窗口等等。Sublime Text 是一个跨平台的编辑器,同时支持Windows、Linux、Mac OS X等操作系统。

用户登录
用户注册
修改密码
忘记密码