首页 文章 精选 留言 我的

精选列表

搜索[MaaS平台],共10000篇文章
优秀的个人博客,低调大师

ELK日志分析平台搭建全程

环境: OS:Centos 6.6 elasticsearch-5.6.3.tar.gz jdk-8u151-linux-x64.tar.gz kibana-5.6.3-linux-x86_64.tar.gz logstash-5.6.3.tar.gz node-v6.11.4-linux-x64.tar.xz 一、准备环境: 1、创建用户,并给安装目录设置权限 1 2 3 4 [root@1inux~]#groupaddelk [root@1inux~]#useradd-gelkelk [root@1inux~]#mkdir/elk [root@1inux~]#chown-Relk:elk/elk 修改系统某些参数值:【如不修改启动时会报错】 1 2 3 4 5 6 7 8 9 10 11 12 13 14 15 16 17 18 19 [root@1inux~]#vim/etc/security/limits.conf //添加一下内容 --------------------------- *softnofile 65536 *hardnofile 65536 *softnproc 2048 *hardnproc 4096 ---------------------------- [root@bogonelk]#vim/etc/security/limits.d/ 90 -nproc.conf //添加如下内容 *softnproc 2048 [root@1inux~]#vim/etc/sysctl.conf //添加以下内容 ------------------ fs.file- max = 65536 vm.max_map_count= 655360 ---------------------- [root@1inux~]#sysctl-p //查看vm.max_map_count值是否修改成功 修改进程数: [root@1inux~]#ulimit-u 2048 安装Java [root@1inux elk]# mkdir /usr/local/Java [root@1inux elk]# tar -zxvf jdk-8u151-linux-x64.tar.gz -C /usr/local/Java 添加环境变量: [root@1inux jdk1.8.0_151]# vim /etc/profile 添加如下: 1 2 3 exportJAVA_HOME=/usr/local/Java/jdk1.8.0_151 exportPATH=$PATH:$JAVA_HOME/bin exportCLASSPATH=.:$JAVA_HOME/lib/tools.jar:$JAVA_HOME/lib/dt.jar:$CLASSPAT 重新加载 [root@1inux jdk1.8.0_151]# source /etc/profile 查看是否安装成功: 1 2 3 4 [root@1inuxjdk1 .8. 0_151]#java-version javaversion" 1.8. 0_151" Java(TM)SERuntimeEnvironment(build 1.8. 0_151-b12) JavaHotSpot(TM) 64 -BitServerVM(build 25.151 -b12,mixedmode) 二:安装ELK 1、安装elasticsearch 1 2 3 4 5 6 #tar-zxvfelasticsearch-5.6.3.tar.gz 修改配置文件: vim./elasticsearch-5.6.3/config/elasticsearch.yml //设置监听IP及监听端口: network.host:0.0.0.0//设置监听IP http.port:9200//设置监听端口 注:elasticsearch不能使用root用户启动 启动elasticsearch//第一次启动有点慢: 1 2 3 4 5 6 7 [elk@1inuxroot]$cd/elk/elasticsearch-5.6.3/bin [elk@1inuxbin]$./elasticsearch 然后查看端口: [root@1inux~]#ss-tnl|grep9200 LISTEN0128::ffff:192.168.159.130:9200:::* [root@1inux~]# 1.1安装部署head 编辑elasticsearch配置文件做如下修改: 1 2 3 4 5 6 #vim/elk/elasticsearch-5.6.3/config/elasticsearch.yml node.name:node-1inux//修改集群名字 cluster.name:my-1inux//修改节点名字 //增加新的参数,这样head插件可以访问es http.cors.enabled:true http.cors.allow-origin: "*" 1)安装git 1 [root@ 1 inux/]#yum-yinstallgit 下载代码: 1 [root@ 1 inuxelk]#gitclonegit://github.com/mobz/elasticsearch-head.git 修改head目录权限: 1 [root@1inuxelk]#chown-Relk:elkelasticsearch-head 2)下载安装node https://nodejs.org/en/download/ 然后下载xz进行解压 1 2 3 #yum-yinstallxz [root@1inuxelk]#xz-dnode-v6.11.4-linux-x64.tar.xz [root@1inuxelk]#tar-xvfnode-v6.11.4-linux-x64.tar 添加node的环境变量 1 2 3 4 5 6 7 [root@ 1 inuxnode-v 6.11 . 4 -linux-x 64 ]#vim/etc/profile 添加如下: exportNODE_HOME=/elk/node-v 6.11 . 4 -linux-x 64 exportPATH=$PATH:$NODE_HOME/bin 重新加载 [root@ 1 inuxnode-v 6.11 . 4 -linux-x 64 ]#source/etc/profile 查看是否生效: 1 2 3 4 5 6 [root@1inuxnode-v6.11.4-linux-x64]#echo$NODE_HOME /elk/node-v6.11.4-linux-x64 [root@1inuxnode-v6.11.4-linux-x64]#node-v v6.11.4 [root@1inuxnode-v6.11.4-linux-x64]#npm-v 3.10.10 1 2 3 切换国内镜像源: npmconfig set registryhttps: //registry.npm.taobao.org npmconfig set disturlhttps: //npm.taobao.org/dist 3)安装grunt 1 2 [root@1inuxnode_modules]#npminstall-ggrunt [root@1inuxnode-v6.11.4-linux-x64]#npminstallgrunt-cli-g 查看是否安装成功: 1 2 [root@1inuxnode-v6 .11.4 -linux-x64]#grunt-version grunt-cliv1 .2.0 修改服务器监听地址 1 2 [root@1inuxelk]#vim/elk/elasticsearch-head/Gruntfile.js hostname:'*', 修改链接地址: 1 2 3 4 [root@1inuxelk]#vim/elk/elasticsearch-head/_site/app.js this .base_uri= this .config.base_uri|| this .prefs.get( "app-base_uri" )||" 修改为: this .base_uri= this .config.base_uri|| this .prefs.get( "app-base_uri" )|| "http://192.168.159.130:9200" ; 运行head 1 2 3 4 在head目录中执行 [root@1inuxelasticsearch-head]#npminstall 启动: [root@1inuxelasticsearch-head]#gruntserver 2、安装kibana [root@1inux elk]# tar -zxvf kibana-5.6.3-linux-x86_64.tar.gz 1 2 3 4 5 6 7 解压后编辑配置文件; [root@ 1 inuxbin]#vim../config/kibana.yml//修改为elasticsearch的访问地址及端口如下 #server.host: "localhost" server.host: "192.168.159.130" #elasticsearch.url: "http://localhost:9200" elasticsearch.url:" 然后保存启动如下; 1 2 3 4 5 6 7 8 [root@1inuxbin]#./kibana log [15:45:26.952][info][status][plugin:kibana@5.6.3]Statuschangedfromuninitializedtogreen-Ready log [15:45:27.067][info][status][plugin:elasticsearch@5.6.3]Statuschangedfromuninitializedtoyellow-WaitingforElasticsearch log [15:45:27.118][info][status][plugin:console@5.6.3]Statuschangedfromuninitializedtogreen-Ready log [15:45:27.136][info][status][plugin:metrics@5.6.3]Statuschangedfromuninitializedtogreen-Ready log [15:45:27.566][info][status][plugin:timelion@5.6.3]Statuschangedfromuninitializedtogreen-Ready log [15:45:27.697][info][listening]Serverrunningathttp://localhost:5601 log [15:45:27.699][info][status][uisettings]Statuschangedfromuninitializedtoyellow-Elasticsearchpluginisyellow 3、安装logstash-5.6.3.tar.gz 1 2 3 [root@ 1 inuxelk]#tar-zxvflogstash -5.6 . 3 .tar.gz 解压后编辑配置文件,然后就可以使用了 编写文件 1 2 3 4 5 6 7 8 9 10 11 12 13 14 15 16 17 18 编辑文件#vim/config/test.conf input{ file{ type=> "nginx_log" path=> "/var/log/nginx/access.log" start_position=> "beginning" } } output{ elasticsearch{ hosts=> "192.168.159.130" index=> "1inux" } stdout{codec=>rubydebug} } 启动: root@1inuxbin]#./logstash-f../config/test.conf 报错: 1、 1 2 3 [root@bogonelk]#./elasticsearch- 5.6.3 /bin/elasticsearch [ 2017 - 10 -25T06: 29 : 04 , 996 ][WARN][o . e . b . ElasticsearchUncaughtExceptionHandler][]uncaughtexception in thread[main] org . elasticsearch . bootstrap . StartupException:java . lang . RuntimeException:can not runelasticsearch as root 解决方案:使用elk用户启动 问题二、 1 2 3 4 5 6 ERROR:[4]bootstrapchecksfailed [1]:maxfiledescriptors[4096] for elasticsearchprocess is toolow,increasetoatleast[65536] [2]:maxnumberofthreads[1024] for user[elk] is toolow,increasetoatleast[2048] [3]:max virtual memoryareasvm.max_map_count[65530] is toolow,increasetoatleast[262144] 参考上面系统修改 问题三、 1 2 3 4 编辑elasticsearch配置文件 [ 4 ]:systemcallfiltersfailedtoinstall;checkthelogsandfixyourconfigurationordisablesystemcallfiltersatyourownrisk 在bootstrap.memory_lock下面添加: bootstrap.system_call_filter:false 本文转自 1inux 51CTO博客,原文链接:http://blog.51cto.com/1inux/1976229

优秀的个人博客,低调大师

运维监控平台之ganglia

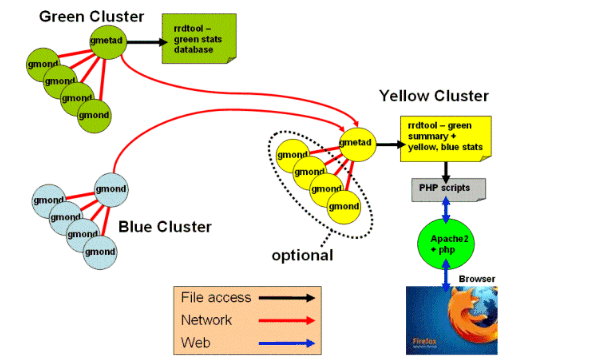
1、ganglia简介 Ganglia 是一款为 HPC(高性能计算)集群而设计的可扩展的分布式监控系统,它可以 监视和显示集群中的节点的各种状态信息,它由运行在各个节点上的 gmond 守护进程来采 集 CPU 、内存、硬盘利用率、 I/O 负载、网络流量情况等方面的数据,然后汇总到 gmetad 守护进程下,使用 rrdtool 存储数据,最后将历史数据以曲线方式通过 PHP 页面呈现。 Ganglia 的特点如下: 良好的扩展性,分层架构设计能够适应大规模服务器集群的需要 负载开销低,支持高并发 广泛支持各种操作系统( UNIX 等)和 cpu 架构,支持虚拟 2、ganglia组成 Ganglia 监控系统有三部分组成,分别是 gmond、 gmetad、 webfrontend,作用如下。 gmond: 即为 ganglia monitoring daemon,是一个守护进程,运行在每一个需要监测 的节点上,用于收集本节点的信息并发送到其他节点,同时也接收其他节点发过了 的数据,默认的监听端口为 8649。 gmetad: 即为 ganglia meta daemon,是一个守护进程,运行在一个数据汇聚节点上, 定期检查每个监测节点的 gmond 进程并从那里获取数据,然后将数据指标存储在 本地 RRD 存储引擎中。 webfrontend: 是一个基于 web 的图形化监控界面,需要和 Gmetad 安装在同一个节 点上,它从 gmetad 取数据,并且读取 RRD 数据库,通过 rrdtool 生成图表,用于 前台展示,界面美观、丰富,功能强大。下图是其结构 环境规划(centos6.7) 服务器端 172.16.80.117 客户端 172.16.80.117 172.16.80.116 3、ganglia的安装 [root@centos02tools]#wgetwget [root@centos02tools]#rpm-ivhepel-release-6-8.noarch.rpm [root@centos02tools]#yuminstallganglia-gmetad.x86_64ganglia-gmond.x86_64ganglia-gmond-python.x86_64-y 修改服务端配置文件 [root@centos02tools]#vim/etc/ganglia/gmetad.conf data_source"mycluster"172.16.80.117172.16.80.116 gridname"MyGrid" gangliaweb的安装(基于LNMP环境) [root@centos02tools]#tarxfganglia-web-3.7.2.tar.gz [root@centos02tools]#mvganglia-web-3.7.2/application/nginx/html/ganglia 修改gangliaweb的php配置文件 [root@centos02tools]#vim/application/nginx/html/ganglia/conf_default.php $conf['gweb_confdir']="/application/nginx/html/ganglia"; nginx配置 [root@centos02ganglia]#cat/application/nginx/conf/nginx.conf worker_processes2; events{ worker_connections1024; } http{ log_formatmain'$remote_addr-$remote_user[$time_local]"$request"' '$status$body_bytes_sent"$http_referer"' '"$http_user_agent""$http_x_forwarded_for"'; includemime.types; default_typeapplication/octet-stream; sendfileon; keepalive_timeout65; server{ listen80; server_namewww.martin.commartin.com; location/{ roothtml/zabbix; indexindex.phpindex.htmlindex.htm; } location~.*\.(php|php5)?${ roothtml/zabbix; fastcgi_pass127.0.0.1:9000; fastcgi_indexindex.php; includefastcgi.conf; } access_loglogs/access_zabbix.logmain; } server{ listen80; server_nameganglia.martin.com; location/{ roothtml/ganglia; indexindex.phpindex.htmlindex.htm; } location~.*\.(php|php5)?${ roothtml/ganglia; fastcgi_pass127.0.0.1:9000; fastcgi_indexindex.php; includefastcgi.conf; } access_loglogs/access_bbs.logmain; } ###status server{ listen80; server_namestatus.martin.org; location/{ stub_statuson; access_logoff; } } } 访问测试,报错如下 Fatalerror:Errorsweredetectedinyourconfiguration. DWOOcompiledtemplatesdirectory'/application/nginx/html/ganglia/dwoo/compiled'isnotwriteable. Pleaseadjust$conf['dwoo_compiled_dir']. DWOOcachedirectory'/application/nginx/html/ganglia/dwoo/cache'isnotwriteable. Pleaseadjust$conf['dwoo_cache_dir']. in/application/nginx-1.6.3/html/ganglia/eval_conf.phponline126 解决办法: [root@centos02tools]#mkdir/application/nginx/html/ganglia/dwoo/compiled [root@centos02tools]#mkdir/application/nginx/html/ganglia/dwoo/cache [root@centos02tools]#chmod777/application/nginx/html/ganglia/dwoo/compiled [root@centos02tools]#chmod777/application/nginx/html/ganglia/dwoo/cache [root@centos02html]#chmod-R777/var/lib/ganglia/rrds 修改客户端配置文件(所有的客户端都需要做) [root@centos02tools]#vim/etc/ganglia/gmond.conf cluster{ name="mycluster"#这个名字要和服务器端定义的data_source后面的名字一样 owner="unspecified" latlong="unspecified" url="unspecified" } udp_send_channel{ #bind_hostname=yes#Highlyrecommended,soontobedefault. #Thisoptiontellsgmondtouseasourceaddress #thatresolvestothemachine'shostname.Without #this,themetricsmayappeartocomefromany #interfaceandtheDNSnamesassociatedwith #thoseIPswillbeusedtocreatetheRRDs. #mcast_join=239.2.11.71 host=172.16.80.117#这里我们采用单播方式,默认是组播 port=8649 #ttl=1 } udp_recv_channel{ #mcast_join=239.2.11.71 port=8649 #bind=239.2.11.71 retry_bind=true #SizeoftheUDPbuffer.Ifyouarehandlinglotsofmetricsyoureally #shouldbumpituptoe.g.10MBorevenhigher. #buffer=10485760 } 4、再次访问测试 这里是整个集群的一个总的汇总图,而不是单台服务器的图,下面我们打开单台服务器的图看看 再来看看对同一指标,每台服务器一起显示的图 5、扩展 Ganglia 监控功能的方法 默认安装完成的 Ganglia 仅向我们提供基础的系统监控信息,通过 Ganglia 插件可以实 现两种扩展 Ganglia 监控功能的方法。 1) 添加带内( in-band)插件,主要是通过 gmetric 命令来实现。 这是通常使用的一种方法,主要是通过 crontab 方法并调用 Ganglia 的 gmetric 命令来向 gmond 输入数据,进而实现统一监控。这种方法简单,对于少量的监控可以采用,但是对 于大规模自定义监控时,监控数据难以统一管理。 2) 添加一些其他来源的带外( out-of-band)插件,主要是通过 C 或者 Python 接口来 实现。 在 Ganglia3.1.x 版本以后,增加了 C 或 Python 接口,通过这个接口可以自定义数据收集 模块,并且可以将这些模块直接插入到 gmond 中以监控用户自定义的应用。 这里我们举例通过带外扩展的方式 来监控nginx的运行状态 配置ganglia客户端,收集nginx_status数据 [root@centos02nginx_status]#pwd /tools/gmond_python_modules-master/nginx_status [root@centos02nginx_status]#cpconf.d/nginx_status.pyconf/etc/ganglia/conf.d/ [root@centos02nginx_status]#cppython_modules/nginx_status.py/usr/lib64/ganglia/python_modules/ [root@centos02nginx_status]#cpgraph.d/nginx_*/application/nginx/html/ganglia/graph.d/ [root@centos02mysql]#cat/etc/ganglia/conf.d/nginx_status.pyconf # modules{ module{ name='nginx_status' language='python' paramstatus_url{ value='http://status.martin.org/' } paramnginx_bin{ value='/application/nginx/sbin/nginx' } paramrefresh_rate{ value='15' } } } collection_group{ collect_once=yes time_threshold=20 metric{ name='nginx_server_version' title="NginxVersion" } } collection_group{ collect_every=10 time_threshold=20 metric{ name="nginx_active_connections" title="TotalActiveConnections" value_threshold=1.0 } metric{ name="nginx_accepts" title="TotalConnectionsAccepted" value_threshold=1.0 } metric{ name="nginx_handled" title="TotalConnectionsHandled" value_threshold=1.0 } metric{ name="nginx_requests" title="TotalRequests" value_threshold=1.0 } metric{ name="nginx_reading" title="ConnectionsReading" value_threshold=1.0 } metric{ name="nginx_writing" title="ConnectionsWriting" value_threshold=1.0 } metric{ name="nginx_waiting" title="ConnectionsWaiting" value_threshold=1.0 } } 完成上面的所有步骤后,重启 Ganglia 客户端 gmond 服务,在客户端通过“ gmond–m” 命令可以查看支持的模板,最后就可以在 Ganglia web 界面查看 Nginx 的运行状态

资源下载

更多资源
Mario

Mario

马里奥是站在游戏界顶峰的超人气多面角色。马里奥靠吃蘑菇成长,特征是大鼻子、头戴帽子、身穿背带裤,还留着胡子。与他的双胞胎兄弟路易基一起,长年担任任天堂的招牌角色。

腾讯云软件源

腾讯云软件源

为解决软件依赖安装时官方源访问速度慢的问题,腾讯云为一些软件搭建了缓存服务。您可以通过使用腾讯云软件源站来提升依赖包的安装速度。为了方便用户自由搭建服务架构,目前腾讯云软件源站支持公网访问和内网访问。

Sublime Text

Sublime Text

Sublime Text具有漂亮的用户界面和强大的功能,例如代码缩略图,Python的插件,代码段等。还可自定义键绑定,菜单和工具栏。Sublime Text 的主要功能包括:拼写检查,书签,完整的 Python API , Goto 功能,即时项目切换,多选择,多窗口等等。Sublime Text 是一个跨平台的编辑器,同时支持Windows、Linux、Mac OS X等操作系统。

WebStorm

WebStorm

WebStorm 是jetbrains公司旗下一款JavaScript 开发工具。目前已经被广大中国JS开发者誉为“Web前端开发神器”、“最强大的HTML5编辑器”、“最智能的JavaScript IDE”等。与IntelliJ IDEA同源,继承了IntelliJ IDEA强大的JS部分的功能。


用户登录
用户注册