centos6.5下安装配置ELK及收集nginx日志
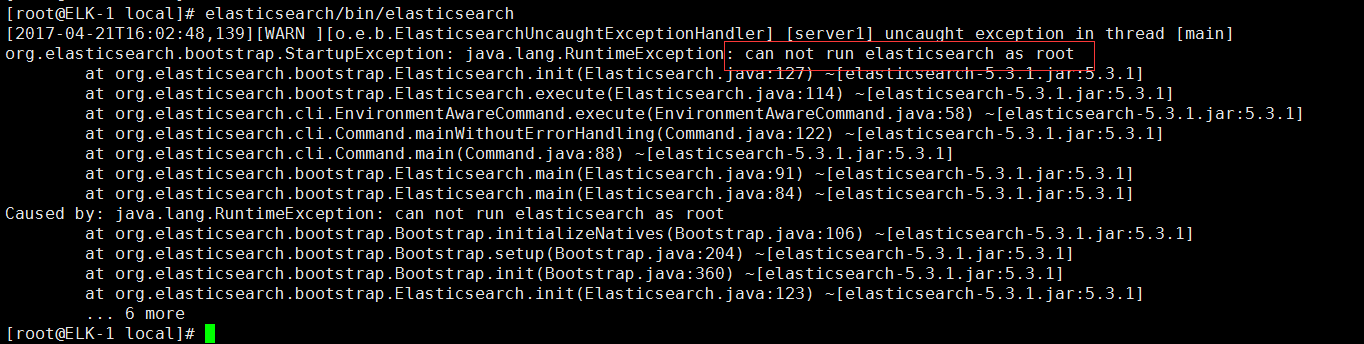
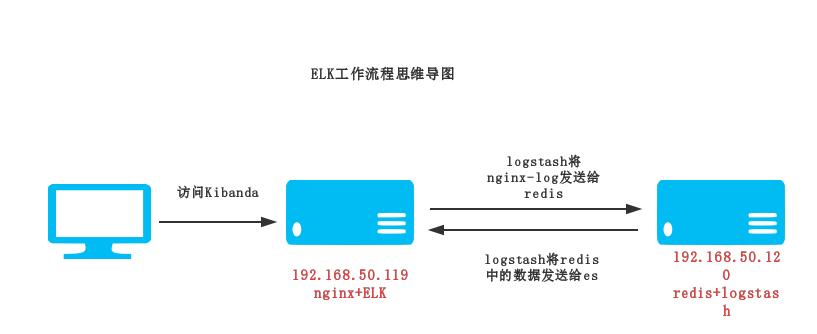
Elasticsearch 是个开源分布式搜索引擎,它的特点有:分布式,零配置,自动发现,索引自动分片,索引副本机制,restful风格接口,多数据源,自动搜索负载等。 Logstash 是一个完全开源的工具,他可以对你的日志进行收集、分析,并将其存储供以后使用(如,搜索) kibana 也是一个开源和免费的工具,他Kibana可以为 Logstash 和 ElasticSearch 提供的日志分析友好的 Web 界面,可以帮助您汇总、分析和搜索重要数据日志。 环境:192.168.50.119:ELK+Nginx 192.168.50.120:Redis+Logstash 架构图 部署流程: 192.168.50.119 ELK服务器 1.安装JDK Logstash的运行依赖于Java运行环境, Logstash 1.5以上版本不低于java 7推荐使用最新版本的Java,我这里使用了1.8版本 1 2 3 4 5 6 tar -zxfjdk-8u45-linux-x64. tar .gz-C /usr/local/ vim /etc/profile #设置环境变量 export JAVA_HOME= /usr/local/jdk1 .8.0_45 export PATH=$PATH:$JAVA_HOME /bin export CLASSPATH=.:$JAVA_HOME /lib/tools .jar:$JAVA_HOME /lib/dt .jar:$CLASSPATH source /etc/profile #使环境变量生效 验证是否安装成功 1 2 3 4 [root@localhost~] #java-version javaversion "1.8.0_45" Java(TM)SERuntimeEnvironment(build1.8.0_45-b14) JavaHotSpot(TM)64-BitServerVM(build25.45-b02,mixedmode) 2.安装Logstash(日志收集、分析,并将其存储供以后使用) 1 2 wgethttps: //download .elastic.co /logstash/logstash/logstash-2 .4.0. tar .gz tar –zxflogstash-2.4.0. tar .gz-C /usr/local/ 验证logstash是否安装成功 1 2 3 4 5 [root@localhost~] #/usr/local/logstash-2.4.0/bin/logstash-e'input{stdin{}}output{stdout{}}' Settings:Defaultpipelineworkers:1 Logstashstartupcompleted 等待输入:helloworld 2016-11-28T20:32:07.853Zlocalhost.localdomainhelloworld 我们可以看到,我们输入什么内容logstash按照某种格式输出,其中-e参数参数允许Logstash直接通过命令行接受设置。 这点尤其快速的帮助我们反复的测试配置是否正确而不用写配置文件。使用CTRL-C命令可以退出之前运行的Logstash。 3.部署nginx并收集日志 1 2 3 4 5 6 yum-y install nginx 设置nginx的log格式 vim /etc/nginx/nginx .conf log_formatmain '$remote_addr-$remote_user[$time_local]"$request"' '$status$body_bytes_sent"$http_referer"' '"$http_user_agent"$http_x_forwarded_for$request_length$msec$connection_requests$request_time' ; 启动nginx 1 servicenginxstart 1 2 3 4 5 6 7 8 9 10 11 12 13 14 15 16 17 18 19 mkdir /usr/local/logstash-2 .4.0 /conf/ #创建logstash配置目录 定义logstash配置文件,用来收集nginx日志 [root@localhostconf] #catlogstash_nginx.conf input{ file { path=>[ "/var/log/nginx/access.log" ] type => "nginx_log" } } output{ redis{ host=> "192.168.50.120" key=> 'logstash-redis' data_type=> 'list' } stdout{ codec=>rubydebug } } 4.安装部署redis 192.168.50.120 服务器 1 2 3 yum-y install redis vim /etc/redis .conf bind192.168.50.120 启动 1 serviceredisstart 5.启动Logstash 1 2 [root@localhostconf] #/usr/local/logstash-2.4.0/bin/logstash-f./logstash_nginx.conf--configtest#检查配置文件 ConfigurationOK 1 2 3 4 5 6 7 8 9 10 11 12 13 14 15 16 17 18 19 20 21 22 23 24 25 26 27 [root@localhostconf] #/usr/local/logstash-2.4.0/bin/logstashagent-f./logstash_nginx.conf#将日志信息输出到redis服务器 Settings:Defaultpipelineworkers:1 Logstashstartupcompleted { "message" => "192.168.50.114--[29/Nov/2016:00:58:43+0800]\"GET/HTTP/1.1\"3040\"-\"\"Mozilla/5.0(WindowsNT6.1;Win64;x64)AppleWebKit/537.36(KHTML,likeGecko)Chrome/54.0.2840.99Safari/537.36\"\"-\"" , "@version" => "1" , "@timestamp" => "2016-11-28T18:55:49.587Z" , "path" => "/var/log/nginx/access.log" , "host" => "localhost.localdomain" , "type" => "nginx_log" } { "message" => "192.168.50.114--[29/Nov/2016:00:58:43+0800]\"GET/nginx-logo.pngHTTP/1.1\"3040\"http://192.168.50.119/\"\"Mozilla/5.0(WindowsNT6.1;Win64;x64)AppleWebKit/537.36(KHTML,likeGecko)Chrome/54.0.2840.99Safari/537.36\"\"-\"" , "@version" => "1" , "@timestamp" => "2016-11-28T18:55:49.590Z" , "path" => "/var/log/nginx/access.log" , "host" => "localhost.localdomain" , "type" => "nginx_log" } { "message" => "192.168.50.114--[29/Nov/2016:00:58:43+0800]\"GET/poweredby.pngHTTP/1.1\"3040\"http://192.168.50.119/\"\"Mozilla/5.0(WindowsNT6.1;Win64;x64)AppleWebKit/537.36(KHTML,likeGecko)Chrome/54.0.2840.99Safari/537.36\"\"-\"" , "@version" => "1" , "@timestamp" => "2016-11-28T18:55:49.590Z" , "path" => "/var/log/nginx/access.log" , "host" => "localhost.localdomain" , "type" => "nginx_log" } 6.安装部署Elasticsearch 192.168.50.119 ELK服务器 创建安装用户 1 2 groupaddelk useradd es-gelk 1 2 3 4 tar -xfelasticsearch-2.2.0. tar .gz-C /usr/local/ vim /usr/local/elasticsearch-2 .2.0 /config/elasticsearch .yml network.host:192.168.50.119 #端口绑定ip地址 http.port:9200 启动 这里遇到一个坑:es用户默认是不能用root用户启动的。所以要切到普通用户启动 1 2 3 chown -Res.elk /usr/local/elasticsearch-2 .2.0 su -es nohup /usr/local/elasticsearch-2 .2.0 /bin/elasticsearch > /usr/local/elasticsearch-2 .2.0 /nohub & 1 2 [root@localhostELK] #netstat-tunpl|grep9200 tcp00::ffff:192.168.50.119:9200:::*LISTEN2183 /java 1 2 3 4 5 6 7 8 9 10 11 12 13 [root@localhostELK] #curlhttp://192.168.50.119:9200#查看状态 { "name" : "BloodBrothers" , "cluster_name" : "elasticsearch" , "version" :{ "number" : "2.2.0" , "build_hash" : "8ff36d139e16f8720f2947ef62c8167a888992fe" , "build_timestamp" : "2016-01-27T13:32:39Z" , "build_snapshot" : false , "lucene_version" : "5.4.1" }, "tagline" : "YouKnow,forSearch" } 安装kopf和head插件 1 2 3 4 5 6 7 8 [root@localhostconf] #cd/usr/local/elasticsearch-2.2.0/bin/ [root@localhostbin] #./plugininstalllmenezes/elasticsearch-kopf ->Installinglmenezes /elasticsearch-kopf ... Tryinghttps: //github .com /lmenezes/elasticsearch-kopf/archive/master .zip... Downloading............................................................DONE Verifyinghttps: //github .com /lmenezes/elasticsearch-kopf/archive/master .zipchecksums if available... NOTE:Unabletoverifychecksum for downloadedplugin(unableto find .sha1or.md5 file toverify) Installedkopfinto /usr/local/elasticsearch-2 .2.0 /plugins/kopf 1 2 3 4 5 6 [root@localhostbin] #./plugininstallmobz/elasticsearch-head ->Installingmobz /elasticsearch-head ... Tryinghttps: //github .com /mobz/elasticsearch-head/archive/master .zip... Downloading.........................................................DONE NOTE:Unabletoverifychecksum for downloadedplugin(unableto find .sha1or.md5 file toverify) Installed head into /usr/local/elasticsearch-2 .2.0 /plugins/head 7.安装kibana 192.168.50.119 ELK服务器 安装 1 2 [root@localhostELK] #tar-xfkibana-4.4.0-linux-x64.tar.gz-C/usr/local/ [root@localhostELK] #cd/usr/local/kibana-4.4.0-linux-x64/ 配置 1 2 3 4 [root@localhostkibana-4.4.0-linux-x64] #vimconfig/kibana.yml elasticsearch.url: "http://192.168.50.119:9200" server.port:5601 server.host: "0.0.0.0" 启动 1 [root@localhostkibana-4.4.0-linux-x64] #nohup/usr/local/kibana-4.4.0-linux-x64/bin/kibana>/usr/local/kibana-4.4.0-linux-x64/nohub.out& 1 2 [root@localhostELK] #netstat-tunpl|grep5601 tcp000.0.0.0:56010.0.0.0:* 浏览器访问http://192.168.50.119:5601/ 8.安装logstash-server服务器 192.168.50.120 服务器 安装jdk和logstash 1 2 3 4 5 6 tar -zxfjdk-8u45-linux-x64. tar .gz-C /usr/local/ vim /etc/profile #设置环境变量 export JAVA_HOME= /usr/local/jdk1 .8.0_45 export PATH=$PATH:$JAVA_HOME /bin export CLASSPATH=.:$JAVA_HOME /lib/tools .jar:$JAVA_HOME /lib/dt .jar:$CLASSPATH source /etc/profile #使环境变量生效 1 2 tar –zxflogstash-2.4.0. tar .gz-C /usr/local/ mkdir /usr/local/logstash-2 .4.0 /conf 将redis 中的数据发送到elasticsearch中 1 2 3 4 5 6 7 8 9 10 11 12 13 14 15 16 [root@localhostconf] #catlogstash_server.conf input{ redis{ port=> "6379" host=> "192.168.50.120" data_type=> "list" key=> "logstash-redis" type => "redis-input" } } output{ elasticsearch{ hosts=> "192.168.50.119" index=> "logstash-%{+YYYY.MM.dd}" } } 9.在Kibanda上创建nginx日志监控视图 es常规操作 1 2 3 4 5 6 7 8 9 10 11 12 13 14 es健康状态 [root@localhost~] #curlhttp://192.168.50.119:9200/_cat/health?v epochtimestampclusterstatusnode.totalnode.datashardsprireloinitunassignpending_tasksmax_task_wait_timeactive_shards_percent 148034531523:01:55elasticsearchyellow11660060-50.0% health的状态包括:green,yellow,red. 列出节点 [root@localhost~] #curlhttp://192.168.50.119:9200/_cat/nodes?v hostipheap.percent ram .percentloadnode.rolemastername 192.168.50.119192.168.50.1198990.00d*BloodBrothers 列出索引 [root@localhost~] #curlhttp://192.168.50.119:9200/_cat/indices?v healthstatusindexprirepdocs.countdocs.deletedstore.sizepri.store.size yellow open .kibana11205.6kb5.6kb yellow open logstash-2016.11.2851104.9kb4.9kb 本文转自 shouhou2581314 51CTO博客,原文链接:http://blog.51cto.com/thedream/1878971,如需转载请自行联系原作者