首页 文章 精选 留言 我的

精选列表

搜索[elk],共1229篇文章
优秀的个人博客,低调大师

ELK实战之使用filebeat代替logstash收集日志

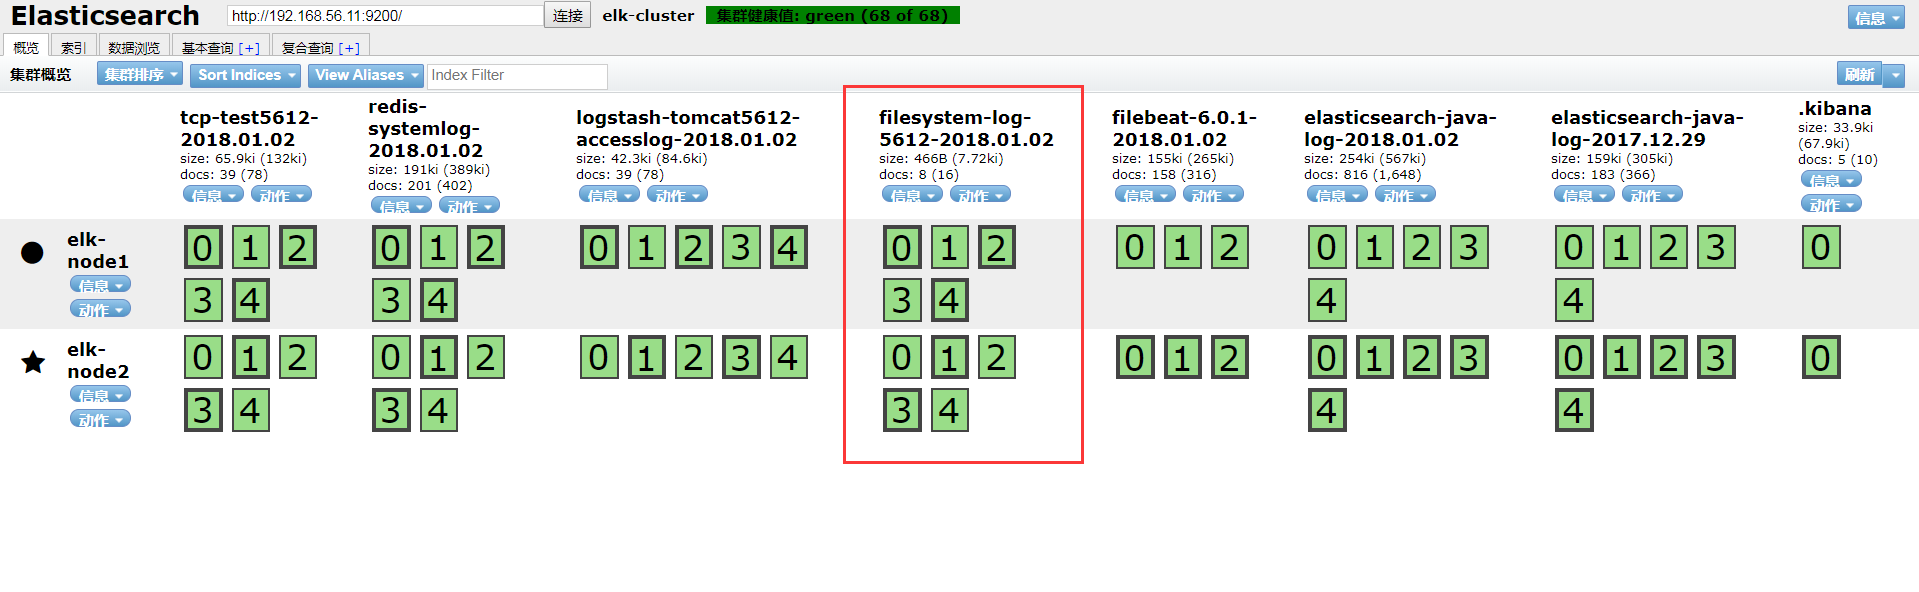
一、Filebeat介绍 Filebeat是轻量级单用途的日志收集工具,用于在没有安装java的服务器上专门收集日志,可以将日志转发到logstash、elasticsearch或redis等场景中进行下一步处理。 官方文档:https://www.elastic.co/guide/en/beats/filebeat/6.0/index.html 二、Filebeat安装和配置 1、filebeat安装 #RPM安装 [root@linux-node2 ~]# curl -L -O https://artifacts.elastic.co/downloads/beats/filebeat/filebeat-6.0.1-x86_64.rpm [root@linux-node2 ~]# rpm -vi filebeat-6.0.1-x86_64.rpm #docker安装 [root@linux-node2 ~]# docker pull docker.elastic.co/beats/filebeat:6.0.1 2、filebeat配置输出到文件测试 [root@linux-node2 ~]# grep -v "#" /etc/filebeat/filebeat.yml |grep -v "^$" filebeat.prospectors: - type: log enabled: true paths: - /var/log/*.log - /var/log/messages #配置收集的日志路径 exclude_lines: ['^DBG',"^$"] #排除以DBG开头和空行 document_type: filesystem-log-5612 #设置类型 filebeat.config.modules: path: ${path.config}/modules.d/*.yml reload.enabled: false setup.template.settings: index.number_of_shards: 3 setup.kibana: output.file: #输出到文件 path: "/tmp" filename: "filebeat.txt" [root@linux-node2 ~]# systemctl restart filebeat [root@linux-node2 ~]# echo "666666666666666" >> /var/log/messages [root@linux-node2 conf.d]# tailf /tmp/filebeat.txt {"@timestamp":"2018-01-02T03:55:54.680Z","@metadata":{"beat":"filebeat","type":"doc","version":"6.0.1"},"message":"666666666666666","source":"/var/log/messages","offset":3164930,"prospector":{"type":"log"},"beat":{"name":"linux-node2","hostname":"linux-node2","version":"6.0.1"}} 三、配置filebeat输出到redis [root@linux-node2 ~]# vim /etc/filebeat/filebeat.yml #修改output output.redis: hosts: "192.168.56.12" db: "2" port: "6379" password: "123456" key: "filesystem-log-5612" [root@linux-node2 ~]# systemctl restart filebeat [root@linux-node2 ~]# echo "123456" >> /var/log/messages #查看redis中是否有数据 [root@linux-node2 ~]# redis-cli -h 192.168.56.12 -a 123456 192.168.56.12:6379> select 2 OK 192.168.56.12:6379[2]> KEYS * 1) "filesystem-log-5612" 192.168.56.12:6379[2]> llen filesystem-log-5612 (integer) 3 192.168.56.12:6379[2]> llen filesystem-log-5612 (integer) 3 192.168.56.12:6379[2]> llen filesystem-log-5612 (integer) 3 192.168.56.12:6379[2]> llen filesystem-log-5612 (integer) 3 192.168.56.12:6379[2]> llen filesystem-log-5612 (integer) 4 四、配置linux-node1节点的logstash取redis中的数据 #配置logstash [root@linux-node1 conf.d]# vim redis-logstash.conf input { redis { data_type => "list" host => "192.168.56.12" db => "2" port => "6379" password => "123456" key => "filesystem-log-5612" } } output { elasticsearch { hosts => ["192.168.56.11:9200"] index => "filesystem-log-5612-%{+YYYY.MM.dd}" } } #检测语法 [root@linux-node1 conf.d]# /usr/share/logstash/bin/logstash -f /etc/logstash/conf.d/redis-logstash.conf -t OpenJDK 64-Bit Server VM warning: If the number of processors is expected to increase from one, then you should configure the number of parallel GC threads appropriately using -XX:ParallelGCThreads=N WARNING: Could not find logstash.yml which is typically located in $LS_HOME/config or /etc/logstash. You can specify the path using --path.settings. Continuing using the defaults Could not find log4j2 configuration at path /usr/share/logstash/config/log4j2.properties. Using default config which logs errors to the console Configuration OK #重启logstash [root@linux-node1 conf.d]# systemctl restart logstash #写入messages日志 [root@linux-node1 conf.d]# echo "helloworld" >> /var/log/messages [root@linux-node1 conf.d]# echo "helloworld" >> /var/log/messages [root@linux-node1 conf.d]# echo "helloworld" >> /var/log/messages #查看redis数据 [root@linux-node2 ~]# redis-cli -h 192.168.56.12 -a 123456 192.168.56.12:6379> select 2 OK 192.168.56.12:6379[2]> KEYS * 1) "filesystem-log-5612" 192.168.56.12:6379[2]> llen filesystem-log-5612 (integer) 3 192.168.56.12:6379[2]> llen filesystem-log-5612 (integer) 3 192.168.56.12:6379[2]> llen filesystem-log-5612 (integer) 3 192.168.56.12:6379[2]> llen filesystem-log-5612 (integer) 3 192.168.56.12:6379[2]> llen filesystem-log-5612 (integer) 4 192.168.56.12:6379[2]> llen filesystem-log-5612 (integer) 44 192.168.56.12:6379[2]> llen filesystem-log-5612 (integer) 0 五、head插件查看以及kibana添加索引 六、监控redis长度脚本 为了监控Redis的队列长度,可以写一个监控脚本对redis进行监控,并增加zabbix报警 [root@linux-node2 ~]# vim redis-test.py #!/usr/bin/env python import redis def redis_conn(): pool=redis.ConnectionPool(host="192.168.56.12",port=6379,db=2,password=123456) conn = redis.Redis(connection_pool=pool) data = conn.llen('filesystem-log-5612') print(data) redis_conn() [root@linux-node2 ~]# python redis-test.py #当前redis队列长度为0 0 版权声明:原创作品,谢绝转载。否则将追究法律责任 本文转自 IT_外卖小哥 51CTO博客,原文链接:http://blog.51cto.com/jinlong/2056598
优秀的个人博客,低调大师

ELK实战之Kibana部署及message日志收集

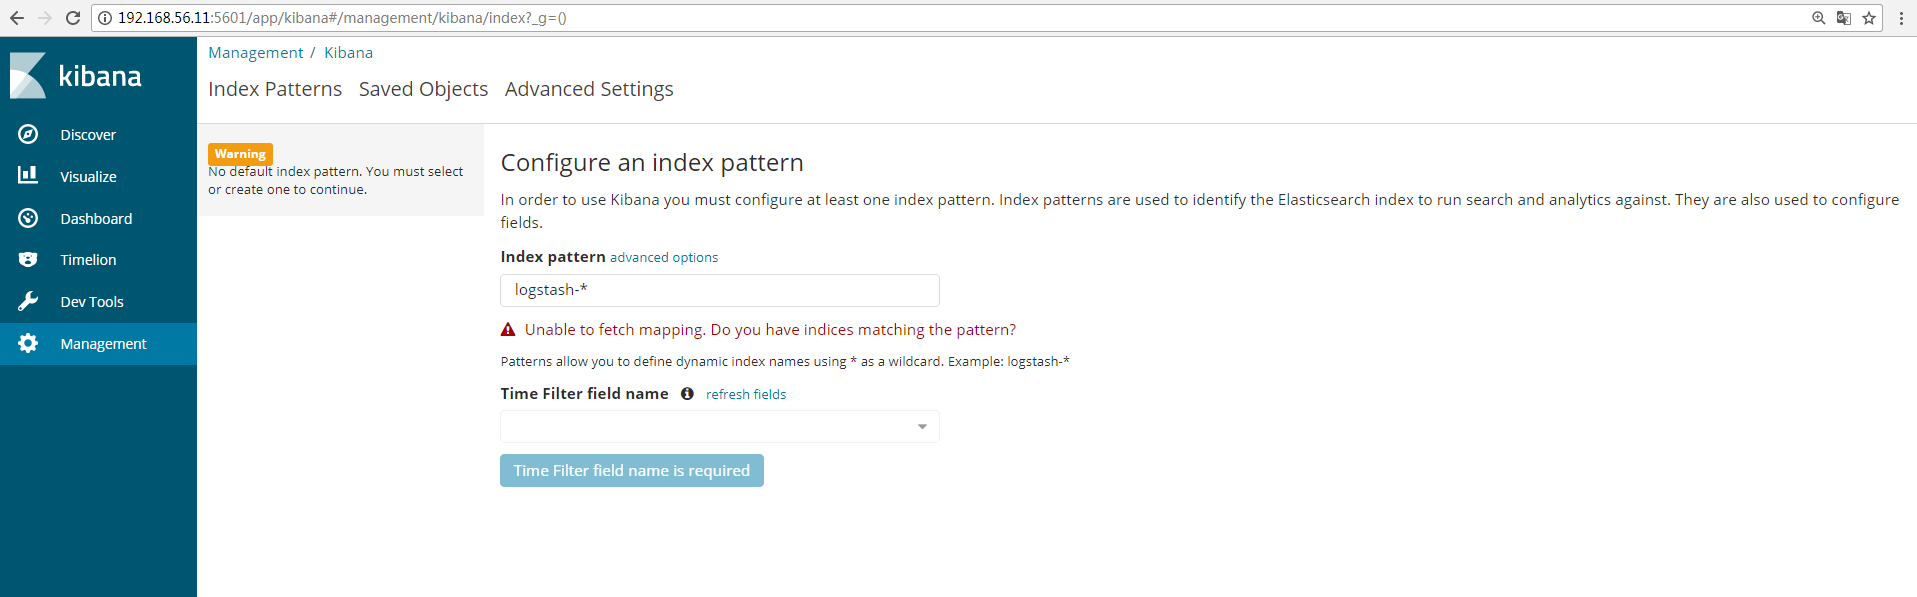
一、Kibana安装 Kibana 是为 Elasticsearch 设计的开源分析和可视化平台。你可以使用 Kibana 来搜索,查看存储在 Elasticsearch 索引中的数据并与之交互。你可以很容易实现高级的数据分析和可视化,以图表的形式展现出来。 kiabana下载地址:https://artifacts.elastic.co/downloads/kibana/kibana-6.0.0-x86_64.rpm [root@linux-node1 ~]# wget https://artifacts.elastic.co/downloads/kibana/kibana-6.0.0-x86_64.rpm [root@linux-node1 ~]# yum install -y kibana-6.0.0-x86_64.rpm [root@linux-node1 ~]# vim /etc/kibana/kibana.yml [root@linux-node1 ~]# grep "^[a-Z]" /etc/kibana/kibana.yml server.port: 5601 #监听端口 server.host: "192.168.56.11" #监听IP地址,建议内网ip elasticsearch.url: "http://192.168.56.11:9200" #elasticsearch连接kibana的URL,也可以填写192.168.56.12,因为它们是一个集群 [root@linux-node1 ~]# systemctl enable kibana Created symlink from /etc/systemd/system/multi-user.target.wants/kibana.service to /etc/systemd/system/kibana.service. [root@linux-node1 ~]# systemctl start kibana 监听端口为:5601 [root@linux-node1 ~]# ss -tnl State Recv-Q Send-Q Local Address:Port Peer Address:Port LISTEN 0 128 *:9100 *:* LISTEN 0 128 *:22 *:* LISTEN 0 100 127.0.0.1:25 *:* LISTEN 0 128 192.168.56.11:5601 *:* LISTEN 0 128 ::ffff:192.168.56.11:9200 :::* LISTEN 0 128 ::ffff:192.168.56.11:9300 :::* LISTEN 0 128 :::22 :::* LISTEN 0 100 ::1:25 :::* LISTEN 0 80 :::3306 :::* 浏览器访问192.168.56.11:5601,如图: 可以通过http://192.168.56.11:5601/status 来查看看是否正常,如果不正常,是无法进入到上图界面 二、通过配置logstash文件收集message日志 1、Kibana展示上一节的日志 在Kibana上展示上一节收集的日志信息,添加索引,如图: 点击“discover”查看收集的信息,如图: 2、使用logstash配置文件收集messages日志 编辑logstash的配置文件: [root@linux-node1 ~]# vim /etc/logstash/conf.d/system.conf input { file { path => "/var/log/messages" #日志路径 type => "systemlog" #类型 start_position => "beginning" #logstash 从什么位置开始读取文件数据,默认是结束位置,也就是说 logstash 进程会以类似 tail -F 的形式运行。如果你是要导入原有数据,把这个设定改成"beginning",logstash 进程就从头开始读取,类似 less +F 的形式运行。 stat_interval => "2" #logstash 每隔多久检查一次被监听文件状态(是否有更新) ,默认是 1 秒。 } } output { elasticsearch { hosts => ["192.168.56.11:9200"] #指定hosts index => "logstash-systemlog-%{+YYYY.MM.dd}" #索引名称 } } [root@linux-node1 ~]# /usr/share/logstash/bin/logstash -f /etc/logstash/conf.d/system.conf -t #检测配置文件是否有语法错误 OpenJDK 64-Bit Server VM warning: If the number of processors is expected to increase from one, then you should configure the number of parallel GC threads appropriately using -XX:ParallelGCThreads=N WARNING: Could not find logstash.yml which is typically located in $LS_HOME/config or /etc/logstash. You can specify the path using --path.settings. Continuing using the defaults Could not find log4j2 configuration at path /usr/share/logstash/config/log4j2.properties. Using default config which logs errors to the console Configuration OK [root@linux-node1 ~]# ll /var/log/messages -rw-------. 1 root root 791209 12月 27 11:43 /var/log/messages #这里可以看到该日志文件是600权限,而elasticsearch是运行在elasticsearch用户下,这样elasticsearch是无法收集日志的。所以这里需要更改日志的权限,否则会报权限拒绝的错误。在日志中查看/var/log/logstash/logstash-plain.log 是否有错误。 [root@linux-node1 ~]# chmod 644 /var/log/messages [root@linux-node1 ~]# systemctl restart logstash 在管理界面查看是否有相应的索引(logstash-systemlog-2017.12.27),如图: 添加到Kibana中展示,创建索引: 查看日志 三、使用一个配置文件收集多个日志 修改logstash的配置文件,这里增加收集数据库mariadb的日志: [root@linux-node1 ~]# vim /etc/logstash/conf.d/system.conf input { file { path => "/var/log/messages" type => "systemlog" start_position => "beginning" stat_interval => "2" } file { path => "/var/log/mariadb/mariadb.log" type => "mariadblog" start_position => "beginning" stat_interval => "2" } } output { if [type] == "systemlog" { #使用if来判断类型,并输出到elasticsearch和file,展示一个out可以作多样输出 elasticsearch { hosts => ["192.168.56.11:9200"] index => "logstash-systemlog-%{+YYYY.MM.dd}" } file { path => "/tmp/logstash-systemlog-%{+YYYY.MM.dd}" }} if [type] == "mariadblog" { elasticsearch { hosts => ["192.168.56.11:9200"] index => "logstash-mariadblog-%{+YYYY.MM.dd}" } file { path => "/tmp/logstash-mariadblog-%{+YYYY.MM.dd}" }} } 配置文件检测语法是否正常: [root@linux-node1 ~]# /usr/share/logstash/bin/logstash -f /etc/logstash/conf.d/system.conf -t OpenJDK 64-Bit Server VM warning: If the number of processors is expected to increase from one, then you should configure the number of parallel GC threads appropriately using -XX:ParallelGCThreads=N WARNING: Could not find logstash.yml which is typically located in $LS_HOME/config or /etc/logstash. You can specify the path using --path.settings. Continuing using the defaults Could not find log4j2 configuration at path /usr/share/logstash/config/log4j2.properties. Using default config which logs errors to the console Configuration OK 重启logstash: [root@linux-node1 ~]# systemctl restart logstash 修改mariadb的日志权限: [root@linux-node1 ~]# ll /var/log/mariadb/ -d drwxr-x--- 2 mysql mysql 24 12月 4 17:43 /var/log/mariadb/ [root@linux-node1 ~]# chmod 755 /var/log/mariadb/ [root@linux-node1 ~]# ll /var/log/mariadb/mariadb.log -rw-r----- 1 mysql mysql 114993 12月 27 14:23 /var/log/mariadb/mariadb.log [root@linux-node1 ~]# chmod 644 /var/log/mariadb/mariadb.log 通过head插件查看: 查看是否在/tmp下收集到了日志数据 [root@linux-node1 ~]# ll /tmp/logstash-* -rw-r--r-- 1 logstash logstash 288449 12月 27 14:27 /tmp/logstash-mariadblog-2017.12.27 -rw-r--r-- 1 logstash logstash 53385 12月 27 14:28 /tmp/logstash-systemlog-2017.12.27 Kibana创建索引: 版权声明:原创作品,谢绝转载。否则将追究法律责任 本文转自 IT_外卖小哥 51CTO博客,原文链接:http://blog.51cto.com/jinlong/2055042

资源下载

更多资源
Mario

Mario

马里奥是站在游戏界顶峰的超人气多面角色。马里奥靠吃蘑菇成长,特征是大鼻子、头戴帽子、身穿背带裤,还留着胡子。与他的双胞胎兄弟路易基一起,长年担任任天堂的招牌角色。

腾讯云软件源

腾讯云软件源

为解决软件依赖安装时官方源访问速度慢的问题,腾讯云为一些软件搭建了缓存服务。您可以通过使用腾讯云软件源站来提升依赖包的安装速度。为了方便用户自由搭建服务架构,目前腾讯云软件源站支持公网访问和内网访问。

Nacos

Nacos

Nacos /nɑ:kəʊs/ 是 Dynamic Naming and Configuration Service 的首字母简称,一个易于构建 AI Agent 应用的动态服务发现、配置管理和AI智能体管理平台。Nacos 致力于帮助您发现、配置和管理微服务及AI智能体应用。Nacos 提供了一组简单易用的特性集,帮助您快速实现动态服务发现、服务配置、服务元数据、流量管理。Nacos 帮助您更敏捷和容易地构建、交付和管理微服务平台。

Sublime Text

Sublime Text

Sublime Text具有漂亮的用户界面和强大的功能,例如代码缩略图,Python的插件,代码段等。还可自定义键绑定,菜单和工具栏。Sublime Text 的主要功能包括:拼写检查,书签,完整的 Python API , Goto 功能,即时项目切换,多选择,多窗口等等。Sublime Text 是一个跨平台的编辑器,同时支持Windows、Linux、Mac OS X等操作系统。

用户登录
用户注册