Android一个包含表格的图标库
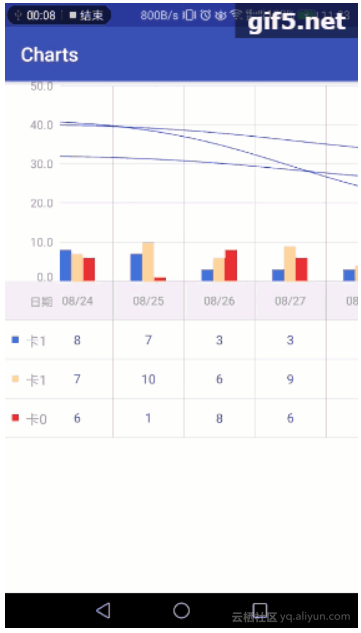
之前有写过一个图表lib,但是开发的速度,大多很难跟上产品需求变化的脚步,所以修改了下原先的图表库,支持图表下面能整合table显示对应的类目,用曲线替换了折线,支持多曲线的显示,增加了显示的动画,,增加了一些可定制的属性,支持水平柱状图和叠加柱状图,以及多曲线图和饼状图的显示 效果图 各种图表的使用方式 1.饼状图 这个和原先的使用一样,只不过增加了一个动画,可以参看之前的文章,饼状图使用。 2.水平多柱状图 2.1 xml布局 <wellijohn.org.varchart.hor_bar_with_line_chart.ChartLine android:id="@+id/chartline" android:layout_width="wrap_content" android:layout_height="wrap_content" android:background="@color/white" app:default_x_visible_num="4.2"//一个屏幕中显示多少列 app:y_interval="40dp"//Y轴的间距 app:y_num_text_max_width="56dp"//y轴左边的文字的宽度 /> 还有y_visible_num:y轴需要显示几列 2.2 数据设置 public class HorBarActivity extends AppCompatActivity {//显示的坐标点private ChartLine mChartline;//多条折线的坐标点private List<List<DotVo>> mMulListDisDots;//x轴的点private String[] mXdots = new String[]{"08/18" , "08/19","08/20", "08/21", "08/22", "08/23", "08/24","08/25", "08/26", "08/27", "08/28", "08/29", "09/01", "09/02", "09/23", };private double mMax = 44;private Random rand = new Random();private List<CategoryVo> mCategoryList; @Override protected void onCreate(@Nullable Bundle savedInstanceState) { super.onCreate(savedInstanceState); setContentView(R.layout.activity_hor_bar); initView(); initMulTestData(); initCategoryList();try { mChartline.setYAxisMaxValue(mMax).setXdots(mXdots).setAnimationOpen(true).setListDisDots(mMulListDisDots). setCategoryList(mCategoryList).reDraw(); } catch (YCoordinateException e) { Log.d("MainActivity", "onCreate: "); e.printStackTrace(); } }/** * 柱状图的数据,是一个list,一个CategoryVo,就是一列中增加一个柱状 * CategoryVo:{ * 卡券类目的名称 * private String categoryName; * 每个卡券类目的值 * private List<String> categoryValueList; * } */private void initCategoryList() { mCategoryList = new ArrayList<>(); mCategoryList.add(new CategoryVo()); mCategoryList.add(new CategoryVo()); mCategoryList.add(new CategoryVo()); }/** * 初始化曲线图,private List<List<DotVo>> mMulListDisDots; * List<DotVo>>就是一条曲线图, */private void initMulTestData() { mMulListDisDots = new ArrayList<>();for (int i = 0; i < 3; i++) { ArrayList<DotVo> temp = new ArrayList(); DotVo tempDotVo = new DotVo("08/18", rand.nextInt((int) mMax)); temp.add(tempDotVo); DotVo tempDotVo1 = new DotVo("08/19", rand.nextInt((int) mMax)); temp.add(tempDotVo1); DotVo tempDotVo2 = new DotVo("08/20", rand.nextInt((int) mMax)); temp.add(tempDotVo2); DotVo tempDotVo3 = new DotVo("08/21", rand.nextInt((int) mMax)); temp.add(tempDotVo3); DotVo tempDotVo4 = new DotVo("08/22", rand.nextInt((int) mMax)); temp.add(tempDotVo4); DotVo tempDotVo5 = new DotVo("08/23", rand.nextInt((int) mMax)); temp.add(tempDotVo5); DotVo tempDotVo6 = new DotVo("09/02", rand.nextInt((int) mMax)); temp.add(tempDotVo6); mMulListDisDots.add(temp); } }private void initView() { mChartline = findViewById(R.id.chartline); } } 3.叠加柱状图 3.1 xml布局 <wellijohn.org.varchart.overlay_bar_with_line_chart.OverLayBarChartLineandroid:id="@+id/overlay_chart_line"android:layout_width="wrap_content"android:layout_height="wrap_content"android:background="@color/white"android:visibility="visible"app:overlay_default_x_visible_num="4.2"app:overlay_y_interval="40dp"app:overlay_y_num_text_max_width="56dp" /> 3.2 数据设置,如2.2一样 实现的几个关键点 1 宽度需要重写,onMeasure,因为的控件的宽度是大于屏幕的宽度的,宽度是根据显示的x轴的点和间距,以及y轴坐标的文字的所占的宽度的距离所组成。 int widthParentMeasureMode = MeasureSpec.getMode(widthMeasureSpec);int widthParentMeasureSize = MeasureSpec.getSize(widthMeasureSpec);int heightParentMeasureMode = MeasureSpec.getMode(heightMeasureSpec);int heightParentMeasureSize = MeasureSpec.getSize(heightMeasureSpec);int resultWidthSize = 0;int resultHeightSize = 0;int resultWidthMode = MeasureSpec.EXACTLY;//用来对childView进行计算的int resultHeightMode = MeasureSpec.EXACTLY;int paddingWidth = getPaddingLeft() + getPaddingRight();int paddingHeight = getPaddingTop() + getPaddingBottom(); ViewGroup.LayoutParams thisLp = getLayoutParams();switch (widthParentMeasureMode) {//父类不加限制给子类case MeasureSpec.UNSPECIFIED://这个代表在布局写死了宽度if (thisLp.width > 0) { resultWidthSize = thisLp.width; resultWidthMode = MeasureSpec.EXACTLY; } else { resultWidthSize = (int) (getYMaxTextWidth() + mXinterval * mXdots.length); resultWidthMode = MeasureSpec.UNSPECIFIED; }break;case MeasureSpec.AT_MOST://这个代表在布局写死了宽度if (thisLp.width > 0) { resultWidthSize = thisLp.width; resultWidthMode = MeasureSpec.EXACTLY; } else if (thisLp.width == ViewGroup.LayoutParams.MATCH_PARENT) { resultWidthSize = Math.max(0, widthParentMeasureSize - paddingWidth); resultWidthMode = MeasureSpec.AT_MOST; } else if (thisLp.width == ViewGroup.LayoutParams.WRAP_CONTENT) { resultWidthSize = (int) (getYMaxTextWidth() + mXinterval * mXdots.length); resultWidthMode = MeasureSpec.AT_MOST; }break;case MeasureSpec.EXACTLY://这个代表在布局写死了宽度if (thisLp.width > 0) { resultWidthSize = Math.min(widthParentMeasureSize, thisLp.width); resultWidthMode = MeasureSpec.EXACTLY; } else if (thisLp.width == ViewGroup.LayoutParams.MATCH_PARENT) { resultWidthSize = widthParentMeasureSize; resultWidthMode = MeasureSpec.EXACTLY; } else if (thisLp.width == ViewGroup.LayoutParams.WRAP_CONTENT) { resultWidthSize = (int) (getYMaxTextWidth() + mXinterval * mXdots.length); resultWidthMode = MeasureSpec.AT_MOST; }break; } setMeasuredDimension(MeasureSpec.makeMeasureSpec(resultWidthSize, resultWidthMode), MeasureSpec.makeMeasureSpec(resultHeightSize, resultHeightMode)); 2 规划固定的区域,在超出区域的部分不可见,这个在之前用的bitmap来实现,总感觉别扭,后面读官方的源码的时候,了解了canvas的clipRect方法,我们在绘制这块的时候,onDraw方法中调用 int clipRestoreCount = canvas.save(); canvas.clipRect(mContentRect);//绘制之前调用 doDraw();//进行想要的绘制 canvas.restoreToCount(clipRestoreCount);//绘制完成调用restoreToCount恢复到绘制这块之前的状态 3 动画我们基本都可以用ValueAnimator来实现,比如说饼状图:他的一个绘制是0-360的角度的转变,我们就可以 private void startPathAnim(long duration) { ValueAnimator valueAnimator = ValueAnimator.ofFloat(0, 360); valueAnimator.setDuration(duration); valueAnimator.addUpdateListener(new ValueAnimator.AnimatorUpdateListener() {@Overridepublic void onAnimationUpdate(ValueAnimator animation) { mDrawAngle = (float) animation.getAnimatedValue(); ViewCompat.postInvalidateOnAnimation(CirclePercentChart.this); } }); valueAnimator.start(); } 然后通过mDrawAngle来控制每次绘制的角度,这样就可以有从0-360度绘制的感觉,那个柱状图的动画也是一样的,以不变应万变。 4 贝塞尔曲线绘制的算法 if (i == 0) {// 第一条为二阶贝塞尔 path.moveTo(mDots[0], mDots[1] + (mLastHorLineY - mDots[1]) * mPhaseY);// 起点 } else {float cpx = preX + (mDots[0] - preX) / 2.0f; path.cubicTo(cpx, preY + (mLastHorLineY - preY) * mPhaseY, cpx, mDots[1] + (mLastHorLineY - mDots[1]) * mPhaseY, mDots[0], mDots[1] + (mLastHorLineY - mDots[1]) * mPhaseY);} 在绘制贝塞尔曲线,我仔细去查过这些控制点的计算规则,有根据三点,来计算出两个控制点,但是这样绘制出来在三个点内部曲线是很平滑的,但是在接下来的第四个点的衔接的时候,感觉不是很好,所以我还是用了上面的计算方法来计算控制点,算法我贴出来,参数分别是1,2,3的x和y坐标和弯曲系数 public static ControlPonits getControlPoints(double x0, double y0, double x1, double y1, double x2, double y2, double paramCoefficient) {double d01 = Math.sqrt(Math.pow(x1 - x0, 2) + Math.pow(y1 - y0, 2));double d12 = Math.sqrt(Math.pow(x2 - x1, 2) + Math.pow(y2 - y1, 2));double fa = paramCoefficient * d01 / (d01 + d12); // scaling factor for triangle Tadouble fb = paramCoefficient * d12 / (d01 + d12); // ditto for Tb, simplifies to fb=t-fadouble p1x = x1 - fa * (x2 - x0); // x2-x0 is the width of triangle Tdouble p1y = y1 - fa * (y2 - y0); // y2-y0 is the height of Tdouble p2x = x1 + fb * (x2 - x0);double p2y = y1 + fb * (y2 - y0); ControlPonits tempControlPoints = new ControlPonits(); tempControlPoints.beforeControlPointX = (float) p1x; tempControlPoints.beforeControlPointY = (float) p1y; tempControlPoints.afterControlPointX = (float) p2x; tempControlPoints.afterControlPointY = (float) p2y;return tempControlPoints; } library引入方式 step 1. Add it in your root build.gradle at the end of repositories: allprojects { repositories { ... maven { url 'https://jitpack.io' } } } Step 2. Add the dependency dependencies { compile 'com.github.WelliJohn:charts:1.0.0' } 原文发布时间为:2018-09-26 本文作者:WelliJohn 本文来自云栖社区合作伙伴“ 安卓巴士Android开发者门户”,了解相关信息可以关注“ 安卓巴士Android开发者门户”。