遇到的问题
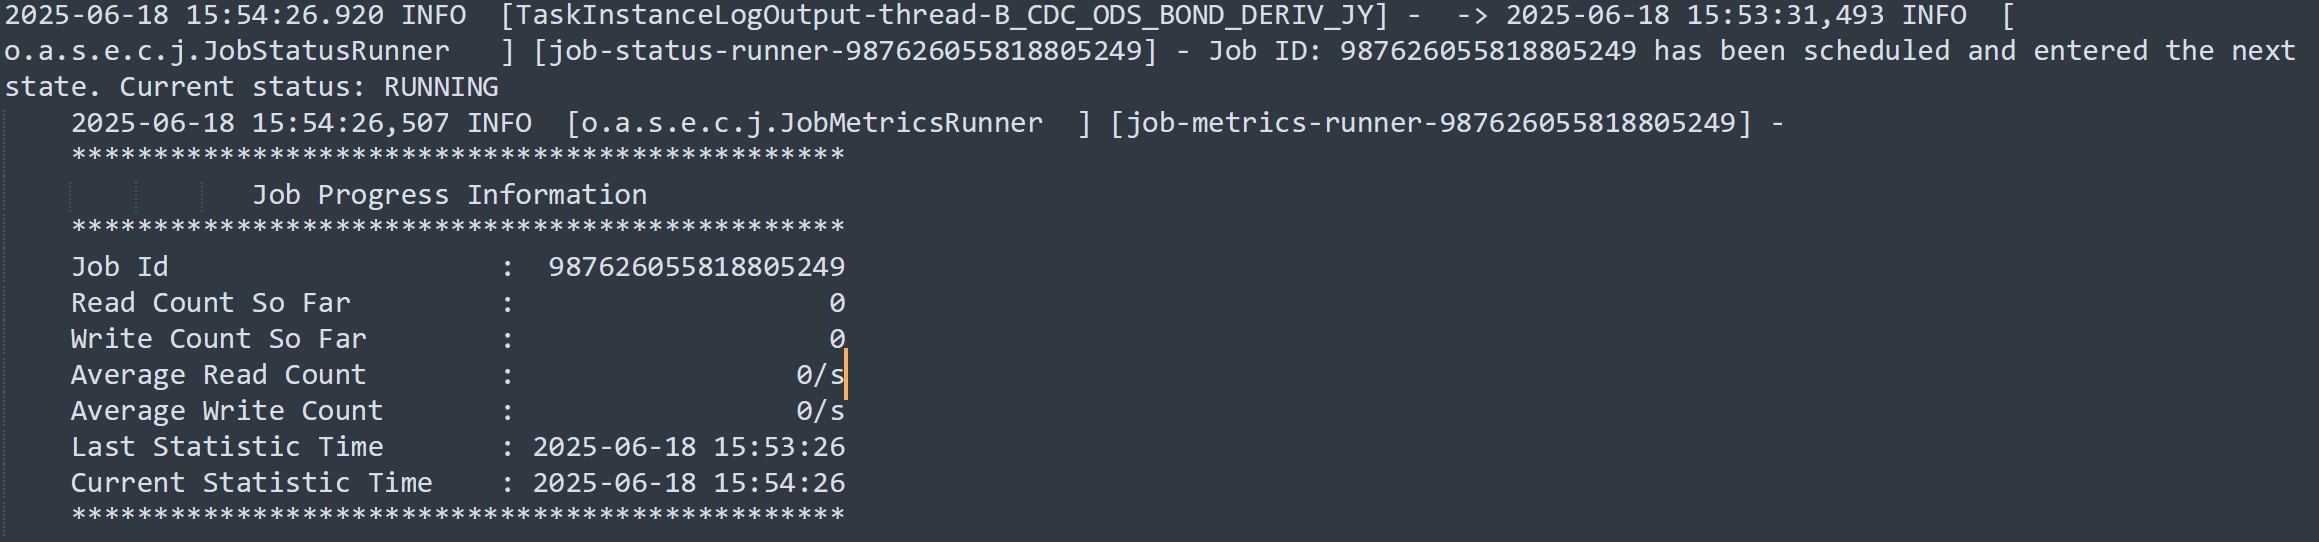
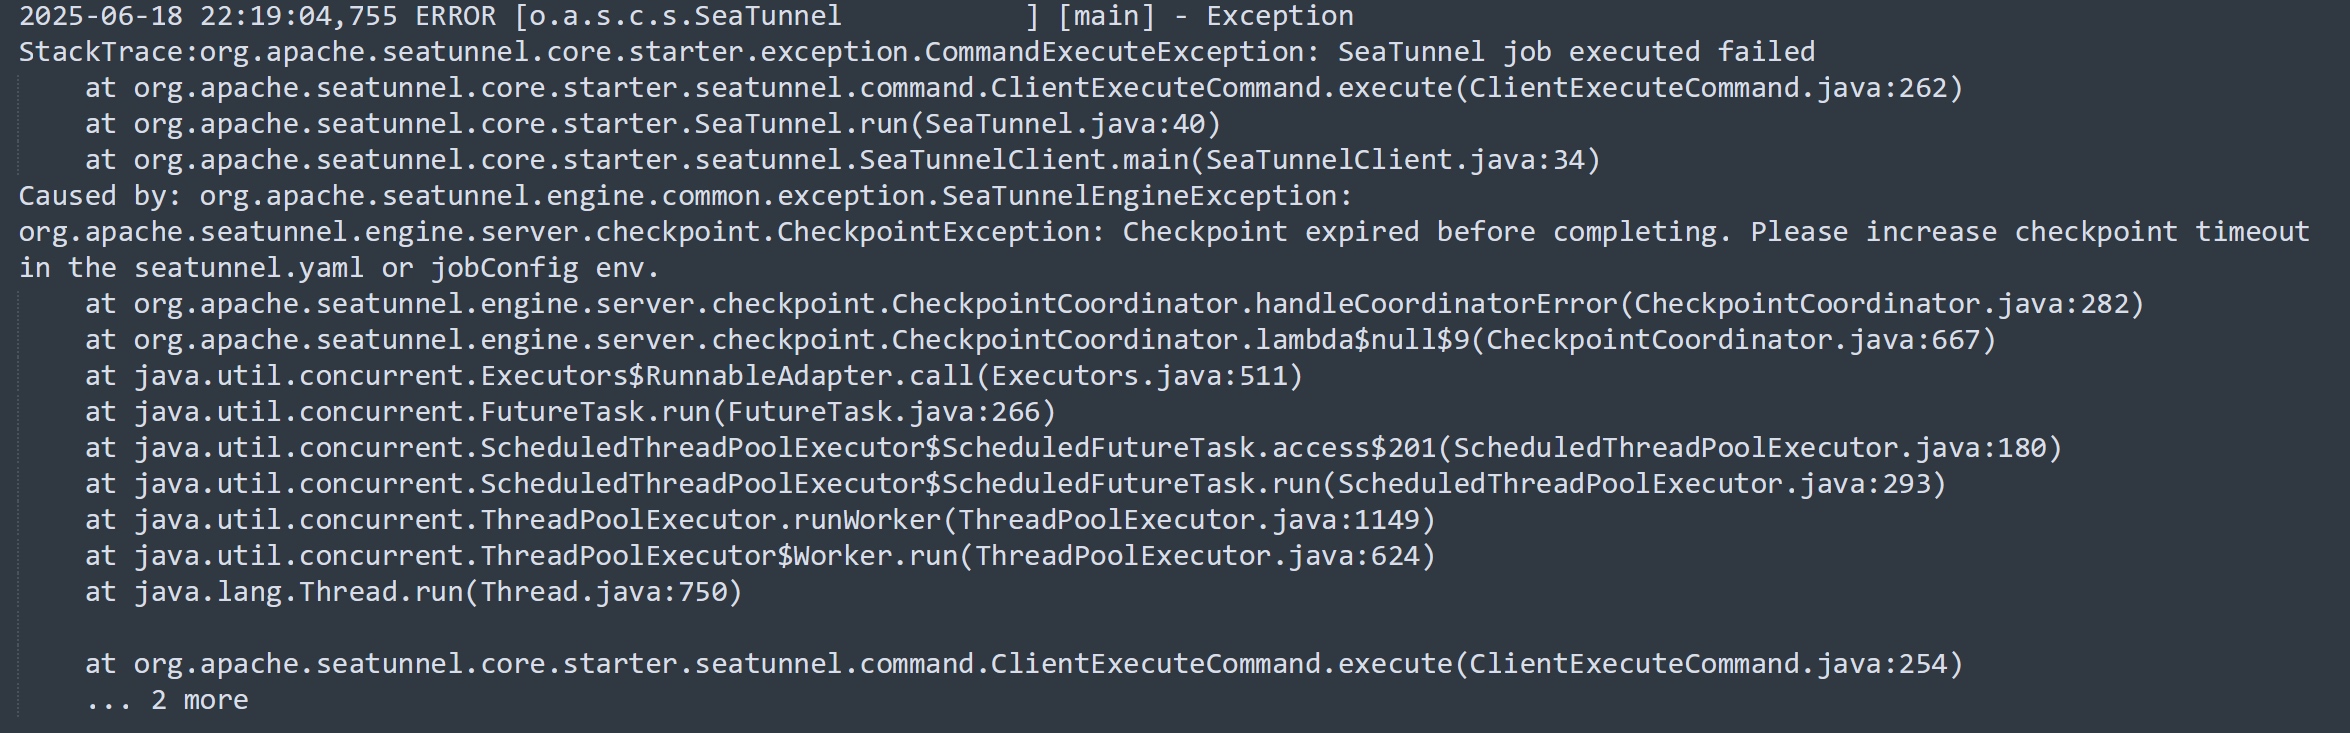
我们项目使用seatunnel从业务库抽数到数仓(StarRocks),已经成功使用Mysql-CDC做了大量的实时同步。但最近在抽一个MySQL表的时候遇到了异常情况,作业启动之后,日志显示读写数量一直为0,且长时间不停止,运行6小时之后以checkpoint timeout异常停止。
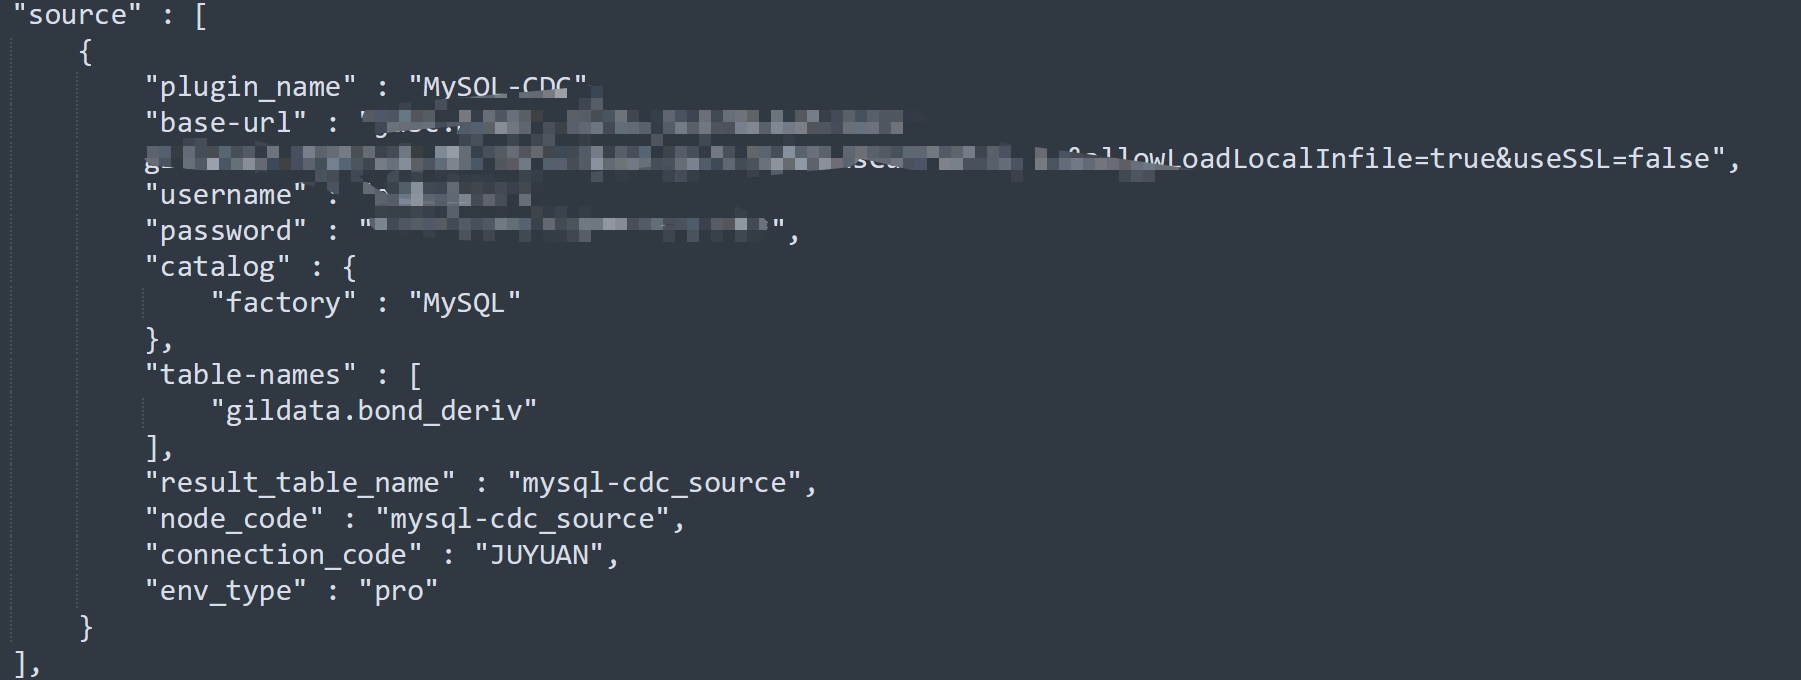
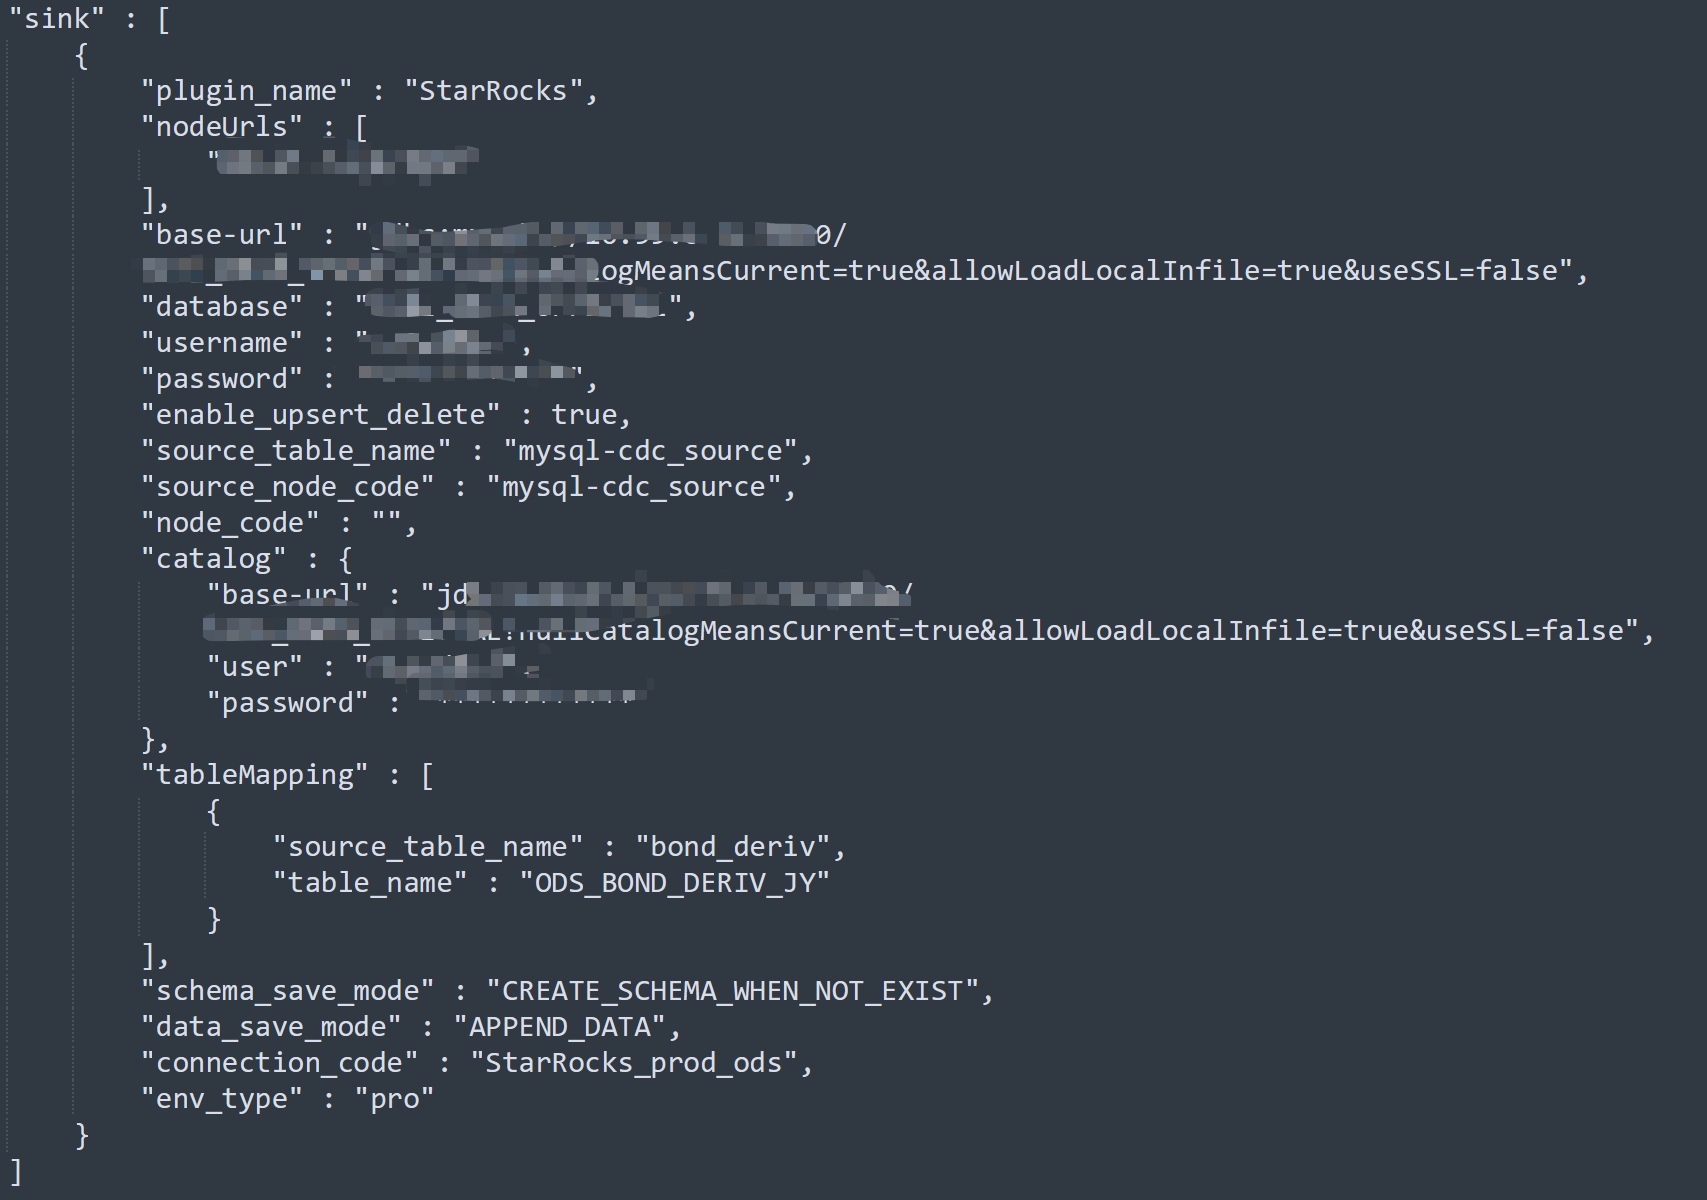
作业模型如下(已擦除涉密信息):
![]()
![]()
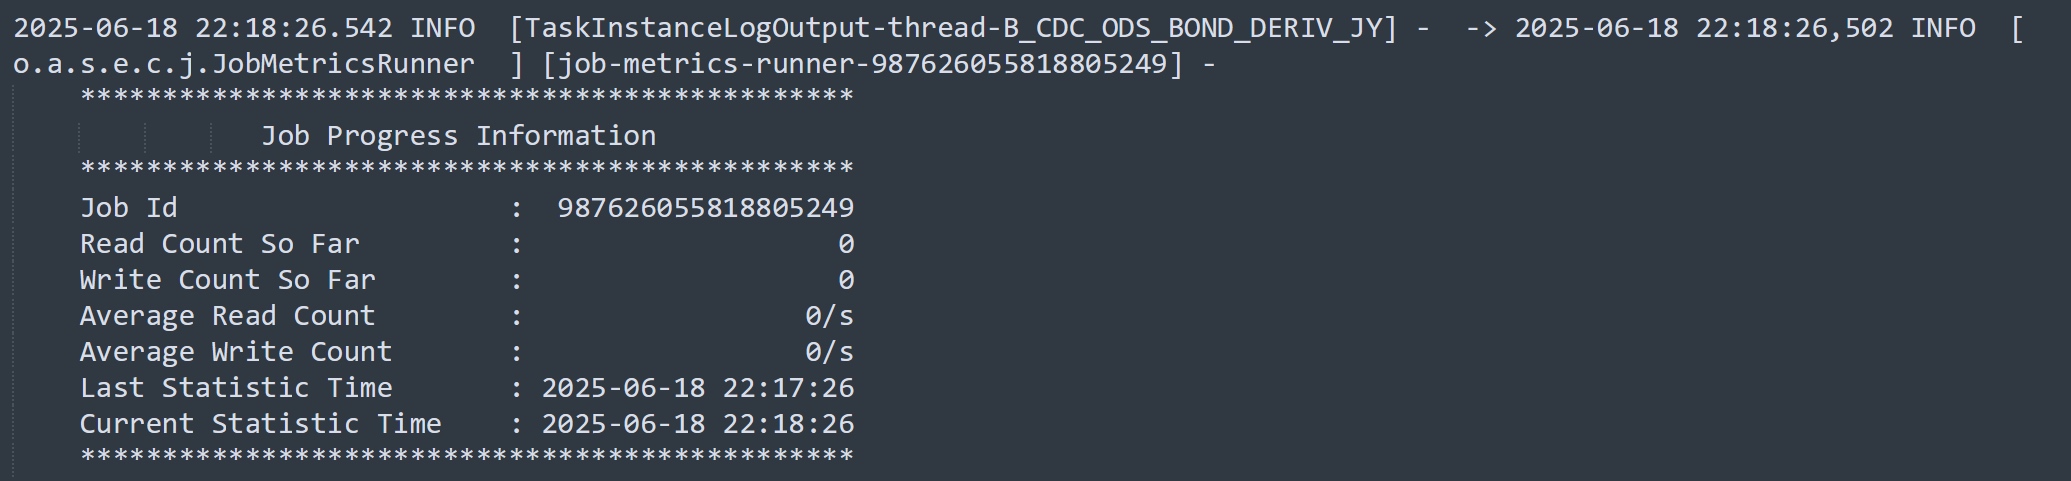
运行关键日志:
![]()
![]()
![]()
问题背景
提出疑问
- 为什么读写数量一直为0?
- 为什么运行这么长时间才报超时?
分析过程
由于之前已大量使用mysql-cdc进行抽数,模型配置基本一致,没有出现过这种问题,大概率不是seatunnel的问题。
对比之前的表,看源表和之前正常接入的表是否有什么不一样。
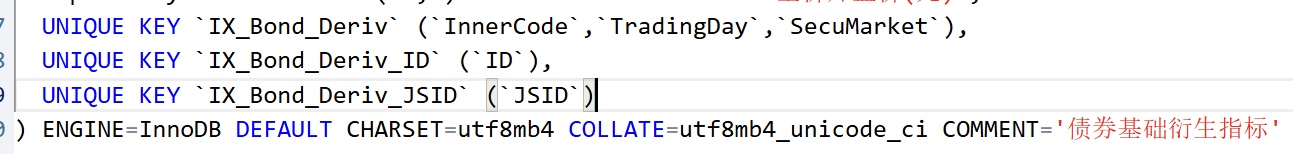
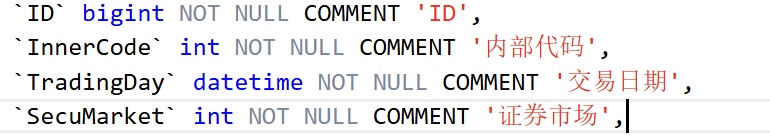
对比之下果然发现猫腻:
之前的表基本都是有自增主键的;本次同步的表没有自增主键,仅设有多个唯一索引 ![]()
![]()
![]()
疑问就来了:SeaTunnel到底是怎样同步数据的?
根据已有的认知,在同步cdc数据时,SeaTunnel会分为两个步骤:先快照同步,再解析binlog进行增量同步。
作业启动读取数量一直为0,应该是在快照同步阶段就卡住了。那么,快照同步的过程是啥呢?
先查看官方文档MySQL CDC | Apache SeaTunnel:https://seatunnel.apache.org/zh-CN/docs/2.3.9/connector-v2/source/MySQL-CDC
其实是没有关于原理方面的介绍的,但是找到了一些可配置参数:
参数解析
chunk-key.even-distribution.factor.upper-bound
默认值:100
英文描述:
The upper bound of the chunk key distribution factor. This factor is used to determine whether the table data is evenly distributed. If the distribution factor is calculated to be less than or equal to this upper bound (i.e., (MAX(id) - MIN(id) + 1) / row count), the table chunks would be optimized for even distribution. Otherwise, if the distribution factor is greater, the table will be considered as unevenly distributed and the sampling-based sharding strategy will be used if the estimated shard count exceeds the value specified by sample-sharding.threshold. The default value is 100.0.
中文描述:
用于分块的key的分布因子的上边界值。这个因子用于决定这个表数据是否是均匀分布的。如果这个分布因子<=上边界值(举例:计算公式(MAX(id) - MIN(id) + 1) / 总数据量),这个表分块的时候会按照均匀分布的策略进行,否则,如果这个分布因子超过了上边界值,这个表被认为是不均匀分布,并且如果预估分片数量超过了sample-sharding.threshold参数值(默认100),会使用基于采样的分片策略。
chunk-key.even-distribution.factor.upper-bound
默认值:0.5
英文描述:
The lower bound of the chunk key distribution factor. This factor is used to determine whether the table data is evenly distributed. If the distribution factor is calculated to be greater than or equal to this lower bound (i.e., (MAX(id) - MIN(id) + 1) / row count), the table chunks would be optimized for even distribution. Otherwise, if the distribution factor is less, the table will be considered as unevenly distributed and the sampling-based sharding strategy will be used if the estimated shard count exceeds the value specified by sample-sharding.threshold. The default value is 0.05.
中文描述:分布因子的下边界值
sample-sharding.threshold
默认值:1000
英文描述:
This configuration specifies the threshold of estimated shard count to trigger the sample sharding strategy. When the distribution factor is outside the bounds specified by chunk-key.even-distribution.factor.upper-bound and chunk-key.even-distribution.factor.lower-bound, and the estimated shard count (calculated as approximate row count / chunk size) exceeds this threshold, the sample sharding strategy will be used. This can help to handle large datasets more efficiently. The default value is 1000 shards.
中文描述:
这个配置项是预估分片数的阈值,用于触发采样分片策略。当分布因子在上下边界之外,并且预估分片数(预估总数据量/分块大小)超过这个阈值,将会使用采样分片策略。这个参数能够帮助更高效的处理非常大的数据量。默认值1000分片。
inverse-sampling.rate
默认值:1000
英文描述:
The inverse of the sampling rate used in the sample sharding strategy. For example, if this value is set to 1000, it means a 1/1000 sampling rate is applied during the sampling process. This option provides flexibility in controlling the granularity of the sampling, thus affecting the final number of shards. It's especially useful when dealing with very large datasets where a lower sampling rate is preferred. The default value is 1000.
中文描述:
参数值的倒数会用于采样分片策略。举例,如果值是1000,按照1/1000去采样。这个参数给控制采样的粒度提供了灵活性,直接影响最终的分片数。在处理非常大的数据量是,配置一个较低的采样率会特别有效。默认值1000。
snapshot.split.size
默认值:8096
英文描述:
The split size (number of rows) of table snapshot, captured tables are split into multiple splits when read the snapshot of table.
中文描述:
快照同步阶段的分片大小(行数),被接入的表会被分割为多个分片
snapshot.fetch.size
默认值:1024
英文描述:
The maximum fetch size for per poll when read table snapshot.
中文描述:
每次读取表快照时最大的拉取大小。应该也是指行数。
从这几个配置中能获取到的信息:
在快照同步阶段会将数据划分为多个分片,根据数据是否均匀分布会有不同的分片策略。
我们这边表数据量大概是6000W,count不出来,业务系统人员反馈的
由于这个表没有主键,也不知道SeaTunnel内部是拿哪个字段作为分块键的?
暂且拿ID做分块键,这个字段正好有唯一索引,也合理
select max(ID),min(ID) from 表
得到最大key值:804306477418
最小key值:607312608210
那么数据分布因子计算为:(804306477418-607312608210+1)/60000000 = 3283.2312
明显不在均匀分布因子0.5~100范围内,那就判定为不均匀分布
按照默认分块大小8096来计算分块数,60000000/8096 = 7411
明显大于sample-sharding.threshold默认值1000,所以猜测走了采样分片策略
默认采样率为1000,按照6000W的数据量来计算,需要采样60000条
此时此刻,我坚定的认为内部一直在采样,并且非常感兴趣SeaTunnel内部是如何采样的,为什么能运行长达6个小时?
简单一想:即使表是6000W数据量,查6W条数据好像也不应该那么慢吧,肯定是按照ID查,且仅查ID,ID上有唯一索引
最终决定拉下源码,一探究竟
SeaTunnel架构还是挺复杂的,整环境主要是拉依赖花了大概一天时间,过程不做赘述。
具体怎么找到关键代码的说实话我忘了,也是花了大概一天时间,好像是通过日志中的关键字找的,不了解架构情况下其实挺难找到对应代码。
部分源码解读
    private List<ChunkRange> splitTableIntoChunks(
            JdbcConnection jdbc, TableId tableId, Column splitColumn) throws Exception {
        final String splitColumnName = splitColumn.name();
        //获取最大最小值
        final Object[] minMax = queryMinMax(jdbc, tableId, splitColumn);
        final Object min = minMax[0];
        final Object max = minMax[1];
        if (min == null || max == null || min.equals(max)) {
            // empty table, or only one row, return full table scan as a chunk
            return Collections.singletonList(ChunkRange.all());
        }

        //获取配置中的分块大小,分布因子边界值,采样分片阈值
        final int chunkSize = sourceConfig.getSplitSize();
        final double distributionFactorUpper = sourceConfig.getDistributionFactorUpper();
        final double distributionFactorLower = sourceConfig.getDistributionFactorLower();
        final int sampleShardingThreshold = sourceConfig.getSampleShardingThreshold();

        log.info(
                "Splitting table {} into chunks, split column: {}, min: {}, max: {}, chunk size: {}, "
                        + "distribution factor upper: {}, distribution factor lower: {}, sample sharding threshold: {}",
                tableId,
                splitColumnName,
                min,
                max,
                chunkSize,
                distributionFactorUpper,
                distributionFactorLower,
                sampleShardingThreshold);

        if (isEvenlySplitColumn(splitColumn)) {
            //获取预估总数,用的是show table status
            long approximateRowCnt = queryApproximateRowCnt(jdbc, tableId);
            //计算分布因子
            double distributionFactor =
                    calculateDistributionFactor(tableId, min, max, approximateRowCnt);
            //判断是否均匀分布
            boolean dataIsEvenlyDistributed =
                    doubleCompare(distributionFactor, distributionFactorLower) >= 0
                            && doubleCompare(distributionFactor, distributionFactorUpper) <= 0;
            //如果均匀分布,按照走均匀分布分片策略
            if (dataIsEvenlyDistributed) {
                // the minimum dynamic chunk size is at least 1
                final int dynamicChunkSize = Math.max((int) (distributionFactor * chunkSize), 1);
                return splitEvenlySizedChunks(
                        tableId, min, max, approximateRowCnt, chunkSize, dynamicChunkSize);
            } else {
                //走采样分片策略前要判断是否超过采样分片数阈值
                int shardCount = (int) (approximateRowCnt / chunkSize);
                int inverseSamplingRate = sourceConfig.getInverseSamplingRate();
                if (sampleShardingThreshold < shardCount) {
                    // It is necessary to ensure that the number of data rows sampled by the
                    // sampling rate is greater than the number of shards.
                    // Otherwise, if the sampling rate is too low, it may result in an insufficient
                    // number of data rows for the shards, leading to an inadequate number of
                    // shards.
                    // Therefore, inverseSamplingRate should be less than chunkSize
                    if (inverseSamplingRate > chunkSize) {
                        log.warn(
                                "The inverseSamplingRate is {}, which is greater than chunkSize {}, so we set inverseSamplingRate to chunkSize",
                                inverseSamplingRate,
                                chunkSize);
                        inverseSamplingRate = chunkSize;
                    }
                    log.info(
                            "Use sampling sharding for table {}, the sampling rate is {}",
                            tableId,
                            inverseSamplingRate);
                    //采样
                    Object[] sample =
                            sampleDataFromColumn(jdbc, tableId, splitColumn, inverseSamplingRate);
                    log.info(
                            "Sample data from table {} end, the sample size is {}",
                            tableId,
                            sample.length);
                    //走采样分片策略
                    return efficientShardingThroughSampling(
                            tableId, sample, approximateRowCnt, shardCount);
                }
                //走不均匀分布分片策略
                return splitUnevenlySizedChunks(jdbc, tableId, splitColumn, min, max, chunkSize);
            }
        } else {
            return splitUnevenlySizedChunks(jdbc, tableId, splitColumn, min, max, chunkSize);
        }
    }
这里关注采样逻辑:
    public static Object[] skipReadAndSortSampleData(
            JdbcConnection jdbc, TableId tableId, String columnName, int inverseSamplingRate)
            throws Exception {
        //即select ID from 源表
        final String sampleQuery =
                String.format("SELECT %s FROM %s", quote(columnName), quote(tableId));

        Statement stmt = null;
        ResultSet rs = null;

        List<Object> results = new ArrayList<>();
        try {
            //直接把6000W个ID一次性查出来效率很低,会有内存溢出风险,这里使用到了游标查询
            stmt =
                    jdbc.connection()
                            .createStatement(
                                    ResultSet.TYPE_FORWARD_ONLY, ResultSet.CONCUR_READ_ONLY);

            stmt.setFetchSize(Integer.MIN_VALUE);
            rs = stmt.executeQuery(sampleQuery);

            int count = 0;
            while (rs.next()) {
                //遍历所有数据,每10W条打印一条日志记录进度
                count++;
                if (count % 100000 == 0) {
                    log.info("Processing row index: {}", count);
                }
                //对采样率1000进行取模,即ID是1000的整数倍的作为样本
                if (count % inverseSamplingRate == 0) {
                    results.add(rs.getObject(1));
                }
                if (Thread.currentThread().isInterrupted()) {
                    throw new InterruptedException("Thread interrupted");
                }
            }
        } finally {
            if (rs != null) {
                try {
                    rs.close();
                } catch (SQLException e) {
                    log.error("Failed to close ResultSet", e);
                }
            }
            if (stmt != null) {
                try {
                    stmt.close();
                } catch (SQLException e) {
                    log.error("Failed to close Statement", e);
                }
            }
        }
        Object[] resultsArray = results.toArray();
        Arrays.sort(resultsArray);
        return resultsArray;
    }
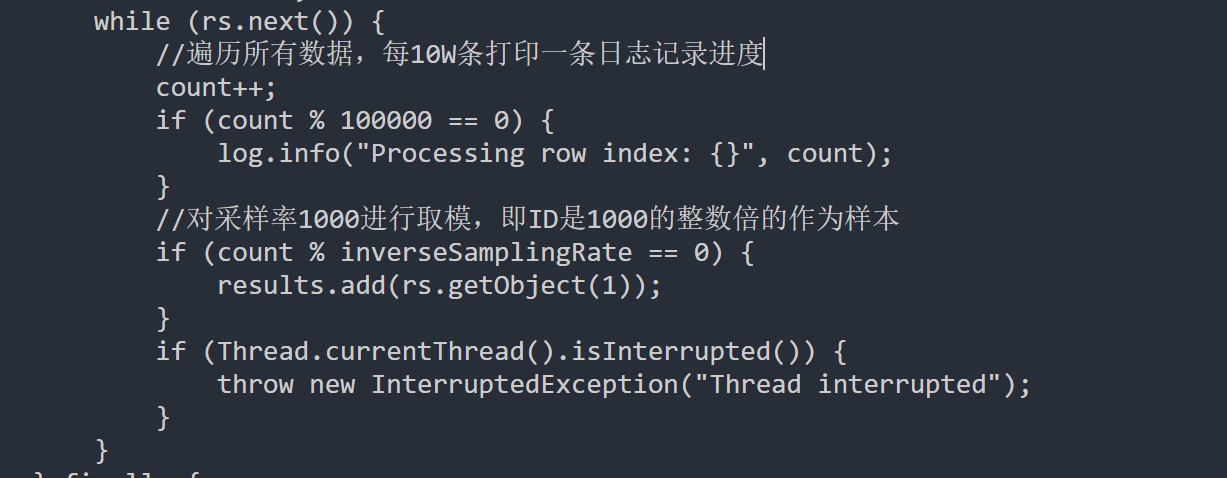
这就是核心采样逻辑了,原来要遍历所有的数据啊,难怪那么慢,我看服务端日志确实有Processing row index,之前我还纳闷这是在干啥,一直打印不完。
![]()
这里大概采60000个ID。
继续看采样分片逻辑:
    protected List<ChunkRange> efficientShardingThroughSampling(
            TableId tableId, Object[] sampleData, long approximateRowCnt, int shardCount) {
        log.info(
                "Use efficient sharding through sampling optimization for table {}, the approximate row count is {}, the shardCount is {}",
                tableId,
                approximateRowCnt,
                shardCount);

        final List<ChunkRange> splits = new ArrayList<>();

        if (shardCount == 0) {
            splits.add(ChunkRange.of(null, null));
            return splits;
        }
        //样本数除以分片数,这里主要用于判断样本数是否大于分片数,保证样本在分片上的覆盖率
        double approxSamplePerShard = (double) sampleData.length / shardCount;

        Object lastEnd = null;
        if (approxSamplePerShard <= 1) {
            splits.add(ChunkRange.of(null, sampleData[0]));
            lastEnd = sampleData[0];
            //样本数小于等于分片数的时候,有多少样本分多少片,
            for (int i = 1; i < sampleData.length; i++) {
                // avoid split duplicate data
                if (!sampleData[i].equals(lastEnd)) {
                    splits.add(ChunkRange.of(lastEnd, sampleData[i]));
                    lastEnd = sampleData[i];
                }
            }

            splits.add(ChunkRange.of(lastEnd, null));

        } else {
            //样本数大于分片数时,要让每个分片的ID范围保持一致
            for (int i = 0; i < shardCount; i++) {
                Object chunkStart = lastEnd;
                Object chunkEnd =
                        (i < shardCount - 1)
                                ? sampleData[(int) ((i + 1) * approxSamplePerShard)]
                                : null;
                // avoid split duplicate data
                if (i == 0 || i == shardCount - 1 || !Objects.equals(chunkEnd, chunkStart)) {
                    splits.add(ChunkRange.of(chunkStart, chunkEnd));
                    lastEnd = chunkEnd;
                }
            }
        }
        return splits;
    }
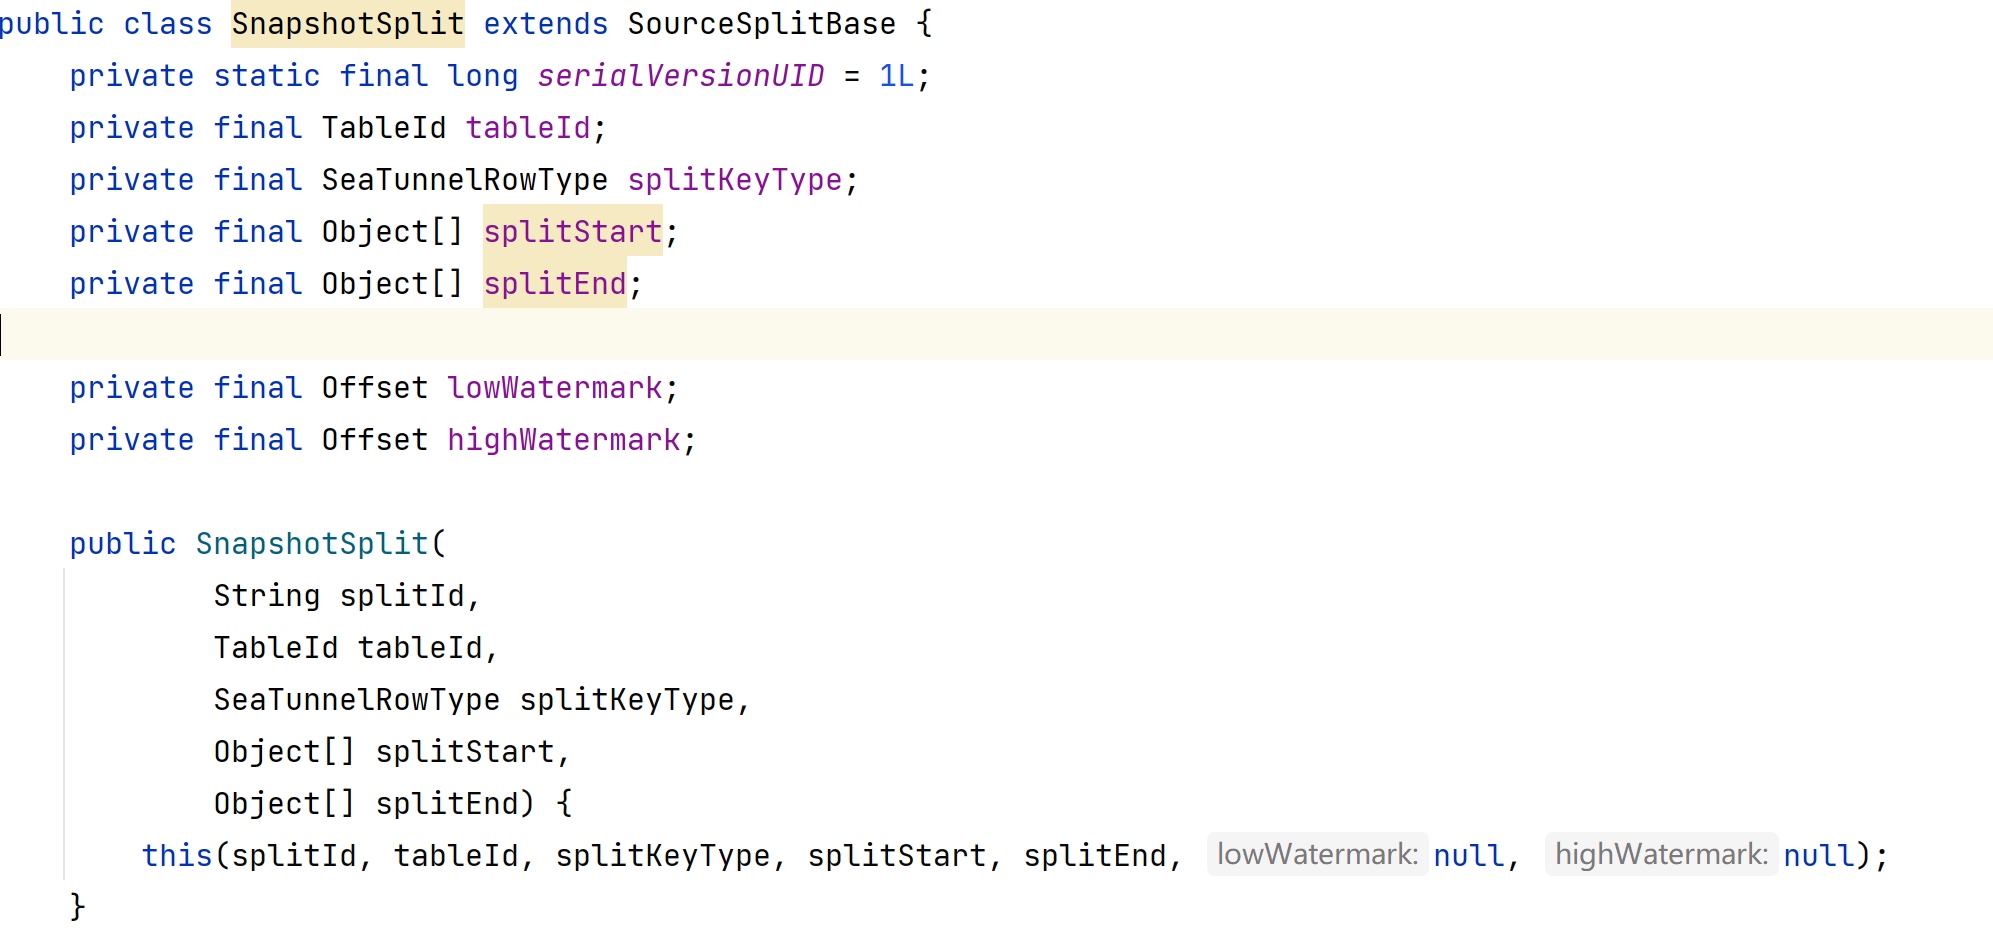
最终得到一个分片的集合,每个分片有自己的起始位置,且不会有交集,再来看看分片的类定义吧:
![]()
![]()
快照分片是为了实现并行读取,这样可以更快的拉取历史数据。
解决方式
通过上述分析,我们大致知道了快照读阶段是怎么个过程,也验证到之前作业一直读不到数时因为在做采样,需要遍历所有数据。之所以会做采样,是因为SeaTunnel判定源表的数据为不均匀分布了。
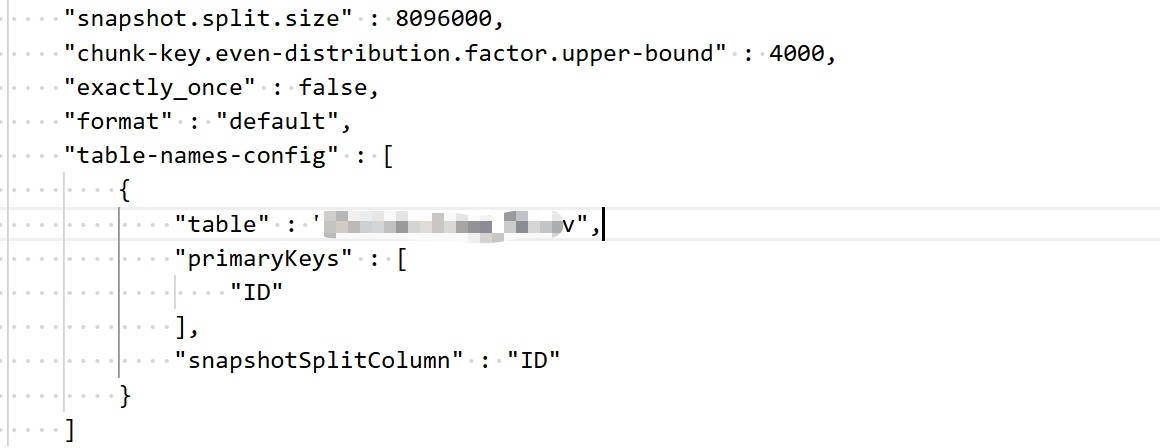
我们的需求已经卡了好几天了,想要让SeaTunnel尽快地开始同步数据,我们想到一个最简单的方式:调整参数让SeaTunnel判定为是均匀分布的,这样就不会走采样了,不走采样的话分片很快就结束了。
默认均匀分布因子范围是0.5~100,而我们的数据算出来分布因子大概是3000多,果断把分布因子调为4000,最终配置如下: ![]()
snapshot.split.size,是因为我们的数据很不均匀,间隔率大概3000,所以在默认值的基础上加了1000倍,(啊我承认瞎加的,不知道有用没)。
table-names-config:手动给表指定主键和快照分片键,因为我的表没有主键,暂时还不知道SeaTunnel是如何选择分块键的,既然可以指定就试试唠(也是我瞎加的)。
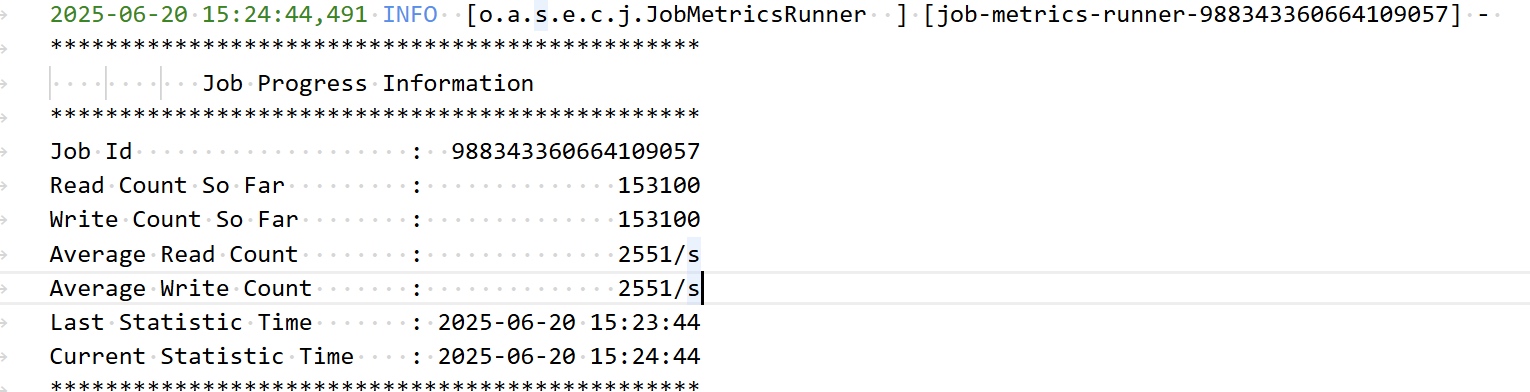
最终结果
那当然是开始同步了呀!
![]()
原文链接:https://blog.csdn.net/qq_36265343/article/details/148918844
本文由 白鲸开源科技 提供发布支持!