前言 🕸️雷达图(Radar Chart) 也称为网络图、星图或蜘蛛网图。
是以从同一点开始的轴上表示的三个或更多个定量变量的二维图表的形式显示多元数据的图形方法。
适用于显示三个或更多的维度的变量。
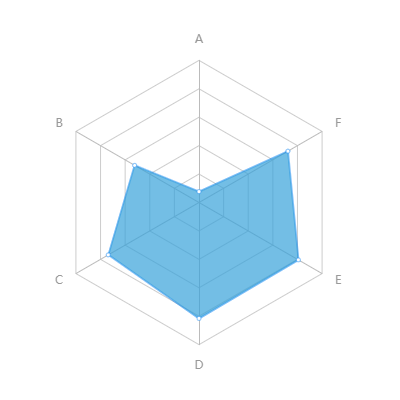
🕸️雷达图常用于📚数据统计或对比,对于查看哪些变量具有相似的值、变量之间是否有异常值都很有用。
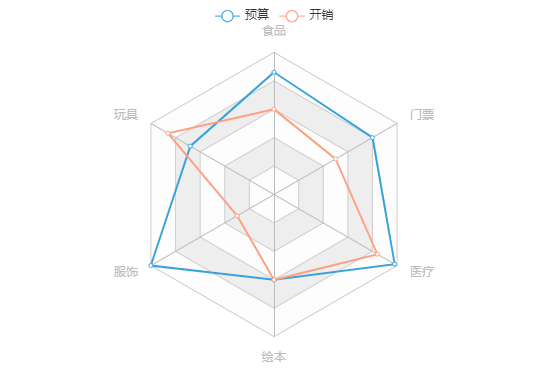
🎮同时在不少游戏中都有雷达图的身影,可以很直观地展示并对比一些数据。
例如王者荣耀中的对战资料中就用到了:
🔎那么在本篇文章中,皮皮就来分享下在 Cocos Creator 中如何利用 Graphics 组件来绘制炫酷的雷达图~
文中会对原始代码进行一定的削减以保证阅读体验。
需要完整代码文件的小伙伴可在文章底部“阅读原文”处获取。
预览 😲先来看看效果吧~
在线预览:https://ifaswind.gitee.io/eazax-cases/?case=radarChart
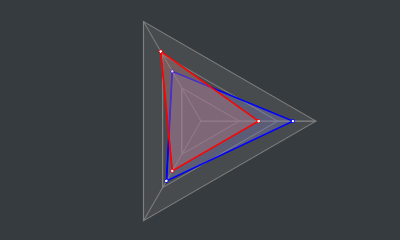
😃「两条数据」
😮「缓动数据」
😵「花里胡哨」
😱「艺术就是爆炸」
😈「逐渐偏离主题」
🙌 没有人
👐 比我
👌 更懂
☝️ 花里胡哨
(👱川老师直呼内行)
正文 🎭Graphics 组件 在我们正式开始制作雷达图之前,让我们先来大概了解一下 Cocos Creator 引擎中的 Graphics 组件。
Graphics 组件继承于 cc.RenderComponent,利用该组件我们可以实现画板和表格之类的功能。
下面是我们本次将会用到的属性:
lineCap:设置或返回线条两端的样式(无、圆形线帽或方形线帽)
lineJoin:设置或返回两条线相交时的拐角样式(斜角、圆角或尖角)
lineWidth:设置或返回当前画笔的粗细(线条的宽度)
fillColor:设置或返回填充用的颜色(油漆桶)
下面是我们本次将会用到的函数:
moveTo(x, y):抬起画笔并移动到指定位置(不创建线条)
lineTo(x, y):放下画笔并创建一条直线至指定位置
circle(cx, cy, r):在指定位置(圆心)画一个圆
close():闭合已创建的线条(相当于
lineTo(起点))
stroke():绘制已创建(但未被绘制)的线条(将线条想象成默认透明的,此行为则是赋予线条颜色)
fill():填充当前线条包围的区域(如果线条没有闭合则会尝试”模拟闭合“起点和终点)
Graphics 组件文档:http://docs.cocos.com/creator/manual/zh/components/graphics.html?h=graphics
🎨画网格 先来看看一个标准的雷达图有啥特点:
🔮发现了吗?雷达图的基本特点如下:
先算出轴之间的夹角度数 [ 360 ÷ 轴数 ],再计算所有轴的角度:
this .angles = [];// 轴间夹角 const iAngle = 360 / this .axes;for (let i = 0 ; i < this .axes; i++) {// 计算 const angle = iAngle * i;this .angles.push(angle);雷达图至少拥有 3 条轴,且「每条轴上都应有 1 个或以上的刻度(不包含中心点)」 :
所以我们需使用一个二维数组来保存所有刻度的坐标,从最外层(即轴线的末端)的刻度开始记录,方便我们绘制时读取:
// 创建一个二维数组 let scalesSet: cc.Vec2[][] = [];for (let i = 0 ; i < 轴上刻度个数; i++) {// 用来保存当前层上的刻度坐标 let scales = [];// 计算刻度在轴上的位置 const length = 轴线长度 - (轴线长度 / 轴上刻度个数 * i);for (let j = 0 ; j < this .angles.length; j++) {// 将角度转为弧度 const radian = (Math .PI / 180 ) * this .angles[j];// 根据三角公式计算刻度相对于中心点(0, 0)的坐标 const pos = cc.v2(length * Math .cos(radian), length * Math .sin(radian));// 推进数组 // 推进二维数组 连接中心点 (0, 0) 和最外层 scalesSet[0] 的刻度即为轴线:
// 遍历全部最外层的刻度 for (let i = 0 ; i < scalesSet[0 ].length; i++) {// 画笔移动至中心点 this .graphics.moveTo(0 , 0 );// 创建线条 this .graphics.lineTo(scalesSet[0 ][i].x, scalesSet[0 ][i].y);连接所有轴上最外层 scalesSet[0] 的刻度即形成外网格线:
// 画笔移动至第一个点 this .graphics.moveTo(scalesSet[0 ][0 ].x, scalesSet[0 ][0 ].y);for (let i = 1 ; i < scalesSet[0 ].length; i++) {// 创建线条 this .graphics.lineTo(scalesSet[0 ][i].x, scalesSet[0 ][i].y);// 闭合当前线条(外网格线) this .graphics.close();这里需要注意「先填充颜色再绘制线条」 ,要不然轴线和网格线就被挡住了:
// 填充线条包围的空白区域 this .graphics.fill();// 绘制已创建的线条(轴线和外网格线) this .graphics.stroke();👀于是现在我们就有了这么个玩意儿:
当刻度大于 1 个时就需要绘制内网格线,从刻度坐标集的下标 1 开始绘制:
// 刻度大于 1 个时才绘制内网格线 if (scalesSet.length > 1 ) {// 从下边 1 开始(下标 0 是外网格线) for (let i = 1 ; i < scalesSet.length; i++) {// 画笔移动至第一个点 this .graphics.moveTo(scalesSet[i][0 ].x, scalesSet[i][0 ].y);for (let j = 1 ; j < scalesSet[i].length; j++) {// 创建线条 this .graphics.lineTo(scalesSet[i][j].x, scalesSet[i][j].y);// 闭合当前线条(内网格线) this .graphics.close();// 绘制已创建的线条(内网格线) this .graphics.stroke();🙉就这样我们雷达图的底子就画好啦:
🎲画数据 编写画线逻辑之前,先确定一下我们需要的数据结构:
数值数组(必须,小数形式的比例,至少包含 3 个值)
具体的数据结构如下(导出类型方便外部使用):
/** export interface RadarChartData {/** 数值 */ number [];/** 线的宽度 */ number ;/** 线的颜色 */ /** 填充的颜色 */ /** 节点的颜色 */ 绘制数据比较简单,我们只需要算出数据点在图表中的位置,并将数据连起来就好了。
在 draw 函数中我们接收一份或以上的雷达图数据,并按照顺序遍历绘制出来(⚠️长代码警告):
/** public draw(data: RadarChartData | RadarChartData[]) {// 处理数据 const datas = Array .isArray(data) ? data : [data];// 开始绘制数据 for (let i = 0 ; i < datas.length; i++) {// 装填染料 this .graphics.strokeColor = datas[i].lineColor || defaultOptions.lineColor;this .graphics.fillColor = datas[i].fillColor || defaultOptions.fillColor;this .graphics.lineWidth = datas[i].lineWidth || defaultOptions.lineWidth;// 计算节点坐标 let coords = [];for (let j = 0 ; j < this .axes; j++) {const value = datas[i].values[j] > 1 ? 1 : datas[i].values[j];const length = value * this .axisLength;const radian = (Math .PI / 180 ) * this .angles[j];const pos = cc.v2(length * Math .cos(radian), length * Math .sin(radian))// 创建线条 this .graphics.moveTo(coords[0 ].x, coords[0 ].y);for (let j = 1 ; j < coords.length; j++) {this .graphics.lineTo(coords[j].x, coords[j].y);this .graphics.close(); // 闭合线条 // 填充包围区域 this .graphics.fill();// 绘制线条 this .graphics.stroke();// 绘制数据节点 for (let j = 0 ; j < coords.length; j++) {// 大圆 this .graphics.strokeColor = datas[i].lineColor || defaultOptions.lineColor;this .graphics.circle(coords[j].x, coords[j].y, 2 );this .graphics.stroke();// 小圆 this .graphics.strokeColor = datas[i].joinColor || defaultOptions.joinColor;this .graphics.circle(coords[j].x, coords[j].y, .65 );this .graphics.stroke();💯到这里我们已经成功制作了一个可用的雷达图:
🌟「但是!我们的征途是星辰大海!必须加点料!」
🎉加料不加价 😑完全静态的雷达图实在是太无趣太普通,得想想办法让它动起来!
😯我们的雷达图数据的数值是数组形式,想到怎么样才能让这些数值动起来了吗?
😋「别 担 心 !」
😎得益于 Cocos Creator 为我们提供的 「Tween 缓动系统」 ,让复杂的数据动起来变得异常简单!
😏我们只需要这样,这样,然后那样,是不是很简单?
cc.tween 支持缓动任意对象的任意属性
缓动系统:http://docs.cocos.com/creator/manual/zh/scripting/tween.html
另外我在《一个全能的挖孔 Shader》 中也是使用了缓动系统来让挖孔动起来~
在线预览:https://ifaswind.gitee.io/eazax-cases/?case=newGuide
我的思路是:
将当前的数据保存到当前实例的
this.curDatas 中
接收到新的数据时,使用
cc.tween 对
this.curData 的属性进行缓动
在
update 中调用
draw 函数,每帧都重新绘制
this.curDatas 中的数据
// 当前雷达图数据 private curDatas: RadarChartData[] = [];protected update() {if (!this .keepUpdating) return ;// 绘制当前数据 this .draw(this .curDatas);/** public to(data: RadarChartData | RadarChartData[], duration: number ) {// 处理重复调用 this .unscheduleAllCallbacks();// 包装单条数据 const datas = Array .isArray(data) ? data : [data];// 打开每帧更新 this .keepUpdating = true ;// 动起来! for (let i = 0 ; i < datas.length; i++) {// 数值动起来! // 遍历数据中的全部数值,逐个让他们动起来! for (let j = 0 ; j < this .curDatas[i].values.length; j++) {// 限制最大值为 1(即 100%) const value = datas[i].values[j] > 1 ? 1 : datas[i].values[j];this .curDatas[i].values)// 样式动起来! // 没有指定则使用原来的样式! this .curDatas[i])this .curDatas[i].lineWidth,this .curDatas[i].lineColor,this .curDatas[i].fillColor,this .curDatas[i].joinColorthis .scheduleOnce(() =>// 关闭每帧更新 this .keepUpdating = false ;🎊数值和样式都动起来了:
点击文章底部“阅读原文”即可获取完整雷达图组件。
更多分享 《为什么选择使用 TypeScript ?》
《高斯模糊 Shader》
《一文看懂 YAML》
《Cocos Creator 性能优化:DrawCall》
《互联网运营术语扫盲》
公众号 菜鸟小栈 我是陈皮皮,这是我的个人公众号,专注但不仅限于游戏开发、前端和后端技术记录与分享。
每一篇原创都非常用心,你的关注就是我原创的动力!
Input and output.