ELK日志集中化管理系统安装
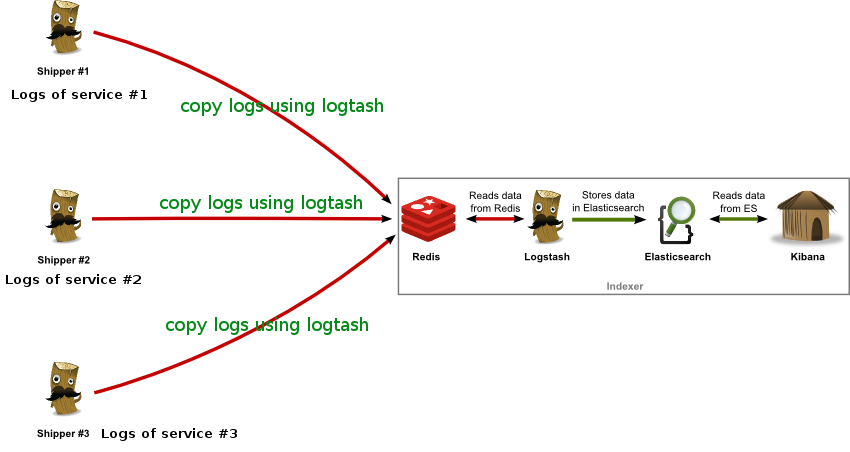
ELK Stack 是 Elasticsearch、Logstash、Kibana 三个开源软件的组合。在实时数据检索和分析场合,三者通常是配合共用,而且又都先后归于 Elastic.co 公司名下,故有此简称。 ELK Stack 在最近两年迅速崛起,成为机器数据分析,或者说实时日志处理领域,开源界的第一选择。 ELK由三个组建构成,分别是 Elasticsearch,负责数据的索引和存储 Logstash ,负责日志的采集和格式化 Kibana,负责前端统计的展示 大致的架构如下: redis提供队列来作为broker负责log传输过程中的缓冲,也可以由kafka等来代替。 一、logstansh安装 1、JDK安装 1 2 3 4 5 yum-y install java-1.8.0 [root@ELKServer~] #java-version openjdkversion "1.8.0_101" OpenJDKRuntimeEnvironment(build1.8.0_101-b13) OpenJDK64-BitServerVM(build25.101-b13,mixedmode) 2、logstansh安装 1 2 3 4 5 wgethttps: //download .elastic.co /logstash/logstash/logstash-2 .3.4.zip unziplogstash-2.3.4.zip mv logstash-2.3.4 /usr/local/ echo "PATH=$PATH:/usr/local/logstash-2.3.4/bin" >> /etc/profile source /etc/profile 3、新建logstansh配置文件目录 1 mkdir /usr/local/logstash-2 .3.4 /conf 4、测试logstansh 1 2 3 4 5 [root@ELKServerlogstash-2.3.4] #logstash-e"input{stdin{}}output{stdout{}}" hello Settings:Defaultpipelineworkers:1 Pipelinemainstarted 2016-07-28T12:47:41.597Z0.0.0.0hello 二、redis安装 1、redis安装 1 2 3 4 5 6 7 8 9 10 11 12 13 14 15 16 17 18 19 20 21 22 23 24 25 26 27 28 29 30 31 32 33 34 wgethttp: //download .redis.io /releases/redis-2 .8.20. tar .gz yum install tcl-y tar -zxvfredis-2.8.20. tar .gz mv redis-2.8.20/ /usr/local/ [root@ELKServerlogstash-2.3.4] #cd/usr/local/redis-2.8.20/ [root@ELKServerredis-2.8.20] #makeMALLOC=libc [root@ELKServerredis-2.8.20] #makeinstall [root@ELKServerredis-2.8.20] #cdutils/ [root@ELKServerutils] #./install_server.sh#所有选项默认 Welcometotheredisserviceinstaller Thisscriptwillhelpyoueasily set uparunningredisserver Please select theredisport for thisinstance:[6379] Selectingdefault:6379 Please select theredisconfig file name[ /etc/redis/6379 .conf] Selecteddefault- /etc/redis/6379 .conf Please select theredislog file name[ /var/log/redis_6379 .log] Selecteddefault- /var/log/redis_6379 .log Please select thedatadirectory for thisinstance[ /var/lib/redis/6379 ] Selecteddefault- /var/lib/redis/6379 Please select theredisexecutablepath[ /usr/local/bin/redis-server ] Selectedconfig: Port:6379 Config file : /etc/redis/6379 .conf Log file : /var/log/redis_6379 .log Data dir : /var/lib/redis/6379 Executable: /usr/local/bin/redis-server CliExecutable: /usr/local/bin/redis-cli Isthisok?ThenpressENTERtogoonorCtrl-Ctoabort. Copied /tmp/6379 .conf=> /etc/init .d /redis_6379 Installingservice... Successfullyaddedtochkconfig! Successfullyaddedtorunlevels345! StartingRedisserver... Installationsuccessful! 2、查看redis的监控端口 1 2 3 [root@ELKServerutils] #netstat-tnlp|grepredis tcp000.0.0.0:63790.0.0.0:*LISTEN2085 /redis-server * tcp00:::6379:::*LISTEN2085 /redis-server * 3、测试redis是否缓存数据 a、新建logstansh配置文件如下: 1 2 3 4 5 6 7 8 9 10 [root@ELKServerconf] #catoutput_redis.conf input{stdin{}} #手动输入数据 output{ stdout{codec=>rubydebug} #页面debug信息 redis{ host=> '192.168.10.49' data_type=> 'list' key=> 'redis' } } b、启动logstansh 1 2 3 4 5 6 7 8 9 10 11 12 13 [root@ELKServerconf] #logstash-foutput_redis.conf--verbose startingagent{:level=>:info} startingpipeline{: id => "main" ,:level=>:info} Settings:Defaultpipelineworkers:1 Startingpipeline{: id => "main" ,:pipeline_workers=>1,:batch_size=>125,:batch_delay=>5,:max_inflight=>125,:level=>:info} Pipelinemainstarted hello #手动输入 { "message" => "hello" , "@version" => "1" , "@timestamp" => "2016-07-28T13:09:42.651Z" , "host" => "0.0.0.0" } c、查看redis中是否存在数据。 1 cd /usr/local/redis-2 .8.20 /src/ 执行下面这条命令后再执行logstash -f output_redis.conf(最好分两个ssh会话测试)。 1 2 3 [root@ELKServersrc] #./redis-climonitor OK 1469711599.811344[0192.168.10.49:56179] "rpush" "redis" "{\"message\":\"hello\",\"@version\":\"1\",\"@timestamp\":\"2016-07-28T13:13:18.446Z\",\"host\":\"0.0.0.0\"}" 三、elasticsearch安装 1、elasticsearch安装配置 1 2 3 wgethttps: //download .elastic.co /elasticsearch/release/org/elasticsearch/distribution/zip/elasticsearch/2 .3.4 /elasticsearch-2 .3.4.zip unzipelasticsearch-2.3.4.zip mv elasticsearch-2.3.4 /usr/local/ 修改elasticsearch配置文件 1 vim /usr/local/elasticsearch-2 .3.4 /config/elasticsearch .yml 把下面参数的注释去掉并改成服务器IP。这里只做简单安装,优化及集群后面再介绍 1 network.host:192.168.10.49 2、elasticsearch启动 1 2 [root@ELKServerbin] #/usr/local/elasticsearch-2.3.4/bin/elasticsearch-d [root@ELKServerbin] #Exceptioninthread"main"java.lang.RuntimeException:don'trunelasticsearchasroot.' elasticsearch启动不能使用root用户。新建elk用户,并把elasticsearch目录用户所有者改成elk 1 [elk@ELKServerbin]$. /elasticsearch -d 查看elasticsearch是否启动 1 2 3 [elk@ELKServerbin]$ netstat -tnlp| grep java tcp00::ffff:192.168.10.49:9200:::*LISTEN2476 /java tcp00::ffff:192.168.10.49:9300:::*LISTEN2476 /java 3、测试logstansh和elasticsearch是否能结合使用 a、新建logstansh配置文件elasticsearch.conf 1 2 3 4 5 6 7 [root@ELKServerbin] #cd/usr/local/logstash-2.3.4/conf [root@ELKServerconf] #catelasticsearch.conf input{stdin{}} #手动输入 output{ elasticsearch{hosts=> "192.168.10.49" } stdout{codec=>rubydebug} #页面debug信息 } b、启动elasticsearch.conf配置文件 1 2 3 4 5 6 7 8 9 10 11 12 13 14 15 16 [root@ELKServerconf] #logstash-felasticsearch.conf--verbose startingagent{:level=>:info} startingpipeline{: id => "main" ,:level=>:info} Settings:Defaultpipelineworkers:1 Usingmappingtemplatefrom{:path=>nil,:level=>:info} Attemptingto install template{:manage_template=>{ "template" => "logstash-*" , "settings" =>{ "index.refresh_interval" => "5s" }, "mappings" =>{ "_default_" =>{ "_all" =>{ "enabled" => true , "omit_norms" => true }, "dynamic_templates" =>[{ "message_field" =>{ "match" => "message" , "match_mapping_type" => "string" , "mapping" =>{ "type" => "string" , "index" => "analyzed" , "omit_norms" => true , "fielddata" =>{ "format" => "disabled" }}}},{ "string_fields" =>{ "match" => "*" , "match_mapping_type" => "string" , "mapping" =>{ "type" => "string" , "index" => "analyzed" , "omit_norms" => true , "fielddata" =>{ "format" => "disabled" }, "fields" =>{ "raw" =>{ "type" => "string" , "index" => "not_analyzed" , "ignore_above" =>256}}}}}], "properties" =>{ "@timestamp" =>{ "type" => "date" }, "@version" =>{ "type" => "string" , "index" => "not_analyzed" }, "geoip" =>{ "dynamic" => true , "properties" =>{ "ip" =>{ "type" => "ip" }, "location" =>{ "type" => "geo_point" }, "latitude" =>{ "type" => "float" }, "longitude" =>{ "type" => "float" }}}}}}},:level=>:info} NewElasticsearchoutput{:class=> "LogStash::Outputs::ElasticSearch" ,:hosts=>[ "192.168.10.49" ],:level=>:info} Startingpipeline{: id => "main" ,:pipeline_workers=>1,:batch_size=>125,:batch_delay=>5,:max_inflight=>125,:level=>:info} Pipelinemainstarted helloelasticsearch #这行是手动输入的 { "message" => "helloelasticsearch" , "@version" => "1" , "@timestamp" => "2016-07-28T14:20:09.460Z" , "host" => "0.0.0.0" } c、查看elasticsearch是否获取到了"hello elasticsearch" 1 2 3 4 5 6 7 8 9 10 11 12 13 14 15 16 17 18 19 20 21 22 23 24 25 26 [root@ELKServerconf] #curlhttp://localhost:9200/_search?pretty { "took" :45, "timed_out" : false , "_shards" :{ "total" :5, "successful" :5, "failed" :0 }, "hits" :{ "total" :1, "max_score" :1.0, "hits" :[{ "_index" : "logstash-2016.07.28" , "_type" : "logs" , "_id" : "AVYx4H2BdePMZ0WyBMGl" , "_score" :1.0, "_source" :{ "message" : "helloelasticsearch" , "@version" : "1" , "@timestamp" : "2016-07-28T14:20:09.460Z" , "host" : "0.0.0.0" } }] } } 4、安装elasticsearch插件 elasticsearch有很多插件:http://www.searchtech.pro/elasticsearch-plugins elasticsearch-head插件安装 1 2 3 4 5 6 7 [root@ELKServerlang-expression] #cd/usr/local/elasticsearch-2.3.4/bin/ [root@ELKServerbin] #./plugininstallmobz/elasticsearch-head ->Installingmobz /elasticsearch-head ... Tryinghttps: //github .com /mobz/elasticsearch-head/archive/master .zip... Downloading.................DONE Verifyinghttps: //github .com /mobz/elasticsearch-head/archive/master .zipchecksums if available... Installed head into /usr/local/elasticsearch-2 .3.4 /plugins/head 查看elasticsearch-head插件显示的页面 http://192.168.10.49:9200/_plugin/head/ 四、kibana安装 1、安装kibana 1 2 3 4 [root@ELKServer~] #tar-zxvfkibana-4.5.2-linux-x64.tar.gz [root@ELKServer~] #mvkibana-4.5.2-linux-x64/usr/local/ [root@ELKServer~] #cd/usr/local/kibana-4.5.2-linux-x64/config/ [root@ELKServerconfig] #vimkibana.yml 修改kibana配置文件,把下面这行改成elasticsearc的访问路径 1 elasticsearch.url: "http://192.168.10.49:9200" 2、启动kibana 1 2 3 4 5 6 7 8 9 10 11 12 [root@ELKServerbin] #/usr/local/kibana-4.5.2-linux-x64/bin/kibana& log[23:10:23.215][info][status][plugin:kibana]Statuschangedfromuninitializedtogreen-Ready log[23:10:23.288][info][status][plugin:elasticsearch]Statuschangedfromuninitializedtoyellow-Waiting for Elasticsearch log[23:10:23.344][info][status][plugin:kbn_vislib_vis_types]Statuschangedfromuninitializedtogreen-Ready log[23:10:23.377][info][status][plugin:markdown_vis]Statuschangedfromuninitializedtogreen-Ready log[23:10:23.415][info][status][plugin:metric_vis]Statuschangedfromuninitializedtogreen-Ready log[23:10:23.445][info][status][plugin:spyModes]Statuschangedfromuninitializedtogreen-Ready log[23:10:23.464][info][status][plugin:statusPage]Statuschangedfromuninitializedtogreen-Ready log[23:10:23.485][info][status][plugin:table_vis]Statuschangedfromuninitializedtogreen-Ready log[23:10:23.510][info][listening]Serverrunningathttp: //0 .0.0.0:5601 log[23:10:28.470][info][status][plugin:elasticsearch]Statuschangedfromyellowtoyellow-NoexistingKibanaindexfound log[23:10:31.442][info][status][plugin:elasticsearch]Statuschangedfromyellowtogreen-Kibanaindexready 3、测试kibana 访问页面:http://192.168.10.49:5601/ 五、ELK实例测试 1、简单介绍下ELK的数据传输过程 a、logstansh客户端根据日志存放路径采集日志(input),然后转给redis服务器缓存(output) b、logstansh服务端将消息从redie服务器拿出来(input),然后用filter对日志分割处理 c、logstansh服务端最后将处理好的日志转给ealsticsearch(output)存储 d、kibana通过ealsticsearch接口获取存储的数据并页面展示出来 在测试中我们没有对日志做filter处理 2、新建logstansh配置文件 logstash_redis.conf logstansh客户端配置文件 1 2 3 4 5 6 7 8 9 10 11 12 13 14 15 16 input{ file{ path=> "/var/log/messages" start_position=>beginning sincedb_write_interval=> 0 add_field=>{ "Host" => "192.168.10.47" } type=> "SYSLOG_LOG" } } output{ redis{ host=> "192.168.10.47:6379" data_type=> "list" key=> "logstash:syslog_log" } } redis_elasticserach.conf logstansh服务端配置文件 1 2 3 4 5 6 7 8 9 10 11 12 13 14 15 input{ redis{ host=> '192.168.10.47' data_type=> 'list' port=> "6379" key=> 'logstash:syslog_log' type=> 'redis-input' } } output{ elasticsearch{ hosts=> "192.168.10.47" index=> "logstash-%{+YYYY.MM.dd}" } } 2、启动ELK各项服务 1 2 3 4 5 logstash-flogstash_redis.conf& logstash-fredis_elasticsearch.conf& /etc/init .d /redis_6379 start /usr/local/elasticsearch-2 .3.4 /bin/elasticsearch -d(elk用户启动) /usr/local/kibana-4 .5.2-linux-x64 /bin/kibana & 3、检查日志传输是否正常 a、查看elasticsearch数据信息 http://192.168.10.49:9200/_plugin/head/ b、查看kibana是否有数据显示 http://192.168.10.49:5601/ 注意:因为上面从message获取的日志是日志文件首行开始获取,时间可能是几天前的。 在kibana查看数据是注意选择时间范围 本文转自 irow10 51CTO博客,原文链接:http://blog.51cto.com/irow10/1832053,如需转载请自行联系原作者