常用性能分析命令与工具
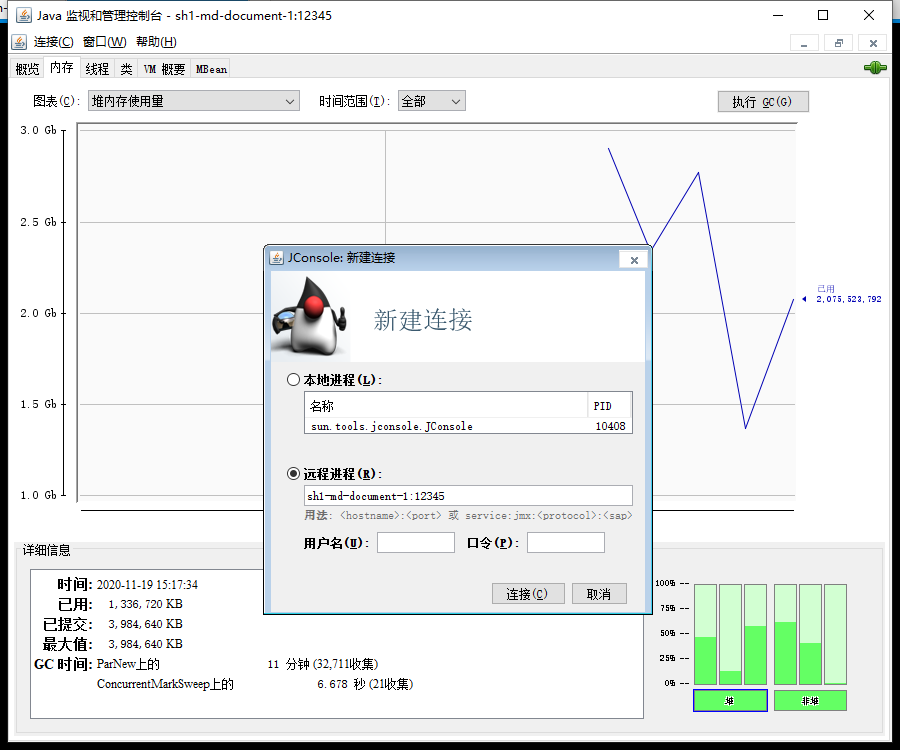
常用命令 jstack 用途 命令参数 用法 jmap 用途 命令参数 用法 jstat 用途 命令参数 用法 netstat 用途 命令参数 用法 常用工具 jconsole 启动使用 查看内存 查看线程 MAT 打开dump文件 Histogram Leak Suspects Dominator Tree Top Comsumers jprofile 启动使用 使用分析 show-busy-java-threads 使用文档 arthas 使用文档 jvisualvm 使用文档 飞行器 使用方法 BTrace 使用文档 常用命令 jstack 用途 jstack能得到运行java程序的java stack和native stack的信息。可以轻松得知当前线程的运行情况。 命令参数 jstack Usage: jstack [-l] <pid> (to connect to running process) jstack -F [-m] [-l] <pid> (to connect to a hung process) jstack [-m] [-l] <executable> <core> (to connect to a core file) jstack [-m] [-l] [server_id@]<remote server IP or hostname> (to connect to a remote debug server) Options: -F to force a thread dump. Use when jstack <pid> does not respond (process is hung) -m to print both java and native frames (mixed mode) -l long listing. Prints additional information about locks -h or -help to print this help message 值得关注的线程状态有: 死锁,Deadlock(重点关注) 执行中,Runnable 等待资源,Waiting on condition(重点关注) 等待获取监视器,Waiting on monitor entry(重点关注) 暂停,Suspended 对象等待中,Object.wait() 或 TIMED_WAITING 阻塞,Blocked(重点关注) 停止,Parked 用法 查看:/usr/bin/jstack -l 11400 导出:/usr/bin/jstack 11400 > thread.txt 统计:/usr/bin/jstack -l 11400 | grep 'Apollo-RemoteConfigRepository-1' | wc -l 输出:1 查看cpu占用高进程: top -H -p 11400 输出:PID USER PR NI VIRT RES SHR S %CPU %MEM TIME+ COMMAND 12029 root 20 0 4396512 813692 8668 S 6.2 10.2 0:05.74 java 12527 root20 0 4396512 813692 8668 S 6.2 10.2 0:41.19 java printf '%x\n' 12029 2efd jstack 11400 | grep 2efd -A 30 输出: "SimplePauseDetectorThread_0" #78 daemon prio=9 os_prio=0 tid=0x00007f664c07c800 nid=0x2efd sleeping[0x00007f662aa37000] java.lang.Thread.State: TIMED_WAITING (sleeping) at java.lang.Thread.sleep(Native Method) at java.lang.Thread.sleep(Thread.java:340) at java.util.concurrent.TimeUnit.sleep(TimeUnit.java:386) at org.LatencyUtils.TimeServices.sleepNanos(TimeServices.java:62) at org.LatencyUtils.SimplePauseDetector$SimplePauseDetectorThread.run(SimplePauseDetector.java:116) "Thread-32" #77 daemon prio=9 os_prio=0 tid=0x00007f664c074800 nid=0x2efc waiting on condition [0x00007f662aa78000] java.lang.Thread.State: WAITING (parking) at sun.misc.Unsafe.park(Native Method) - parking to wait for <0x00000000ed80df78> (a java.util.concurrent.locks.AbstractQueuedSynchronizer$ConditionObject) at java.util.concurrent.locks.LockSupport.park(LockSupport.java:175) at java.util.concurrent.locks.AbstractQueuedSynchronizer$ConditionObject.await(AbstractQueuedSynchronizer.java:2039) at java.util.concurrent.LinkedBlockingQueue.take(LinkedBlockingQueue.java:442) at org.LatencyUtils.PauseDetector$PauseDetectorThread.run(PauseDetector.java:85) "RxIoScheduler-1 (Evictor)" #76 daemon prio=5 os_prio=0 tid=0x00007f66a8735800 nid=0x2eed waiting on condition [0x00007f662acb9000] java.lang.Thread.State: TIMED_WAITING (parking) at sun.misc.Unsafe.park(Native Method) - parking to wait for <0x00000000ed51a578> (a java.util.concurrent.locks.AbstractQueuedSynchronizer$ConditionObject) at java.util.concurrent.locks.LockSupport.parkNanos(LockSupport.java:215) at java.util.concurrent.locks.AbstractQueuedSynchronizer$ConditionObject.awaitNanos(AbstractQueuedSynchronizer.java:2078) at java.util.concurrent.ScheduledThreadPoolExecutor$DelayedWorkQueue.take(ScheduledThreadPoolExecutor.java:1093) at java.util.concurrent.ScheduledThreadPoolExecutor$DelayedWorkQueue.take(ScheduledThreadPoolExecutor.java:809) at java.util.concurrent.ThreadPoolExecutor.getTask(ThreadPoolExecutor.java:1067) at java.util.concurrent.ThreadPoolExecutor.runWorker(ThreadPoolExecutor.java:1127) at java.util.concurrent.ThreadPoolExecutor$Worker.run(ThreadPoolExecutor.java:617) at java.lang.Thread.run(Thread.java:745) "Connection evictor" #75 daemon prio=5 os_prio=0 tid=0x00007f66a8659000 nid=0x2eec waiting on condition [0x00007f662acfa000] jmap 用途 得到运行java程序的内存分配的详细情况,可以生成 java 程序的 dump 文件, 也可以查看堆内对象示例的统计信息、查看 ClassLoader 的信息以及 finalizer 队列。 命令参数 jmap Usage: jmap [option] <pid> (to connect to running process) jmap [option] <executable <core> (to connect to a core file) jmap [option] [server_id@]<remote server IP or hostname> (to connect to remote debug server) where <option> is one of: <none> to print same info as Solaris pmap -heap to print java heap summary -histo[:live] to print histogram of java object heap; if the "live" suboption is specified, only count live objects -clstats to print class loader statistics -finalizerinfo to print information on objects awaiting finalization -dump:<dump-options> to dump java heap in hprof binary format dump-options: live dump only live objects; if not specified, all objects in the heap are dumped. format=b binary format file=<file> dump heap to <file> Example: jmap -dump:live,format=b,file=heap.bin <pid> -F force. Use with -dump:<dump-options> <pid> or -histo to force a heap dump or histogram when <pid> does not respond. The "live" suboption is not supported in this mode. -h | -help to print this help message -J<flag> to pass <flag> directly to the runtime system 用法 查看进程的内存映像信息:jmap 11400 输出:Attaching to process ID 11400, please wait... Debugger attached successfully. Server compiler detected. JVM version is 25.121-b13 0x0000000000400000 7K /usr/java/jdk1.8.0_121/jre/bin/java 0x00007f664832e000 250K /usr/java/jdk1.8.0_121/jre/lib/amd64/libsunec.so 0x00007f6684bfe000 66K /usr/lib64/libbz2.so.1.0.6 0x00007f6684e0e000 153K /usr/lib64/liblzma.so.5.2.2 0x00007f6685034000 88K /usr/lib64/libz.so.1.2.7 0x00007f668524a000 97K /usr/lib64/libelf-0.166.so 0x00007f6685462000 19K /usr/lib64/libattr.so.1.1.0 0x00007f6685667000 86K /usr/lib64/libgcc_s-4.8.5-20150702.so.1 0x00007f668587d000 294K /usr/lib64/libdw-0.166.so 0x00007f6685ac5000 19K /usr/lib64/libcap.so.2.22 0x00007f6685cca000 107K /usr/lib64/libresolv-2.17.so 0x00007f6685ee4000 30K /usr/lib64/libnss_dns-2.17.so 0x00007f66862eb000 90K /usr/java/jdk1.8.0_121/jre/lib/amd64/libnio.so 0x00007f6687be0000 113K /usr/java/jdk1.8.0_121/jre/lib/amd64/libnet.so 0x00007f6687df7000 49K /usr/java/jdk1.8.0_121/jre/lib/amd64/libmanagement.so 0x00007f66c8000000 64K /usr/lib64/libnss_myhostname.so.2 0x00007f66c9bc1000 121K /usr/java/jdk1.8.0_121/jre/lib/amd64/libzip.so 0x00007f66c9ddc000 60K /usr/lib64/libnss_files-2.17.so 0x00007f66c9fef000 48K /usr/java/jdk1.8.0_121/jre/lib/amd64/libinstrument.so 0x00007f66ca1f9000 220K /usr/java/jdk1.8.0_121/jre/lib/amd64/libjava.so 0x00007f66ca425000 64K /usr/java/jdk1.8.0_121/jre/lib/amd64/libverify.so 0x00007f66ca633000 42K /usr/lib64/librt-2.17.so 0x00007f66ca83b000 1110K /usr/lib64/libm-2.17.so 0x00007f66cab3d000 16591K /usr/java/jdk1.8.0_121/jre/lib/amd64/server/libjvm.so 0x00007f66cbb2f000 2105K /usr/lib64/libc-2.17.so 0x00007f66cbefd000 18K /usr/lib64/libdl-2.17.so 0x00007f66cc101000 99K /usr/java/jdk1.8.0_121/jre/lib/amd64/jli/libjli.so 0x00007f66cc317000 138K /usr/lib64/libpthread-2.17.so 0x00007f66cc533000 159K /usr/lib64/ld-2.17.so 显示Java堆详细信息:jmap -heap 11400 输出:Attaching to process ID 11400, please wait... Debugger attached successfully. Server compiler detected. JVM version is 25.121-b13 using parallel threads in the new generation. using thread-local object allocation. Concurrent Mark-Sweep GC Heap Configuration: MinHeapFreeRatio = 40 MaxHeapFreeRatio = 70 MaxHeapSize = 536870912 (512.0MB) NewSize = 134217728 (128.0MB) MaxNewSize = 134217728 (128.0MB) OldSize = 402653184 (384.0MB) NewRatio = 2 SurvivorRatio = 8 MetaspaceSize = 21807104 (20.796875MB) CompressedClassSpaceSize = 1073741824 (1024.0MB) MaxMetaspaceSize = 268435456 (256.0MB) G1HeapRegionSize = 0 (0.0MB) Heap Usage: New Generation (Eden + 1 Survivor Space): capacity = 120848384 (115.25MB) used = 66229472 (63.161346435546875MB) free = 54618912 (52.088653564453125MB) 54.80377131066974% used Eden Space: capacity = 107479040 (102.5MB) used = 63536296 (60.592933654785156MB) free = 43942744 (41.907066345214844MB) 59.11505722418064% used From Space: capacity = 13369344 (12.75MB) used = 2693176 (2.5684127807617188MB) free = 10676168 (10.181587219238281MB) 20.144413966758577% used To Space: capacity = 13369344 (12.75MB) used = 0 (0.0MB) free = 13369344 (12.75MB) 0.0% used concurrent mark-sweep generation: capacity = 402653184 (384.0MB) used = 176729160 (168.54206085205078MB) free = 225924024 (215.45793914794922MB) 43.89116168022156% used 显示堆中对象的统计信息:/usr/bin/jmap -histo:live 11400 | head -20 输出: num #instances #bytes class name ---------------------------------------------- 1: 273268 29359760 [C 2: 337511 10800352 java.util.concurrent.ConcurrentHashMap$Node 3: 217704 10449792 org.aspectj.weaver.reflect.ShadowMatchImpl 4: 116214 10226832 java.lang.reflect.Method 5: 217712 6966784 org.aspectj.weaver.patterns.ExposedState 6: 69225 6647552 [Ljava.lang.Object; 7: 271133 6507192 java.lang.String 8: 12598 6112856 [B 9: 1479 3026296 [Ljava.util.concurrent.ConcurrentHashMap$Node; 10: 50114 2806384 java.util.LinkedHashMap 11: 24799 2751976 java.lang.Class 12: 66869 2674760 java.util.LinkedHashMap$Entry 13: 34280 2507280 [Ljava.util.HashMap$Node; 14: 11273 2043680 [I 15: 78910 1932576 [Z 16: 60015 1920480 java.util.HashMap$Node 17: 78497 1883920 [Lorg.aspectj.weaver.ast.Var; 生成堆转储快照dump文件: jmap -dump:live,format=b,file=/tmp/heap.hprof 11400 输出:Dumping heap to /tmp/heap.hprof ... Heap dump file created jstat 用途 监视虚拟机各种运行状态信息的命令行工具,查看堆内存各部分的使用量,以及加载类的数量 命令参数 jstat Usage: jstat -help|-options jstat -<option> [-t] [-h<lines>] <vmid> [<interval> [<count>]] Definitions: <option> An option reported by the -options option <vmid> Virtual Machine Identifier. A vmid takes the following form: <lvmid>[@<hostname>[:<port>]] Where <lvmid> is the local vm identifier for the target Java virtual machine, typically a process id; <hostname> is the name of the host running the target Java virtual machine; and <port> is the port number for the rmiregistry on the target host. See the jvmstat documentation for a more complete description of the Virtual Machine Identifier. <lines> Number of samples between header lines. <interval> Sampling interval. The following forms are allowed: <n>[ "ms" | "s" ] Where <n> is an integer and the suffix specifies the units as milliseconds( "ms" ) or seconds( "s" ). The default units are "ms" . <count> Number of samples to take before terminating. -J<flag> Pass <flag> directly to the runtime system. 用法 查看垃圾回收:jstat -gcutil 11400 1000 5 输出: S0 S1 E O M CCS YGC YGCT FGC FGCT GCT 0.00 16.15 33.06 35.11 94.91 92.76 507 11.471 10 2.549 14.019 0.00 16.15 34.19 35.11 94.91 92.76 507 11.471 10 2.549 14.019 0.00 16.15 34.30 35.11 94.91 92.76 507 11.471 10 2.549 14.019 0.00 16.15 34.51 35.11 94.91 92.76 507 11.471 10 2.549 14.019 0.00 16.15 35.63 35.11 94.91 92.76 507 11.471 10 2.549 14.019 O:老年代使用比例 M:元数据区使用比例 CCS:压缩使用比例 YGC:年轻代垃圾回收次数 FGCT:老年代垃圾回收消耗时间(单位:s秒) GCT:垃圾回收消耗总时间(单位:s秒) netstat 用途 用于显示与IP、TCP、UDP和ICMP协议相关的统计数据,一般用于检验本机各端口的网络连接情况 命令参数 netstat usage: netstat [-vWeenNcCF] [<Af>] -r netstat {-V|--version|-h|--help} netstat [-vWnNcaeol] [<Socket> ...] netstat { [-vWeenNac] -I[<Iface>] | [-veenNac] -i | [-cnNe] -M | -s [-6tuw] } [delay] -r, --route display routing table -I, --interfaces=<Iface> display interface table for <Iface> -i, --interfaces display interface table -g, --groups display multicast group memberships -s, --statistics display networking statistics (like SNMP) -M, --masquerade display masqueraded connections -v, --verbose be verbose -W, --wide don't truncate IP addresses -n, --numeric don't resolve names --numeric-hosts don't resolve host names --numeric-ports don't resolve port names --numeric-users don't resolve user names -N, --symbolic resolve hardware names -e, --extend display other/more information -p, --programs display PID/Program name for sockets -o, --timers display timers -c, --continuous continuous listing -l, --listening display listening server sockets -a, --all display all sockets ( default : connected) -F, --fib display Forwarding Information Base ( default ) -C, --cache display routing cache instead of FIB -Z, --context display SELinux security context for sockets <Socket>={-t|--tcp} {-u|--udp} {-U|--udplite} {-S|--sctp} {-w|--raw} {-x|--unix} --ax25 --ipx --netrom <AF>=Use '-6|-4' or '-A <af>' or '--<af>' ; default : inet List of possible address families (which support routing): inet (DARPA Internet) inet6 (IPv6) ax25 (AMPR AX. 25 ) netrom (AMPR NET/ROM) ipx (Novell IPX) ddp (Appletalk DDP) x25 (CCITT X. 25 ) 用法 显示网卡列表:netstat -i 输出: Kernel Interface table Iface MTU RX-OK RX-ERR RX-DRP RX-OVR TX-OK TX-ERR TX-DRP TX-OVR Flg eth0 1500 127092481 0 2325462 0 90637447 0 0 0 BMRU lo 65536 275564 0 0 0 275564 0 0 0 LRU 显示网络统计:netstat -lntup 输出: Active Internet connections (only servers) Proto Recv-Q Send-Q Local Address Foreign Address State PID/Program name tcp 0 0 0.0.0.0:9039 0.0.0.0:* LISTEN 11400/java tcp 0 0 0.0.0.0:9999 0.0.0.0:* LISTEN 11400/java tcp 0 0 0.0.0.0:9071 0.0.0.0:* LISTEN 15250/java tcp 0 0 0.0.0.0:9072 0.0.0.0:* LISTEN 4078/java tcp 0 0 0.0.0.0:9073 0.0.0.0:* LISTEN 4586/java tcp 0 0 0.0.0.0:50001 0.0.0.0:* LISTEN 4586/java tcp 0 0 0.0.0.0:9078 0.0.0.0:* LISTEN 13131/java tcp 0 0 0.0.0.0:22 0.0.0.0:* LISTEN 815/sshd tcp 0 0 0.0.0.0:8087 0.0.0.0:* LISTEN 28760/java tcp 0 0 0.0.0.0:10072 0.0.0.0:* LISTEN 4078/java tcp 0 0 0.0.0.0:7071 0.0.0.0:* LISTEN 1453/java tcp 0 0 0.0.0.0:7072 0.0.0.0:* LISTEN 32059/java tcp 0 0 0.0.0.0:9088 0.0.0.0:* LISTEN 24501/java tcp 0 0 0.0.0.0:10050 0.0.0.0:* LISTEN 795/zabbix_agentd tcp 0 0 0.0.0.0:16869 0.0.0.0:* LISTEN 1453/java tcp6 0 0 :::22 :::* LISTEN 815/sshd tcp6 0 0 :::10050 :::* LISTEN 795/zabbix_agentd udp 0 0 127.0.0.1:323 0.0.0.0:* 499/chronyd udp6 0 0 ::1:323 :::* 499/chronyd 统计机器中网络连接各个状态个数:netstat -anc | grep 9092 输出: tcp 0 0 172.16.20.142:40464 172.16.20.60:9092 ESTABLISHED tcp 0 0 172.16.20.142:52536 172.16.20.60:9092 ESTABLISHED tcp 0 0 172.16.20.142:58202 172.16.20.60:9092 ESTABLISHED tcp 0 0 172.16.20.142:41314 172.16.20.60:9092 ESTABLISHED tcp 0 0 172.16.20.142:40826 172.16.20.60:9092 ESTABLISHED tcp 0 0 172.16.20.142:41150 172.16.20.60:9092 ESTABLISHED tcp 0 0 172.16.20.142:54978 172.16.20.60:9092 ESTABLISHED 找出程序运行的端口:netstat -ap | grep 11400 输出: tcp 0 0 0.0.0.0:9039 0.0.0.0:* LISTEN 11400/java tcp 0 0 0.0.0.0:distinct 0.0.0.0:* LISTEN 11400/java tcp 0 0 ext-spring-md-sho:55364 work-arch-lb-1:6379 ESTABLISHED 11400/java tcp 0 0 ext-spring-md-sho:54114 db-work-01:ms-sql-s ESTABLISHED 11400/java tcp 0 0 ext-spring-md-sho:45768 172.16.20.1:amqp ESTABLISHED 11400/java tcp 0 0 ext-spring-md-sho:49960 172.16.20.1:ms-sql-s ESTABLISHED 11400/java tcp 0 0 ext-spring-md-sho:49932 172.16.20.1:ms-sql-s ESTABLISHED 11400/java tcp 0 0 ext-spring-md-sho:49954 172.16.20.1:ms-sql-s ESTABLISHED 11400/java tcp 0 0 ext-spring-md-sho:47498 172.16.20.38:eforward ESTABLISHED 11400/java tcp 0 0 ext-spring-md-sho:49946 172.16.20.1:ms-sql-s ESTABLISHED 11400/java tcp 0 0 ext-spring-md-sho:49970 172.16.20.1:ms-sql-s ESTABLISHED 11400/java tcp 0 0 ext-spring-md-sho:54616 st-arch-polari:webcache ESTABLISHED 11400/java tcp 0 0 ext-spring-md-sho:49964 172.16.20.1:ms-sql-s ESTABLISHED 11400/java tcp 0 0 ext-spring-md-sho:49968 172.16.20.1:ms-sql-s ESTABLISHED 11400/java tcp 0 0 ext-spring-md-sho:54144 db-work-01:ms-sql-s ESTABLISHED 11400/java tcp 0 0 ext-spring-md-sho:54112 db-work-01:ms-sql-s ESTABLISHED 11400/java tcp 0 0 ext-spring-md-sho:54096 db-work-01:ms-sql-s ESTABLISHED 11400/java tcp 0 0 ext-spring-md-sho:40826 172.16.20.:XmlIpcRegSvc ESTABLISHED 11400/java tcp 1 0 ext-spring-md-sho:41072 172.16.20.168:mysql CLOSE_WAIT 11400/java tcp 0 0 ext-spring-md-sho:49956 172.16.20.1:ms-sql-s ESTABLISHED 11400/java tcp 0 0 ext-spring-md-sho:49966 172.16.20.1:ms-sql-s ESTABLISHED 11400/java tcp 0 0 ext-spring-md-sho:54098 db-work-01:ms-sql-s ESTABLISHED 11400/java 常用工具 jconsole 启动使用 应用启动参数:-Djava.rmi.server.hostname=xxxxx -Dcom.sun.management.jmxremote -Dcom.sun.management.jmxremote.authenticate=false -Dcom.sun.management.jmxremote.ssl=false -Dcom.sun.management.jmxremote.port=12345 点击JDK/bin 目录下面的jconsole.exe即可启动 查看内存 查看线程 MAT 打开dump文件 Histogram Class Name : 类名称,java类名 Objects : 类的对象的数量,这个对象被创建了多少个 Shallow Heap :一个对象内存的消耗大小,不包含对其他对象的引用 Retained Heap :是shallow Heap的总和,也就是该对象被GC之后所能回收到内存的总和 在某一项上右键打开菜单选择 list objects ->with incoming refs 将列出该类的实例 快速找出某个实例没被释放的原因,可以右健 Path to GC Roots–>exclue all phantom/weak/soft etc. reference : Leak Suspects 自动分析内存内存泄漏的原因,可以直接定位到Class,且行数 Dominator Tree 列出线程的树结构,及线程下面对象占用内存的空间 Top Comsumers 通过图型列出最大的Object jprofile 启动使用 在被分析的jvm 的启动参数增加下面内容:-agentpath:/opt/jprofiler11/bin/linux-x64/libjprofilerti.so=port=8849 点击jprofiler.exe 执行菜单Session–Integr ation Wizards–New Server Integration 选择JDK 选择Web容器是否和Jprofiler一起运行 输入服务器地址,在服务器上执行jpenable /usr/local/bin/jpenable Select a JVM: ext-service-md-car-check-analysis.jar [10125] [1] Please select the profiling mode: GUI mode (attach with JProfiler GUI) [1, Enter] Offline mode (use config file to set profiling settings) [2] Please enter a profiling port [45763] 8849 You can now use the JProfiler GUI to connect on port 8849 选择安装目录 端口号指定 使用分析 接入 overview: cpu views:可录像回放 show-busy-java-threads 使用文档 https://github.com/oldratlee/useful-scripts/blob/master/docs/java.md#-show-busy-java-threads arthas 使用文档 https://arthas.aliyun.com/doc/ jvisualvm 使用文档 https://docs.oracle.com/javase/8/docs/technotes/guides/visualvm/index.html JFR(飞行器) 使用方法 创建一个包含了你自己配置的JFR模板文件。运行jmc, 然后Window->Flight Recording Template Manage菜单。准备好档案后,就可以导出文件,并移动到要排查问题的环境中。 由于JFR需要JDK的商业证书,这一步需要解锁jdk的商业特性。 C:\Users\lenovo>jcmd 8152 VM.unlock_commercial_features,或者在JVM的启动参数中增加如下参数: -XX:+UnlockCommercialFeatures -XX:+FlightRecorder 启动JFR 一分钟后可查看记录数据,通过这些数据,可以清楚的了解到这一分钟时间内,整个 BTrace 使用文档 https://github.com/btraceio/btrace