前沿科技探究之AI工具:Anomaly-detection
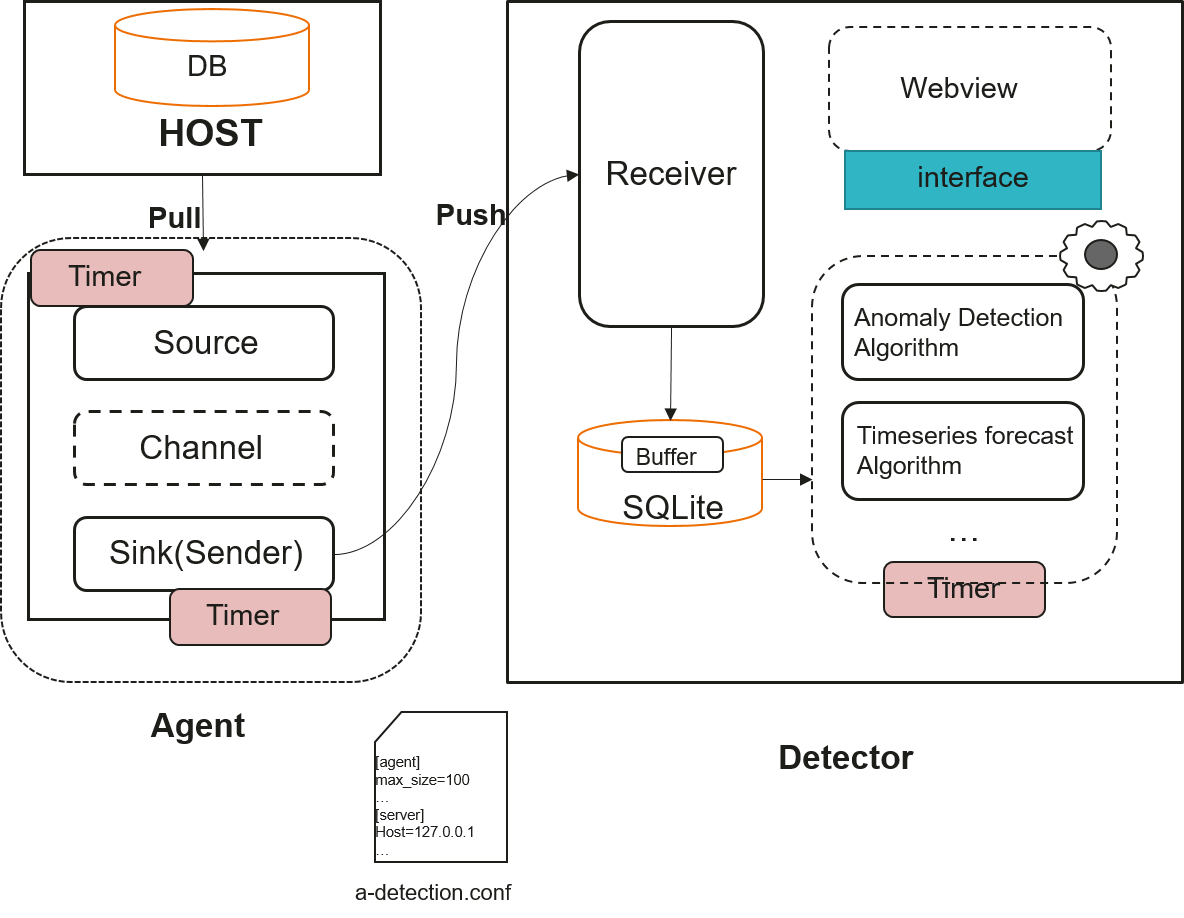
概述 anomaly_detection是openGauss集成的、可以用于数据库指标采集、预测指标趋势变化、慢SQL根因分析以及异常监控与诊断的AI工具,是DBMind套间中的一个组件。支持采集的信息分为三块,分别是os_exporter、database_exporter、wdr,os_exporter主要包括IO_Read、IO_Write、IO_Wait、CPU_Usage、Memory_Usage、数据库数据目录磁盘空间占用Disk_space;database_exporter主要包括QPS、部分关键GUC参数(work_mem、shared_buffers、max_connections)、数据库临时文件、外部进程情况、外部连接数;wdr包括慢SQL文本、SQL开始执行时间、SQL结束执行时间相关信息。在异常监控方面,anomaly_detection可以同时对IO_Read、IO_Write、IO_Wait、CPU_Usage、Memory_Usage和Disk_Space多个指标的未来变化趋势进行预测,当发现某个指标在未来某段时间或者某个时刻会超出人工设置的阈值,该工具会通过日志进行报警。在慢SQL根因分析方面,工具会定期从WDR报告中拉取慢SQL信息,并对慢SQL的根因进行诊断,最后将诊断结果存放到日志文件中,同时该工具还支持用户交互式慢SQL诊断,即对用户输入的慢SQL进行根因分析,并将结果反馈给用户。 anomaly_detection由agent和detector两大模块组成。agent和openGauss数据库环境部署在同一个服务器上,该模块主要有两个作用。一个是定时采集数据库指标数据,并将采集到的数据存放到缓冲队列中;另一个作用是将缓冲队列中数据定时发送到detector的collector子模块中。 detector模块由collector模块和monitor模块组成,collector模块和agent模块通过http或https进行通信,接受agent模块push的数据并存储到本地。monitor模块基于本地数据对指标的未来变化趋势进行预测和异常报警,另外结合系统和WDR报告等各种相关联信息,分析慢SQL的根因。 使用准备 前提条件与使用事项 数据库状态正常。 工具运行过程中,如果系统时间被篡改,可能会造成慢SQL数据采集失效。 工具不支持在备节点上采集。 使用登录到数据库宿主机上的Linux用户,需要将$GAUSSHOME/bin添加到PATH环境变量中,即能够直接运行gsql、gs_guc、gs_ctl等数据库运维工具。 Python版本建议为Python3.6及以上,且运行环境中已经安装相应依赖,并能够正常启动调优程序。 本工具由Agent和Detector组成,Agent和Detector之间通过’http’或者’https’方式传递数据,因此需要保证Agent服务器和Detector服务器之间能够正常通信。 Detector模块运行collector和monitor服务, 需要分别启动。 如果使用’https’方式进行通信,需要准备CA证书以及Agent和Detector的证书和密钥,并分别放入项目根目录certificate下的ca、agent、collector中,同时将密钥加密密码放入certificate的pwf中,并将其权限设置为600,防止其他用户进行读写操作。用户也可以使用share中的脚本生成证书和密钥。 建议用户配置自己的python环境,以免影响其他功能使用(例如使用miniconda)。 慢SQL的根因分析功能需要WDR报告,用户需要开启track_stmt_stat_level=‘OFF,L1’, log_min_duration_statement=3000(慢SQL阈值,用户可按需设定),单位ms。 如果将detecor和数据库部署在同一服务器上,则collector服务端口不能和数据库本地端口相同,否则将无法启动进程。 原理简介 图1 anomaly_detection结构图 anomaly_detection是一个独立于数据库内核之外的工具,其结构如图1所示,anomaly_detection主要由agent和detector模块组成; agent:数据代理模块,由Source、Channel以及Sink组成。部署在数据库环境上,用于采集数据库中的指标,并通过http或者https方式将其传送给远端检测器模块。 detector:检测器模块,负责收集Agent推送的数据并存储,同时该模块基于时序预测和异常检测等算法对数据库指标进行监控和异常检测,同时提供慢SQL根因服务功能。 anomaly_detection的运行和安装方法 1、切换到anomaly_detection目录下。对于openGauss社区代码来说,该路径在openGauss-server/src/gausskernel/dbmind/tools/anomaly_detection。对于已经安装的数据库系统,则该源代码路径为 $GAUSSHOME/bin/dbmind/anomaly_detection。 2、 在当前目录下可以看到 requirements.txt 等文件,通过pip包管理工具根据该 requirements.txt 文件安装依赖: pip install -r requirements.txt 3、 安装成功后可执行main.py。以获取帮助信息为例,则可以执行: python main.py --help # 可以直接通过该命令执行获取帮助的动作,其他功能使用方法类似 证书生成 证书生成当使用https方式进行通信时,需要用户提供证书,anomaly_detection也提供了证书生成工具。 生成CA根证书,在anomaly_detection的share目录下,执行以下命令: sh gen_ca_certificate.sh 该脚本会在anomaly_detection根目录下创建certificate目录,其中包括ca、server、agent三个子目录,ca中存放根证书ca.crt和密钥文件ca.key。 生成server端证书和密钥文件,在anomaly_detection的share目录下,执行以下命令: sh gen_certificate.sh # please input the basename of ssl certificate: ../certificate/server # please input the filename of ssl certificate: server # please input the local host: 127.0.0.1 # please input the password of ca and ssl separated by space: 该脚本需要用户分别输入生成证书与密钥文件存放目录、证书与密钥文件名称、detector端服务器IP地址、ca证书密码和当前证书密码(用空格分开)。脚本最后会在certificate的server下生成server.crt和server.key。 1、生成agent端证书密钥和文件,在anomaly_detection的share目录下,执行以下命令: sh gen_certificate.sh # please input the basename of ssl certificate: ../certificate/agent # please input the filename of ssl certificate: agent # please input the local host: 127.0.0.1 # please input the password of ca and ssl separated by space: 该脚本需要用户分别输入生成证书与密钥文件存放目录、证书与密钥文件名称、agent端服务器IP地址、ca证书密码和当前证书密码(用空格分开)。脚本最后会在certificate的agent下生成agent.crt和agent.key。 anomaly_detection的配置文件说明 anomaly_detection 在运行前需要加载a-detection.conf和metric_task.conf两个配置文件,可以通过 python main.py –help 命令查看配置文件路径: a-detection.conf:该配置文件包含agent、server、database、security、forecast、log六个section,参数解释如下: [database] storage_duration = 12H # 数据存储时间长度,默认12小时 database_dir = ./data # 数据存储目录 [security] tls = False ca = ./certificate/ca/ca.crt server_cert = ./certificate/server/server.crt server_key = ./certificate/server/server.key agent_cert = ./certificate/agent/agent.crt agent_key = ./certificate/agent/agent.key [server] host = 0.0.0.0 # 服务端IP地址 listen_host = 0.0.0.0 listen_port = 8080 white_host = 0.0.0.0 # IP白名单 white_port = 8000 # 端口号白名单 [agent] source_timer_interval = 10S # agent端数据采集频率 sink_timer_interval = 10S # agent端数据发送频率 channel_capacity = 1000 # 缓冲队列最大长度 db_host = 0.0.0.0 # agent节点IP地址 db_port = 8080 # agent节点端口号 db_type = single # agent节点类型, single: 单机,cn: CN节点、dn: DN节点 [forecast] forecast_alg = auto_arima # 时序预测算法,auto_arima、fbprophet(需要用户自行安装) [log] log_dir = ./log # 日志文件位置 metric_task.conf: 该配置文件包括detector method, os_expoeterhe trend_parameter三个sections,参数结束如下: [detector_method] trend = os_exporter # 用于时序预测的表名 slow_sql = wdr # 用户慢SQL诊断的表名 [os_exporter] cpu_usage_minimum = 1 # cpu_usage的下限值 cpu_usage_maximum = 10 # cpu_usage的上限值 memory_usage_minimum = 1 # memory_usage的下限值 memory_usage_maximum = 10 # memory_usage的上限值 io_read_minimum = 1 io_read_maximum = 10 io_write_minimum = 1 io_write_maximum = 10 io_wait_minimum = 1 io_wait_maximum = 10 disk_space_minimum = 1 disk_space_maximum = 10 [common_parameter] data_period = 1000S # 是用于时序预测的历史数据长度,支持整数加时间单位(如:100S、2M、10D)。 interval = 20S # 监控间隔 freq = 3S # 趋势预测频率 period = 2 # 趋势预测长度 说明: - 支持的时间单位: ‘S’:second,秒。 ‘M’:minute,分。 ‘H’:hour,小时。 ‘D’:day,天。 ‘W’:week,周。 minimum和maximum至少提供一个,不能都不提供。 freq和period共同决定时序预测结果,例子:freq=2S,period=5, 则会预测未来2S、4S、6S、8S、10S的值。 建议参数配置的时候,保证训练数据长度大于预测长度,否则预测效果会受影响。 添加监控参数 工具只针对os_exporter中的指标进行趋势预测与阈值异常检测,支持用户添加新的监控参数,步骤如下: 1、在task/os_exporter.py的OS_exporter中编写获取指标的功能函数,并将该函数加入到output的result列表中,例如: @staticmethod def new_metric(): return metric_value def output(self): result = [self.cpu_usage(), self.io_wait(), self.io_read(), self.io_write(), self.memory_usage(), self.disk_space(), self.new_metric()] return result 2、在table.json的os_exporter中,将new_metric字段加入到“create table“中,并在“insert”中加上字段类型信息,例如: "os_exporter": { "create_table": "create table os_exporter(timestamp bigint, cpu_usage text, io_wait text, io_read text, io_write text, memory_usage text, disk_space text, new_metric text);", "insert": "insert into os_exporter values(%d, \"%s\", \"%s\", \"%s\", \"%s\", \"%s\", \"%s\", \"%s\");", 3、在task/metric_task.conf中添加指标的上限值或者下限值,例如: [os_exporter] new_metric_minimum = 0 new_metric_maximum = 10 获取帮助 启动调优程序之前,可以通过如下命令获取帮助信息: 源码方式:python main.py --help 输出帮助信息结果如下: usage: python main.py start [--role { {agent,collector,monitor}}] # start local service. python main.py stop [--role { {agent,collector,monitor}}] # stop local service. python main.py start [--user USER] [--host HOST] [--project-path PROJECT_PATH] [--role { {agent,collector,monitor}}] # start the remote service. python main.py stop [--user USER] [--host HOST] [--project-path PROJECT_PATH] [--role { {agent,collector, monitor}}] # stop the remote service. python main.py deploy [--user USER] [--host HOST] [--project-path PROJECT_PATH] # deploy project in remote host. python main.py diagnosis [--query] [--start_time] [--finish_time] # rca for slow SQL. python main.py show_metrics # display all monitored metrics(can only be executed on 'detector' machine). python main.py forecast [--metric-name METRIC_NAME] [--period] [--freq] [--forecast-method { {auto_arima, fbprophet}}] [--save-path SAVE_PATH] # forecast future trend of metric(can only be executed on 'detector' machine). Anomaly-detection: a time series forecast and anomaly detection tool. positional arguments: {start,stop,deploy,show_metrics,forecast,diagnosis} optional arguments: -h, --help show this help message and exit --user USER User of remote server. --host HOST IP of remote server. --project-path PROJECT_PATH Project location in remote server. --role {agent,collector,monitor} Run as 'agent', 'collector', 'monitor'. Notes: ensure the normal operation of the openGauss in agent. --metric-name METRIC_NAME Metric name to be predicted, you must provide an specified metric name. . --query QUERY target sql for RCA. Currently, the join operator is not supported, and the accuracy of the result is not guaranteed for SQL syntax containing "not null and". --start_time START_TIME start time of query --finish_time FINISH_TIME finish time of query --period PERIOD Forecast periods of metric, it should be integernotes: the specific value should be determined to the trainnig data.if this parameter is not provided, the default value '100S' will be used. --freq FREQ forecast gap, time unit: S: Second, M: Minute, H: Hour, D: Day, W: Week. --forecast-method FORECAST_METHOD Forecast method, default method is 'auto_arima',if want to use 'fbprophet', you should install fbprophet first. --save-path SAVE_PATH Save the results to this path using csv format, if this parameter is not provided,, the result wil not be saved. -v, --version show program's version number and exit epilog: the 'a-detection.conf' and 'metric_task.conf' will be read when the program is running, the location of them is: a-detection.conf: /openGauss-server/src/gausskernel/dbmind/tools/anomaly_detection/a-detection.conf. metric_config: /openGauss-server/src/gausskernel/dbmind/tools/anomaly_detection/task/metric_task.conf. 使用示例 为了方便用户理解部署过程,假设当前数据库节点信息如下: IP: 10.90.110.130 PORT: 8000 type: single detector服务器信息: IP: 10.90.110.131 listen_host = 0.0.0.0 listen_port = 8080 部署的启动流程如下: 配置文件修改 首先需要更改配置文件 a-detection.conf,主要涉及其中的两个session: [database] storage_duration = 12H # 数据存储时间长度,默认12小时 database_dir = ./data # 数据存储目录 [security] tls = False ca = ./certificate/ca/ca.crt server_cert = ./certificate/server/server.crt server_key = ./certificate/server/server.key agent_cert = ./certificate/agent/agent.crt agent_key = ./certificate/agent/agent.key [server] host = 10.90.110.131 listen_host = 0.0.0.0 listen_port = 8080 white_host = 10.90.110.130 white_port = 8000 [agent] source_timer_interval = 10S sink_timer_interval = 10S channel_capacity = 1000 db_host = 10.90.110.130 db_port = 8080 db_type = single [forecast] forecast_alg = auto_arima [log] log_dir = ./log 服务启动与停止 启动本地agent服务: python main.py start --role agent 停止本地agent服务: python main.py stop --role agent 启动本地collector服务: python main.py start --role collector 停止本地collector服务: python main.py stop --role collector 启动本地monitor服务: python main.py start --role monitor 停止本地monitor服务: python main.py stop --role monitor 命令参考 表 1 命令行参数 参数 参数说明 取值范围 mode 指定运行模式 start,stop,forecast,show_metrics,deploy,diagnosis –user 远程服务器用户 - –host 远程服务器IP - –project-path 远程服务器anomaly_detection项目路径 - –role 启动角色选择 agent,collector,monitor –metric-name 指标名称 - –query 根因分析RCA目标query - –start_time query执行的开始时间 - –finish_time query执行的结束时间 - –forecast-periods 未来预测周期 整数,具体值应该根据training数据决定。如果未提供此参数,则将使用默认值“100S”。 –freq FREQ 预测间隔 时间单位,包括(S(second),M(minute),H(hour),D(day),W(week))。 –forecast-method 预测方法 auto_arima, fbprophet –save-path 预测结果存放地址 - –version, -v 返回当前工具版本号 - AI_SERVER ai_server为anomaly_detection特性的分离特性,在原anomaly_detection数据采集功能的基础上增加了采集类型、采集项、数据存储模式,仅用于数据采集,后续将整合到anomaly_detection中,该特性主要包含server组件和agent组件,agent须部署到数据库节点,用于数据采集,server部署在独立节点进行数据收集存储。 数据存储方式包括:sqlite、mongodb、influxdb。 采集项如表1: 表 1 采集项说明 采集类型:database 采集项 描述 work_mem 数据库内存相关GUC参数,对涉及到排序任务的sql,检测分配的空间是否足够。 shared_buffers 数据库内存相关GUC参数,不合适的shared_buffer会导致数据库性能变差。 max_connections 数据库最大连接数。 current connections 数据库当前连接数。 qps 数据库性能指标。 采集类型:OS 采集项 描述 cpu usage cpu使用率。 memory usage 内存使用率。 io wait 系统因为io导致的进程wait。 io write 数据磁盘写吞吐量。 io read 数据磁盘读吞吐量。 disk used 磁盘已使用的大小。 AI_MANAGER ai_manager是AI特性部署工具,旨在为ai特性提供自动化、高效便捷的部署及卸载方式,可通过指定模块名称、操作类型及参数文件进行相应ai特性的自动化部署和卸载,实现了版本管理、操作日志记录及日志管理、安装信息记录等功能,支持特性级横向扩展,该工具目前仅支持ai_server的安装及卸载。 使用准备 项目部署路径为/dbs/AI-tools,需保证该路径存在并有读写执行权限,安装/卸载操作中会清理该路径下的内容,不要将其它文件保存在该路径下。 需要安装python3环境及特性所需python库,依赖库请参考包内的requirements.txt文件。 如开启https,需准备相应的根证书,秘钥文件及密码。 agent节点已启动GaussDB Kernel数据库。 安装agent节点须使用集群用户操作。 如果agent节点集群用户的~/.bashrc文件中没有正确的PGHOST配置,需要将PGHOST配置到/dbs/AI-tools/ai_env文件中。 示例 安装命令示例: python3 ai_manager --module anomaly_detection --action install --param_file opengauss.json 卸载命令示例: python3 ai_manager --module anomaly_detection--action uninstall --param_file opengauss.json 参数文件示例: { "scene": "opengauss", # 场景,openGauss安装server及agent,huaweiyun仅安装server "module": "anomaly_detection", # 模块(特性)名称,目前仅支持anomaly_detection "action": "install", # 操作类型,支持install及uninstall "ca_info": { "ca_cert_path": "/home/Ruby/CA_AI/ca.crt", # 根证书路径 "ca_key_path": "/home/Ruby/CA_AI/ca.crt.key", # 根证书秘钥路径 "ca_password": "GHJAyusa241~" # 根证书密码 }, "agent_nodes": [ { "node_ip": "10.000.00.000", # agent节点IP "username": "Ruby", # agent节点用户 "password": "password" # agent节点密码 } ], "config_info": { "server": { "host": "10.000.00.000", # server部署节点IP(执行节点) "listen_host": "0.0.0.0", # server 监听IP "listen_port": "20060", # server 监听端口 "pull_kafka": "False" # 是否拉取kafka数据,暂不支持拉取。 }, "database": { "name": "sqlite", # 数据存储方式,支持sqlite、mongodb、influxdb "host": "127.0.0.1", # 数据库ip "port": "2937", # 数据库端口 "user": "Ruby", # 数据库用户 "size": "175000000", # mongodb 最大存储容量 "max_rows": "1000000" # mongodb 最大存储条数 }, "agent": { "cluster_name": "my_cluster", # 采集数据库的名称 "collection_type": "os", # 采集类型,支持os、database、all "collection_item": [["dn", "10.000.00.000", "33700"]], # agent节点采集数据类型(dn/cn),采集节点IP,端口 "channel_capacity": "1000", # 队列容量 "source_timer_interval": "5S", # 采集间隔 "sink_timer_interval": "5S" # 发送间隔 }, "security": { "tls": "True" # 是否开启https } } }