您现在的位置是:首页 > 文章详情

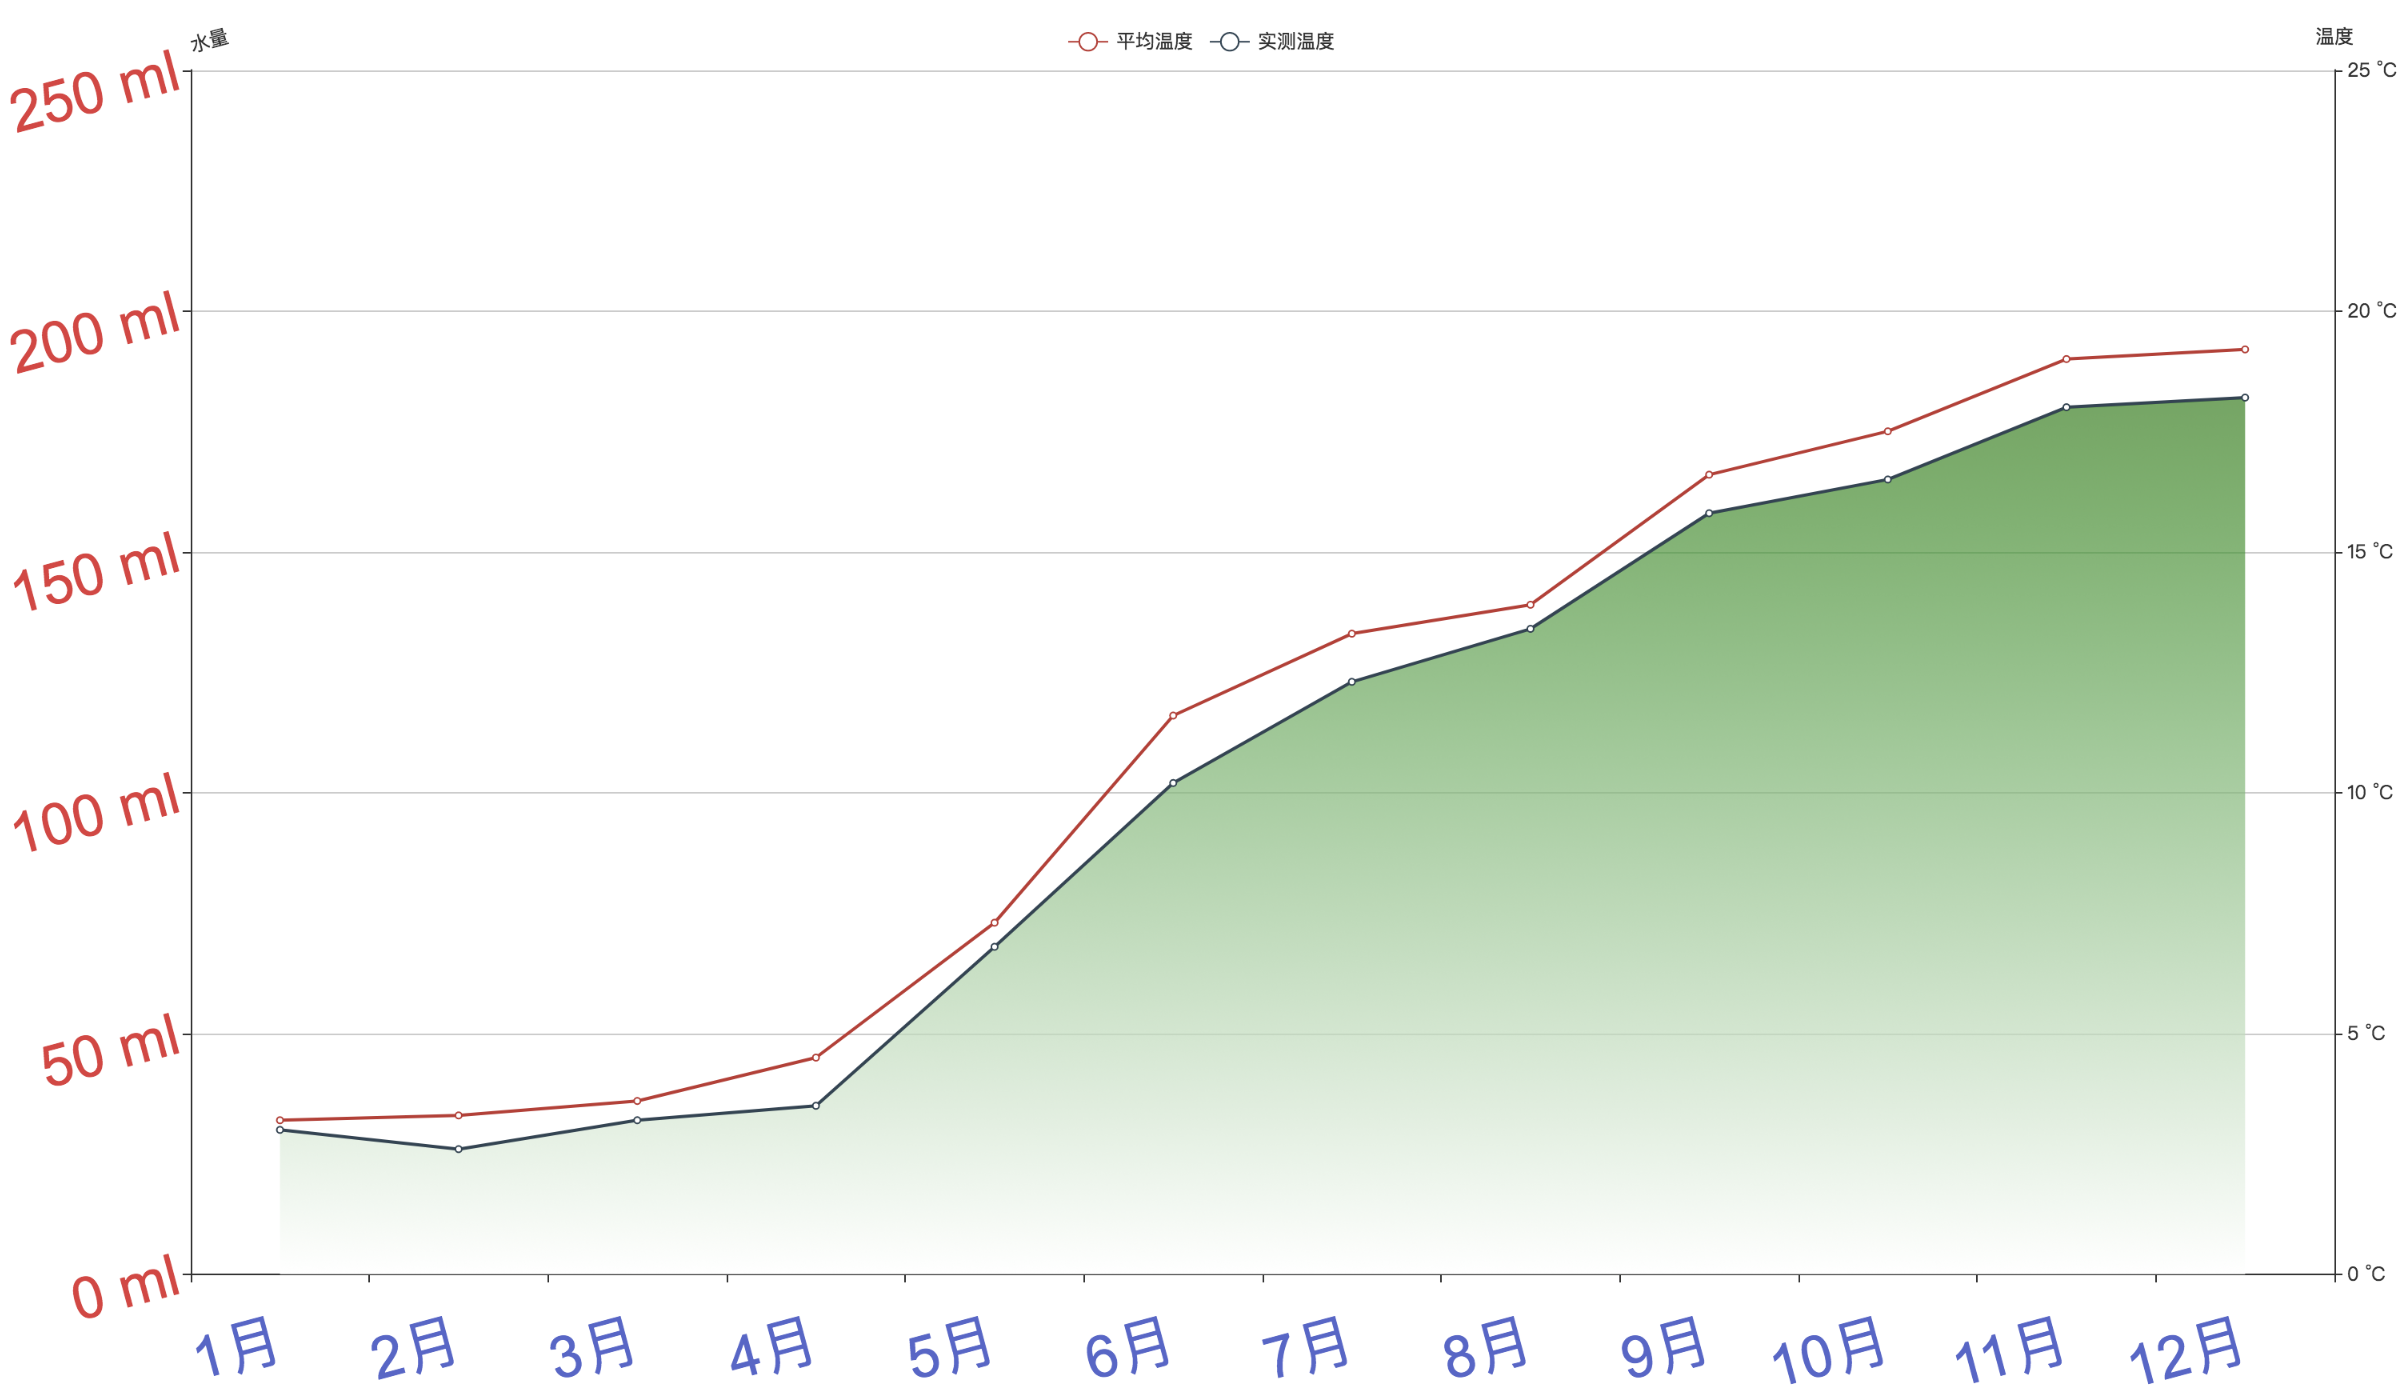
Echarts区域填充效果

日期:2018-09-26点击:521

Echarts区域填充效果

参考官方配置手册series.areaStyle.normal

附代码

series: [{

    name: '平均温度',

    type: 'line',

    yAxisIndex: 1,

    data: [3.2, 3.3, 3.6, 4.5, 7.3, 11.6, 13.3, 13.9, 16.6, 17.5, 19.0, 19.2]

    },

    {

    name: '实测温度',

    type: 'line',

    areaStyle: {

        normal: {

            color: {

                type: 'linear',//设置线性渐变

                x: 0,

                y: 0,

                x2: 0,

                y2: 1,

                colorStops: [{

                    offset: 0, color: 'green' // 0% 处的颜色

                }, {

                    offset: 1, color: 'white' // 100% 处的颜色

                }],

                globalCoord: false // 缺省为 false

            },

        }

    },

    yAxisIndex: 1,

    data: [3.0, 2.6, 3.2, 3.5, 6.8, 10.2, 12.3, 13.4, 15.8, 16.5, 18.0, 18.2]

}]

原文链接:https://yq.aliyun.com/articles/645690
关注公众号

低调大师中文资讯倾力打造互联网数据资讯、行业资源、电子商务、移动互联网、网络营销平台。

持续更新报道IT业界、互联网、市场资讯、驱动更新,是最及时权威的产业资讯及硬件资讯报道平台。

转载内容版权归作者及来源网站所有,本站原创内容转载请注明来源。

文章评论

共有0条评论来说两句吧...

文章二维码

扫描即可查看该文章

点击排行

推荐阅读

最新文章