首页 文章 精选 留言 我的

精选列表

搜索[高性能全文搜索引擎],共10007篇文章
优秀的个人博客,低调大师

【Elasticsearch全文搜索引擎实战】之Filebeat快速入门

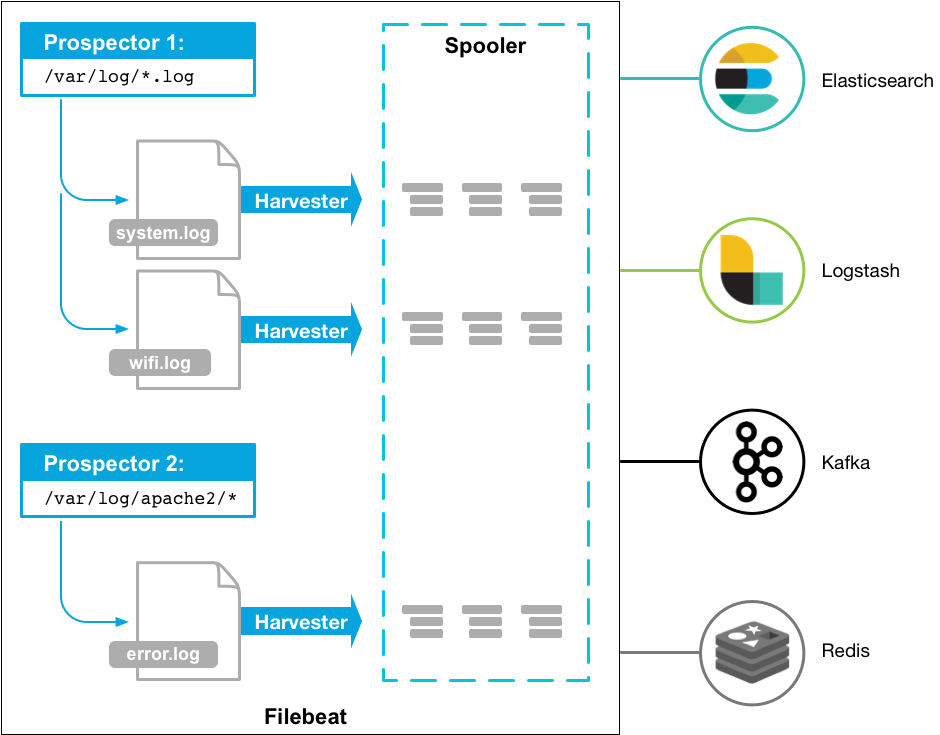
0. 背景 用过ELK(Elasticsearch, Logstash, Kibana)的人应该都面临过同样的问题,Logstash虽然功能强大:支持许多的input/output plugin、强大的filter功能。但是确内存占用会非常大。还有种情况(我就是orz...),在Logstash 5.2+版本中,input plugin使用Log4j,必须使用filebeat,并且只支持log4j 1.x版本。了解到filebeat已经支持filter和不少的output plugin,果断转投fielbeat阵营。 1. 简介 Filebeat官方介绍是这样的: Filebeat is a log data shipper for local files. Installed as an agent on your servers, Filebeat monitors the log directories or specific log files, tails the files, and forwards them either to Elasticsearch or Logstash for indexing. Here’s how Filebeat works: When you start Filebeat, it starts one or more prospectors that look in the local paths you’ve specified for log files. For each log file that the prospector locates, Filebeat starts a harvester. Each harvester reads a single log file for new content and sends the new log data to libbeat, which aggregates the events and sends the aggregated data to the output that you’ve configured for Filebeat. 翻译成中文大意就是: Filebeat是一个日志数据收集工具,在服务器上安装客户端后,filebeat会监控日志目录或者指定的日志文件,追踪读取这些文件(追踪文件的变化,不停的读),并且转发这些信息到elasticsearch或者logstarsh中存放。 以下是filebeat的工作流程:当你开启filebeat程序的时候,它会启动一个或多个探测器(prospectors)去检测你指定的日志目录或文件,对于探测器找出的每一个日志文件,filebeat启动收割进程(harvester),每一个收割进程读取一个日志文件的新内容,并发送这些新的日志数据到处理程序(spooler),处理程序会集合这些事件,最后filebeat会发送集合的数据到你指定的地点。 更关于探测器(prospectors)和收割进程(harvester)信息,请查看官网How Filebeat works. 1.2 核心功能 1.2.1 性能稳健,不错过任何检测信号 无论在任何环境中,随时都潜伏着应用程序中断的风险。Filebeat 能够读取并转发日志行,如果出现中断,还会在一切恢复正常后,从中断前停止的位置继续开始。 1.2.2 Filebeat 不会让通道过载 考虑到数据量较大,Filebeat 使用压力敏感协议向 Logstash 或 Elasticsearch 发送数据。如果 Logstash 正在繁忙地处理数据,它会告知 Filebeat 减慢读取速度。拥塞解决后,Filebeat 将恢复初始速度并继续输送数据。 1.2.3 不需要重载管道 当将数据发送到 Logstash 或 Elasticsearch 时,Filebeat 使用背压敏感协议,以考虑更多的数据量。如果 Logstash 正在忙于处理数据,则可以让 Filebeat 知道减慢读取速度。一旦拥堵得到解决,Filebeat 就会恢复到原来的步伐并继续运行。 1.2.4 输送至 Elasticsearch 或 Logstash。在 Kibana 中实现可视化。 Filebeat 是 Elastic Stack 的一部分,因此能够与 Logstash、Elasticsearch 和 Kibana 无缝协作。无论您要使用 Logstash 转换或充实日志和文件,还是在 Elasticsearch 中随意处理一些数据分析,亦或在 Kibana 中构建和分享仪表板,Filebeat 都能轻松地将您的数据发送至最关键的地方。 2. 性能 运行环境: OS 内存 CPU Filebeat版本 Logstash版本 CentOS 32g 6核Intel(R) Xeon(R) CPU E5-2620 v3 @ 2.40GHz 6.1 5.6.5 Logstash内存占用 [root@dde /]# cat /proc/20085/status /proc/20085/status | grep -i vm VmPeak: 9837428 kB VmSize: 9835376 kB VmLck: 0 kB VmHWM: 798364 kB VmRSS: 798360 kB VmData: 9677292 kB VmStk: 88 kB VmExe: 4 kB VmLib: 16520 kB VmPTE: 2568 kB VmSwap: 0 kB VmPeak: 9837428 kB VmSize: 9835376 kB VmLck: 0 kB VmHWM: 798364 kB VmRSS: 798360 kB VmData: 9677292 kB VmStk: 88 kB VmExe: 4 kB VmLib: 16520 kB VmPTE: 2568 kB VmSwap: 0 kB Filebeat内存占用 [root@dde /]# cat /proc/22207/status /proc/22207/status | grep -i vm VmPeak: 452796 kB VmSize: 410180 kB VmLck: 0 kB VmHWM: 16008 kB VmRSS: 16008 kB VmData: 376332 kB VmStk: 88 kB VmExe: 24764 kB VmLib: 1804 kB VmPTE: 184 kB VmSwap: 0 kB VmPeak: 452796 kB VmSize: 410180 kB VmLck: 0 kB VmHWM: 16008 kB VmRSS: 16008 kB VmData: 376332 kB VmStk: 88 kB VmExe: 24764 kB VmLib: 1804 kB VmPTE: 184 kB VmSwap: 0 kB Logstash因为是运行是JVM中的,可以看到Logstash内存占用比Filebeat大的多。 3. 安装 Filebeat官方提供了以下几种安装方式: (deb for Debian/Ubuntu, rpm for Redhat/Centos/Fedora, mac for OS X, docker for any Docker platform, and win for Windows). deb: curl -L -O https://artifacts.elastic.co/downloads/beats/filebeat/filebeat-6.1.2-amd64.deb sudo dpkg -i filebeat-6.1.2-amd64.deb rpm: curl -L -O https://artifacts.elastic.co/downloads/beats/filebeat/filebeat-6.1.2-x86_64.rpm sudo rpm -vi filebeat-6.1.2-x86_64.rpm mac curl -L -O https://artifacts.elastic.co/downloads/beats/filebeat/filebeat-6.1.2-darwin-x86_64.tar.gz tar xzvf filebeat-6.1.2-darwin-x86_64.tar.gz docker: docker pull docker.elastic.co/beats/filebeat:6.1.2 windows: 1.下载zip包,地址。 2.解压到:C:\Program Files。 3.重命名文件夹为以下格式:filebeat-<version>-windows。 4.以管理员身份运行Shell。 5.使用如下命令,讲Filebeat安装为一个Windows Service: PS > cd 'C:\Program Files\Filebeat' PS C:\Program Files\Filebeat> .\install-service-filebeat.ps1 4. 配置 Elastic提供了一个配合ELK(Elasticsearch + Logstash + Kibana)的快速配置方式,不过我们不需要配合ELK使用Filebeat。直接配置filebeat根目录下filebeat.yml文件: filebeat.prospectors: - type: log enabled: true paths: - /var/log/*.log #- c:\programdata\elasticsearch\logs\* 需要配合elasticsearch使用时,增加以下配置: output.elasticsearch: hosts: ["192.168.1.42:9200"] 需要配合kibana使用时,增加以下配置: setup.kibana: host: "localhost:5601" Output Filebeat现在已经支持丰富的output类型: Elasticsearch Logstash Kafka Redis File Console Output codec Cloud output到kafka的配置类似: output.kafka: # initial brokers for reading cluster metadata hosts: ["kafka1:9092", "kafka2:9092", "kafka3:9092"] # message topic selection + partitioning topic: '%{[fields.log_topic]}' partition.round_robin: reachable_only: false required_acks: 1 compression: gzip max_message_bytes: 1000000 当事件的大小超过max_message_bytes的值的时候,会被直接丢弃不处理,所以要尽量控制filebeat产生的事件小于max_message_bytes的值。 上面示例中字段含义如下:enable: 该output是否生效;hosts:kafka broker集群地址;topic: kafka接收事件的topic;partition: kafka output的partioning 策略,可能值为:random, round_robin, hash。默认为hash;官方关于这几个可选值解释如下: random.group_events: Sets the number of events to be published to the same partition, before the partitioner selects a new partition by random. The default value is 1 meaning after each event a new partition is picked randomly. round_robin.group_events: Sets the number of events to be published to the same partition, before the partitioner selects the next partition. The default value is 1 meaning after each event the next partition will be selected. hash.hash: List of fields used to compute the partitioning hash value from. If no field is configured, the events key value will be used. hash.random: Randomly distribute events if no hash or key value can be computed. required_acks: kafka broker ACK可靠级别: 0=不需要响应, 1=等待本地commit, -1=等待所有的 replicascommit. 默认值为 1. Note: 如果设置为0,kafka将没有ACK返回,也许会有消息丢失或者错误。 5.运行 sudo ./filebeat -e -c filebeat.yml Filebeat目前已经支持Docker和Kubernetes。 5.1 Docker (1)pull image docker pull docker.elastic.co/beats/filebeat:6.1.2 (2) run image docker run \ -v ~/filebeat.yml:/usr/share/filebeat/filebeat.yml \ docker.elastic.co/beats/filebeat:6.1.2 (3) Configuration FROM docker.elastic.co/beats/filebeat:6.1.2 COPY filebeat.yml /usr/share/filebeat/filebeat.yml USER root RUN chown filebeat /usr/share/filebeat/filebeat.yml USER filebeat 5.2 Kubernetes (1)Deploy manifests curl -L -O https://raw.githubusercontent.com/elastic/beats/6.1/deploy/kubernetes/filebeat-kubernetes.yaml (2)Setting - name: ELASTICSEARCH_HOST value: elasticsearch - name: ELASTICSEARCH_PORT value: "9200" - name: ELASTICSEARCH_USERNAME value: elastic - name: ELASTICSEARCH_PASSWORD value: changeme (3)Deploy kubectl create -f filebeat-kubernetes.yaml check status $ kubectl --namespace=kube-system get ds/filebeat NAME DESIRED CURRENT READY UP-TO-DATE AVAILABLE NODE-SELECTOR AGE filebeat 32 32 0 32 0 <none> 1m 6. 参考资料 Elastic Filebeat Reference

优秀的个人博客,低调大师

【Elasticsearch全文搜索引擎实战】之集群搭建及配置

文中Elasticsearch版本为6.0.1 1. 环境配置 把环境配置放在第一节来讲,是因为很多人按官网的Getting Started安装运行会有各种错误。其实都是因为一些配置不正确引起的。 首先,Elasticsearch不能以root账号运行,所以我们需要单独建立用户授权运行。 对于非root账号Linux可以进行并发操作,但是文件、线程都有限制,所以,部署Elasticsearc的机器需要进行相应配置。 修改文件限制 # 修改系统文件 vi /etc/security/limits.conf # 增加的内容 * soft nofile 65536 * hard nofile 65536 * soft nproc 2048 * hard nproc 4096 调整进程数 # 修改系统文件 vi /etc/security/limits.d/90-nproc.conf # 调整成以下配置 * soft nproc 4096 root soft nproc unlimited 调整虚拟内存&最大并发连接 # 修改系统文件 vi /etc/sysctl.conf # 增加的内容 vm.max_map_count=655360 fs.file-max=655360 保存之后执行 sysctl -p 生效 创建Elasticsearch专用用户 useradd es 创建ELK相关目录并赋权 #创建Elasticsearch APP目录 mkdir /usr/elasticsearch #创建Elasticsearch日志目录 数据目录 mkdir var/lib/elasticsearch #创建Elasticsearch日志目录 mkdir var/logs/elasticsearch #更改目录Owner chown -R es:es /usr/elasticsearch chown -R es:es var/lib/elasticsearch chown -R es:es var/logs/elasticsearch 下载Elasticsearch包并解压 https://www.elastic.co/guide/en/elasticsearch/reference/current/zip-targz.html #打开文件夹 cd /home/download #下载 wget https://artifacts.elastic.co/downloads/elasticsearch/elasticsearch-6.0.1.tar.gz #解压 tar -zvxf elasticsearch-6.0.0.tar.gz 2. Elasticsearch 部署 本次一共要部署两个Elasticsearch节点,所有文中没有指定机器的操作都表示每个Elasticsearch机器都要执行该操作 移动Elasticsearch到统一目录 #移动目录 mv /home/download/elasticsearch-6.0.1 /usr/elasticsearch #赋权 chown -R elk:elk /usr/elasticsearch/ 开放端口(CentOS7+) # 增加端口 firewall-cmd --add-port=9200/tcp --permanent firewall-cmd --add-port=9300/tcp --permanent 重新加载防火墙规则(CentOS7+) firewall-cmd --reload 切换账号 #账号切换到 es su - es 2. Elasticsearch集群配置 修改配置 #打开目录 cd /usr/elasticsearch #修改配置 vi config/elasticsearch.yml 主节点配置(192.168.180.1) cluster.name: es node.name: node-1 path.data: /var/lib/elasticsearch path.logs: /var/logs/elasticsearch network.host: 192.168.180.1 http.port: 9200 node.master: true node.data: true discovery.zen.ping.unicast.hosts: ["192.168.180.1:9300","192.168.180.2:9300"] discovery.zen.minimum_master_nodes: 2 从节点配置(192.168.180.2) cluster.name: es node.name: node-2 path.data: /var/lib/elasticsearch path.logs: /var/logs/elasticsearch network.host: 192.168.180.2 http.port: 9200 node.master: false node.data: true discovery.zen.ping.unicast.hosts: ["192.168.1.31:9300","192.168.1.32:9300"] discovery.zen.minimum_master_nodes: 2 配置参数说明 参数 说明 cluster.name 集群名 node.name 节点名 path.data 数据保存目录 path.logs 日志保存目录 network.host 节点host/ip http.port HTTP访问端口 node.master 是否允许作为主节点 node.data 是否保存数据 discovery.zen.ping.unicast.hosts 集群中的主节点的初始列表,当节点(主节点或者数据节点)启动时使用这个列表进行探测 discovery.zen.minimum_master_nodes master选举最少的节点数,这个一定要设置为N/2+1,其中N是:N是具有master资格的节点的数量,而不是整个集群节点个数 3. 启动Elasticsearch 运行 #进入elasticsearch根目录 cd /usr/elasticsearch #启动 (-d 为后台运行) ./bin/elasticsearch -d 验证 访问http://192.168.180.1:9200/,可以看到如下内容则表示成功: { name: "node-1", cluster_name: "es", cluster_uuid: "Tum8l98uQfK0LdS-KnsWxg", version: { number: "6.0.1", build_hash: "601be4a", build_date: "2017-12-04T09:29:09.525Z", build_snapshot: false, lucene_version: "7.0.1", minimum_wire_compatibility_version: "5.6.0", minimum_index_compatibility_version: "5.0.0" }, tagline: "You Know, for Search" } 健康状态检查 访问http://192.168.180.1:9200/,status返回green则表示正常。 { cluster_name: "es", status: "green", timed_out: false, number_of_nodes: 2, number_of_data_nodes: 2, active_primary_shards: 16, active_shards: 32, relocating_shards: 0, initializing_shards: 0, unassigned_shards: 0, delayed_unassigned_shards: 0, number_of_pending_tasks: 0, number_of_in_flight_fetch: 0, task_max_waiting_in_queue_millis: 0, active_shards_percent_as_number: 100 } 4. Head插件 Elasticsearch head是一个用浏览器跟ES集群交互的插件,可以查看集群状态、集群的doc内容、执行搜索和普通的Rest请求等。 具体安装配置请参考另外一篇博文:http://www.cnblogs.com/mantoudev/p/8269345.html

优秀的个人博客,低调大师

当海量存储系统插上搜索引擎的翅膀,阿里云HBase增强版(Lindorm)全文索引功能技术解析

新用户9.9元即可使用6个月云数据库HBase,更有低至1元包年的入门规格供广大HBase爱好者学习研究,更多内容请参考链接 阿里云HBase增强版(Lindorm)简介 阿里云数据库HBase增强版,是基于阿里集团内部使用的Lindorm产品研发的、完全兼容HBase的云上托管数据库,从2011年开始正式承载阿里内部业务的海量数据实时存储需求,支撑服务了淘宝、支付宝、菜鸟、优酷、高德等业务中的大量核心应用,历经双十一、春晚、十一出行节等场景的大规模考验,在成本、性能、稳定性、功能、安全、易用性等方面相比社区版拥有诸多优势和企业级能力,更多介绍可以参考Lindorm帮助文档(https://help.aliyun.com/document_detail/119548.html) 当大数据存储遇上复杂查询 HBase是目前广泛使用的NoS

优秀的个人博客,低调大师

cassandra的全文检索插件

https://github.com/Stratio/cassandra-lucene-index Stratio’s Cassandra Lucene Index Stratio’s Cassandra Lucene Index, derived fromStratio Cassandra, is a plugin forApache Cassandrathat extends its index functionality to provide near real time search such as ElasticSearch or Solr, includingfull text searchcapabilities and free multivariable, geospatial and bitemporal search. It is achieved through anApache Lucenebased implementation of Cassandra secondary indexes, where each node of the cluster indexes its own data. Stratio’s Cassandra indexes are one of the core modules on whichStratio’s BigData platformis based. Indexrelevance searchesallow you to retrieve thenmore relevant results satisfying a search. The coordinator node sends the search to each node in the cluster, each node returns itsnbest results and then the coordinator combines these partial results and gives you thenbest of them, avoiding full scan. You can also base the sorting in a combination of fields. Any cell in the tables can be indexed, including those in the primary key as well as collections. Wide rows are also supported. You can scan token/key ranges, apply additional CQL3 clauses and page on the filtered results. Index filtered searches are a powerful help when analyzing the data stored in Cassandra withMapReduceframeworks asApache Hadoopor, even better,Apache Spark. Adding Lucene filters in the jobs input can dramatically reduce the amount of data to be processed, avoiding full scan. The following benchmark result can give you an idea about the expected performance when combining Lucene indexes with Spark. We do successive queries requesting from the 1% to 100% of the stored data. We can see a high performance for the index for the queries requesting strongly filtered data. However, the performance decays in less restrictive queries. As the number of records returned by the query increases, we reach a point where the index becomes slower than the full scan. So, the decision to use indexes in your Spark jobs depends on the query selectivity. The trade-off between both approaches depends on the particular use case. Generally, combining Lucene indexes with Spark is recommended for jobs retrieving no more than the 25% of the stored data. This project is not intended to replace Apache Cassandra denormalized tables, inverted indexes, and/or secondary indexes. It is just a tool to perform some kind of queries which are really hard to be addressed using Apache Cassandra out of the box features, filling the gap between real-time and analytics. More detailed information is available atStratio’s Cassandra Lucene Index documentation. Features Lucene search technology integration into Cassandra provides: Stratio’s Cassandra Lucene Index and its integration with Lucene search technology provides: Full text search (language-aware analysis, wildcard, fuzzy, regexp) Boolean search (and, or, not) Sorting by relevance, column value, and distance Geospatial indexing (points, lines, polygons and their multiparts) Geospatial transformations (bounding box, buffer, centroid, convex hull, union, difference, intersection) Geospatial operations (intersects, contains, is within) Bitemporal search (valid and transaction time durations) CQL complex types (list, set, map, tuple and UDT) CQL user defined functions (UDF) CQL paging, even with sorted searches Columns with TTL Third-party CQL-based drivers compatibility Spark and Hadoop compatibility Not yet supported: Thrift API Legacy compact storage option Indexingcountercolumns Indexing static columns Other partitioners than Murmur3 Requirements Cassandra (identified by the three first numbers of the plugin version) Java >= 1.8 (OpenJDK and Sun have been tested) Maven >= 3.0 本文转自张昺华-sky博客园博客,原文链接:http://www.cnblogs.com/bonelee/p/6757830.html,如需转载请自行联系原作者


资源下载

更多资源
腾讯云软件源

腾讯云软件源

为解决软件依赖安装时官方源访问速度慢的问题,腾讯云为一些软件搭建了缓存服务。您可以通过使用腾讯云软件源站来提升依赖包的安装速度。为了方便用户自由搭建服务架构,目前腾讯云软件源站支持公网访问和内网访问。

Nacos

Nacos

Nacos /nɑ:kəʊs/ 是 Dynamic Naming and Configuration Service 的首字母简称,一个易于构建 AI Agent 应用的动态服务发现、配置管理和AI智能体管理平台。Nacos 致力于帮助您发现、配置和管理微服务及AI智能体应用。Nacos 提供了一组简单易用的特性集,帮助您快速实现动态服务发现、服务配置、服务元数据、流量管理。Nacos 帮助您更敏捷和容易地构建、交付和管理微服务平台。

Spring

Spring

Spring框架(Spring Framework)是由Rod Johnson于2002年提出的开源Java企业级应用框架,旨在通过使用JavaBean替代传统EJB实现方式降低企业级编程开发的复杂性。该框架基于简单性、可测试性和松耦合性设计理念,提供核心容器、应用上下文、数据访问集成等模块,支持整合Hibernate、Struts等第三方框架,其适用范围不仅限于服务器端开发,绝大多数Java应用均可从中受益。

WebStorm

WebStorm

WebStorm 是jetbrains公司旗下一款JavaScript 开发工具。目前已经被广大中国JS开发者誉为“Web前端开发神器”、“最强大的HTML5编辑器”、“最智能的JavaScript IDE”等。与IntelliJ IDEA同源,继承了IntelliJ IDEA强大的JS部分的功能。

用户登录
用户注册