版权声明:本文为博主原创文章,未经博主允许不得转载。 https://blog.csdn.net/u012942410/article/details/50091387
转载请注明出处:http://blog.csdn.net/kaku2013/article/details/50091387
大家好,不久前写了个绘制天气温度曲线功能的demo今天抽空来和大家分享一下。
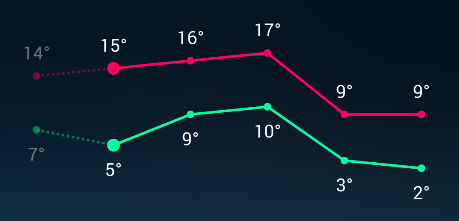
效果图如下:
![这里写图片描述]()
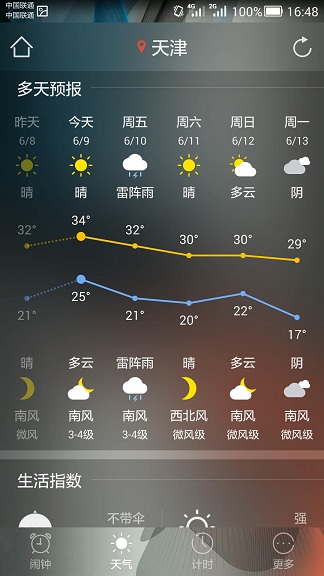
运用到我的项目效果图:https://github.com/kaku2015/WeatherAlarmClock
![这里写图片描述]()
一般绘制图表,可以直接使用类库来实现,类似的类库还是很多的。
例如:
hellocharts-android
![这里写图片描述]()
WilliamChart
![这里写图片描述]()
MPAndroidChart
![这里写图片描述]()
上述类库功能很多,可以实现很多种图表,效果也是非常绚丽的。
那么为什么这里我还要尝试自己绘制天气温度曲线呢,原因如下:
1.由于类库实现的功能比较多相对代码也稍显复杂,要想实现需求要改的地方还是挺多的,尝试的修改了几个类库代码,最终还是没能完全符合自己的需求,有的改后也莫名其妙的出现了细微的bug,不知道是不是修改的原因…因此也浪费了挺长的时间,不过也学到了很多的东西。
2.这么强大类库用来实现功能、效果相对单一的天气温度曲线是不是有点杀鸡焉用宰牛刀呢!
主要还是没能通过类库完全实现自己的需求,无奈逼迫自己走上了自定义View这条荆棘之路…
由于本人接触安卓时间并不算长,还没有自定义过组件,所以对于自定义View还是比较畏惧的…
经过方案的思考与整理,发现自定义View来实现天气温度曲线并没有想象中的那么难,相反还是挺简单的,而且代码量也是相当的少,只需要覆写View类的 onDraw(Canvas canvas) 方法即可实现需求。
自定义View代码如下:
package com.kaku.wcv;
import android.content.Context;
import android.content.res.TypedArray;
import android.graphics.Canvas;
import android.graphics.Color;
import android.graphics.DashPathEffect;
import android.graphics.Paint;
import android.graphics.Path;
import android.util.AttributeSet;
import android.view.View;
import com.kaku.library.R;
/**
* 折线温度双曲线
*
* @author 咖枯
* @version 1.0 2015/11/06
*/
public class WeatherChartView extends View {
/**
* x轴集合
*/
private float mXAxis[] = new float[6];
/**
* 白天y轴集合
*/
private float mYAxisDay[] = new float[6];
/**
* 夜间y轴集合
*/
private float mYAxisNight[] = new float[6];
/**
* x,y轴集合数
*/
private static final int LENGTH = 6;
/**
* 白天温度集合
*/
private int mTempDay[] = new int[6];
/**
* 夜间温度集合
*/
private int mTempNight[] = new int[6];
/**
* 控件高
*/
private int mHeight;
/**
* 字体大小
*/
private float mTextSize;
/**
* 圓半径
*/
private float mRadius;
/**
* 圓半径今天
*/
private float mRadiusToday;
/**
* 文字移动位置距离
*/
private float mTextSpace;
/**
* 线的大小
*/
private float mStokeWidth;
/**
* 白天折线颜色
*/
private int mColorDay;
/**
* 夜间折线颜色
*/
private int mColorNight;
/**
* 字体颜色
*/
private int mTextColor;
/**
* 屏幕密度
*/
private float mDensity;
/**
* 控件边的空白空间
*/
private float mSpace;
@SuppressWarnings("deprecation")
public WeatherChartView(Context context, AttributeSet attrs) {
super(context, attrs);
TypedArray a = context.obtainStyledAttributes(attrs, R.styleable.WeatherChartView);
float densityText = getResources().getDisplayMetrics().scaledDensity;
mTextSize = a.getDimensionPixelSize(R.styleable.WeatherChartView_textSize,
(int) (14 * densityText));
mColorDay = a.getColor(R.styleable.WeatherChartView_dayColor,
getResources().getColor(R.color.colorAccent));
mColorNight = a.getColor(R.styleable.WeatherChartView_nightColor,
getResources().getColor(R.color.colorPrimary));
mTextColor = a.getColor(R.styleable.WeatherChartView_textColor, Color.WHITE);
a.recycle();
mDensity = getResources().getDisplayMetrics().density;
mRadius = 3 * mDensity;
mRadiusToday = 5 * mDensity;
mSpace = 3 * mDensity;
mTextSpace = 10 * mDensity;
mStokeWidth = 2 * mDensity;
}
public WeatherChartView(Context context) {
super(context);
}
@Override
protected void onDraw(Canvas canvas) {
super.onDraw(canvas);
if (mHeight == 0) {
setHeightAndXAxis();
}
computeYAxisValues();
drawChart(canvas, mColorDay, mTempDay, mYAxisDay, 0);
drawChart(canvas, mColorNight, mTempNight, mYAxisNight, 1);
}
/**
* 计算y轴集合数值
*/
private void computeYAxisValues() {
int minTempDay = mTempDay[0];
int maxTempDay = mTempDay[0];
for (int item : mTempDay) {
if (item < minTempDay) {
minTempDay = item;
}
if (item > maxTempDay) {
maxTempDay = item;
}
}
int minTempNight = mTempNight[0];
int maxTempNight = mTempNight[0];
for (int item : mTempNight) {
if (item < minTempNight) {
minTempNight = item;
}
if (item > maxTempNight) {
maxTempNight = item;
}
}
int minTemp = minTempNight < minTempDay ? minTempNight : minTempDay;
int maxTemp = maxTempDay > maxTempNight ? maxTempDay : maxTempNight;
float parts = maxTemp - minTemp;
float length = mSpace + mTextSize + mTextSpace + mRadius;
float yAxisHeight = mHeight - length * 2;
if (parts == 0) {
for (int i = 0; i < LENGTH; i++) {
mYAxisDay[i] = yAxisHeight / 2 + length;
mYAxisNight[i] = yAxisHeight / 2 + length;
}
} else {
float partValue = yAxisHeight / parts;
for (int i = 0; i < LENGTH; i++) {
mYAxisDay[i] = mHeight - partValue * (mTempDay[i] - minTemp) - length;
mYAxisNight[i] = mHeight - partValue * (mTempNight[i] - minTemp) - length;
}
}
}
/**
* 画折线图
*
* @param canvas 画布
* @param color 画图颜色
* @param temp 温度集合
* @param yAxis y轴集合
* @param type 折线种类:0,白天;1,夜间
*/
private void drawChart(Canvas canvas, int color, int temp[], float[] yAxis, int type) {
Paint linePaint = new Paint();
linePaint.setAntiAlias(true);
linePaint.setStrokeWidth(mStokeWidth);
linePaint.setColor(color);
linePaint.setStyle(Paint.Style.STROKE);
Paint pointPaint = new Paint();
pointPaint.setAntiAlias(true);
pointPaint.setColor(color);
Paint textPaint = new Paint();
textPaint.setAntiAlias(true);
textPaint.setColor(mTextColor);
textPaint.setTextSize(mTextSize);
textPaint.setTextAlign(Paint.Align.CENTER);
int alpha1 = 102;
int alpha2 = 255;
for (int i = 0; i < LENGTH; i++) {
if (i < LENGTH - 1) {
if (i == 0) {
linePaint.setAlpha(alpha1);
linePaint.setPathEffect(new DashPathEffect(new float[]{2 * mDensity, 2 * mDensity}, 0));
Path path = new Path();
path.moveTo(mXAxis[i], yAxis[i]);
path.lineTo(mXAxis[i + 1], yAxis[i + 1]);
canvas.drawPath(path, linePaint);
} else {
linePaint.setAlpha(alpha2);
linePaint.setPathEffect(null);
canvas.drawLine(mXAxis[i], yAxis[i], mXAxis[i + 1], yAxis[i + 1], linePaint);
}
}
if (i != 1) {
if (i == 0) {
pointPaint.setAlpha(alpha1);
canvas.drawCircle(mXAxis[i], yAxis[i], mRadius, pointPaint);
} else {
pointPaint.setAlpha(alpha2);
canvas.drawCircle(mXAxis[i], yAxis[i], mRadius, pointPaint);
}
} else {
pointPaint.setAlpha(alpha2);
canvas.drawCircle(mXAxis[i], yAxis[i], mRadiusToday, pointPaint);
}
if (i == 0) {
textPaint.setAlpha(alpha1);
drawText(canvas, textPaint, i, temp, yAxis, type);
} else {
textPaint.setAlpha(alpha2);
drawText(canvas, textPaint, i, temp, yAxis, type);
}
}
}
/**
* 绘制文字
*
* @param canvas 画布
* @param textPaint 画笔
* @param i 索引
* @param temp 温度集合
* @param yAxis y轴集合
* @param type 折线种类:0,白天;1,夜间
*/
private void drawText(Canvas canvas, Paint textPaint, int i, int[] temp, float[] yAxis, int type) {
switch (type) {
case 0:
canvas.drawText(temp[i] + "°", mXAxis[i], yAxis[i] - mRadius - mTextSpace, textPaint);
break;
case 1:
canvas.drawText(temp[i] + "°", mXAxis[i], yAxis[i] + mTextSpace + mTextSize, textPaint);
break;
}
}
/**
* 设置高度,x轴集合
*/
private void setHeightAndXAxis() {
mHeight = getHeight();
int width = getWidth();
float w = width / 12;
mXAxis[0] = w;
mXAxis[1] = w * 3;
mXAxis[2] = w * 5;
mXAxis[3] = w * 7;
mXAxis[4] = w * 9;
mXAxis[5] = w * 11;
}
/**
* 设置白天温度
*
* @param tempDay 温度数组集合
*/
public void setTempDay(int[] tempDay) {
mTempDay = tempDay;
}
/**
* 设置夜间温度
*
* @param tempNight 温度数组集合
*/
public void setTempNight(int[] tempNight) {
mTempNight = tempNight;
}
}
布局文件中只需引入上面自定义的View即可:
<?xml version="1.0" encoding="utf-8"?>
<RelativeLayout
    xmlns:android="http://schemas.android.com/apk/res/android"
    xmlns:wcv="http://schemas.android.com/apk/res-auto"
    android:layout_width="match_parent"
    android:layout_height="match_parent"
    android:background="@android:color/black">

    <com.kaku.wcv.WeatherChartView
        android:id="@+id/line_char"
        android:layout_width="match_parent"
        android:layout_height="150dp"
        android:layout_centerInParent="true"
        wcv:dayColor="@color/colorAccent"
        wcv:nightColor="@color/colorPrimary"
        wcv:textColor="@android:color/white"
        wcv:textSize="14sp"/>
</RelativeLayout>
Activity中动态设置白天夜间温度集合数值:
WeatherChartView chartView = (WeatherChartView) findViewById(R.id.line_char);
chartView .setTempDay(new int[]{tempDay1,tempDay2,tempDay3,tempDay4,tempDay5,tempDay6});
chartView .setTempNight(new int[]{tempNight1,tempNight2,tempNight3,tempNight4,tempNight5,tempNight6});
chartView .invalidate();
好了,到这里大功告成,是不是觉得还是很简单的吧。
写的不好的地方希望大家指出,谢谢!
Github地址 https://github.com/kaku2015/WeatherChartView