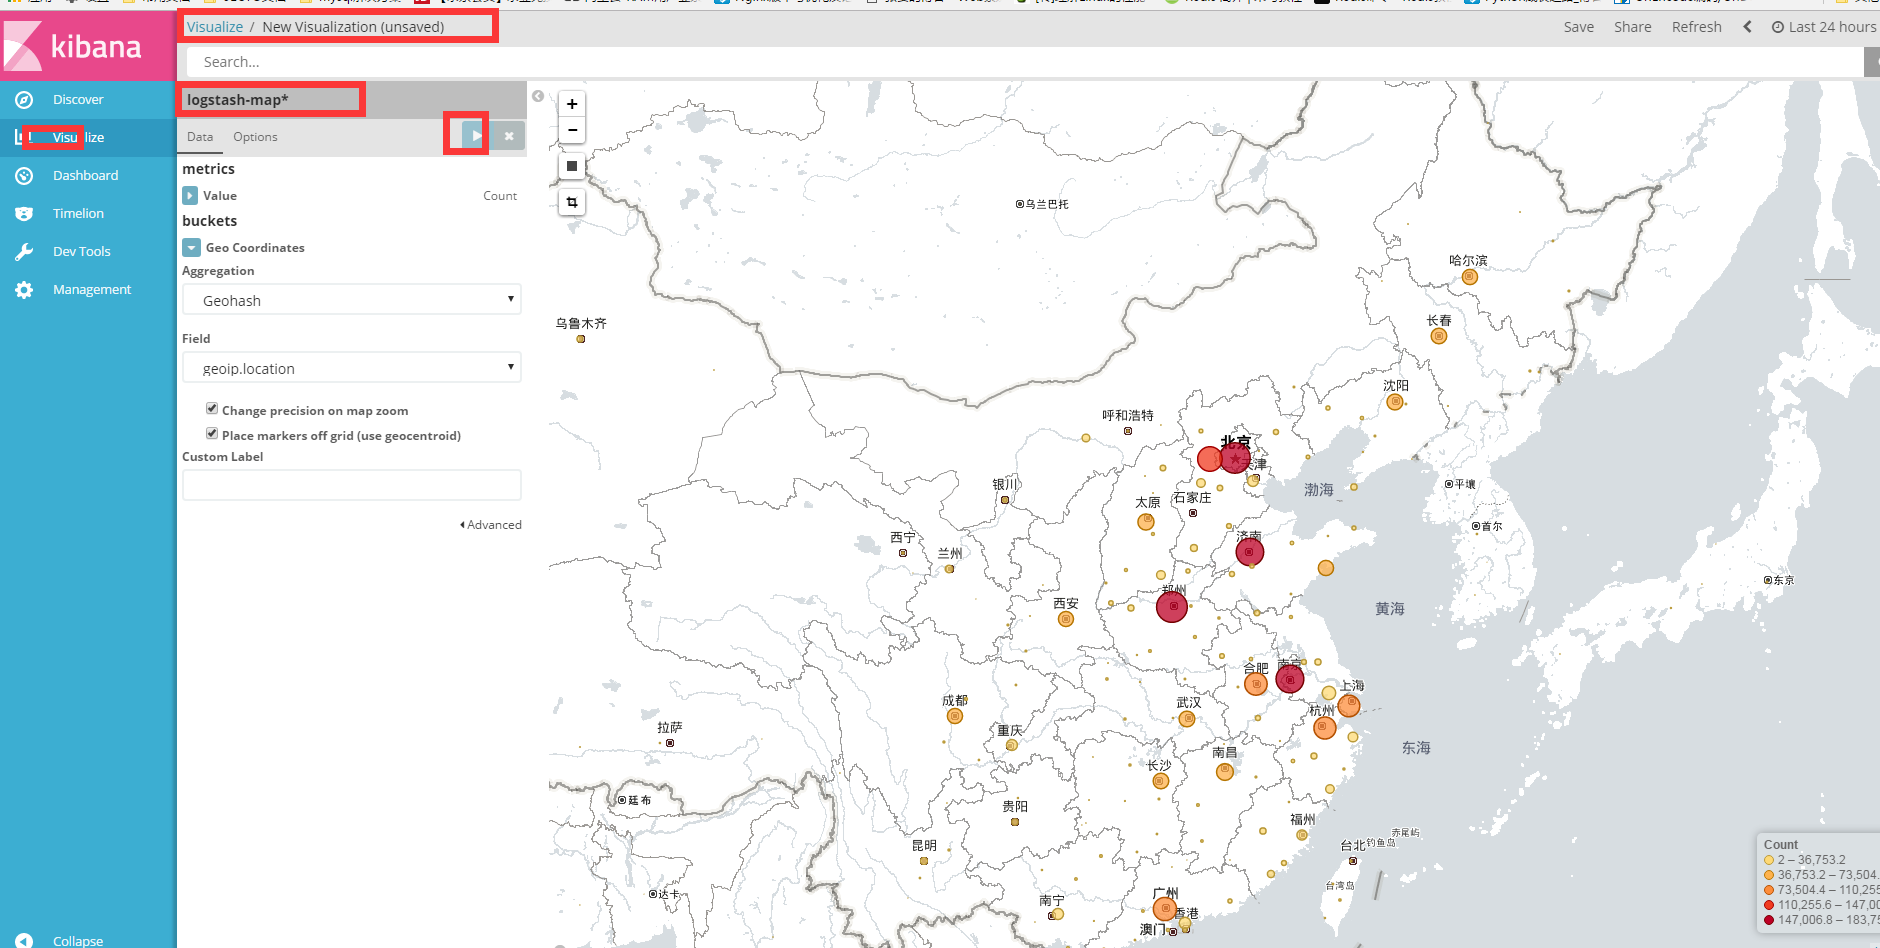
ELK收集nginx日志并用高德地图展示出IP
(一)测试的环境
agentd:192.168.180.22
ES:192.168.180.23
kibana:192.168.180.23
采用的拓扑:logstash -->ES-->kibana
(二)实施步骤:
(1)logstsh具体配置:
1,配置nginx日志格式,采用log_format格式:
|
1
2
3
|
log_format main
'$remote_addr - $remote_user [$time_local] "$request" '
'$status $body_bytes_sent "$http_referer" '
'"$http_user_agent" "$http_x_forwarded_for"'
;
|
2,在logstash服务器下载IP地址归类查询库
|
1
2
3
|
[root@localhost config]
# cd /usr/local/logstash/config/
[root@localhost config]
# wget http://geolite.maxmind.com/download/geoip/database/GeoLite2-City.mmdb.
gz
|
3,配置logstash客户端
|
1
2
3
4
5
6
7
8
9
10
11
12
13
14
15
16
17
18
19
20
21
22
23
24
25
26
27
28
29
30
31
|
[root@localhost config]
# vim /usr/local/logstash/config/nginx-access.conf
input {
file
{
path =>
"/opt/access.log"
type
=>
"nginx"
start_position =>
"beginning"
}
}
filter {
grok {
match => {
"message"
=> "%{IPORHOST:remote_addr} - - \[%{HTTPDATE:time_local}\] \"%{WO
RD:method} %{URIPATHPARAM:request} HTTP/%{NUMBER:httpversion}\" %{INT:status} %{INT:body_bytes_sent} %
{QS:http_referer} %{QS:http_user_agent}"
}
}
geoip {
source
=>
"remote_addr"
target =>
"geoip"
database =>
"/usr/local/logstash/config/GeoLite2-City.mmdb"
add_field => [
"[geoip][coordinates]"
,
"%{[geoip][longitude]}"
]
add_field => [
"[geoip][coordinates]"
,
"%{[geoip][latitude]}"
]
}
}
output {
elasticsearch {
hosts => [
"192.168.180.23:9200"
]
manage_template =>
true
index =>
"logstash-map-%{+YYYY-MM}"
}
}
|
备注:
-
geoip: IP查询插件
-
source: 需要通过geoip插件处理的field,一般为ip,这里因为通过控制台手动输入的是ip所以直接填message,生成环境中如果查询nginx访问用户,需先将客户端ip过滤出来,然后这里填remote_addr即可
-
target: 解析后的Geoip地址数据,应该存放在哪一个字段中,默认是geoip这个字段
-
database: 指定下载的数据库文件
-
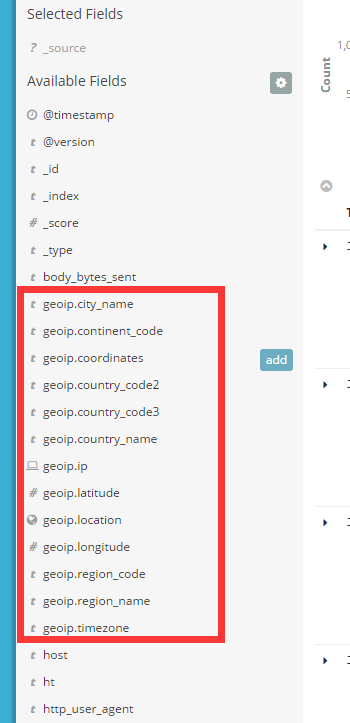
add_field: 这里两行是添加经纬度,地图中地区显示是根据经纬度来识
。如果启动正常的话,可以在kibana看到geoip相关的字段,如下图:
3,启动logstash客户端并加载刚才的配置文件。
|
1
2
3
4
5
6
7
8
9
10
11
12
|
[root@localhost config]
# /usr/local/logstash/bin/logstash -f nginx-access.conf
Sending Logstash's logs to
/usr/local/logstash/logs
which
is now configured via log4j2.properties
[2017-06-20T22:55:23,801][INFO ][logstash.outputs.elasticsearch] Elasticsearch pool URLs updated {:changes=>{:removed=>[], :added=>[http:
//192
.168.180.23:9200/]}}
[2017-06-20T22:55:23,805][INFO ][logstash.outputs.elasticsearch] Running health check to see
if
an Elasticsearch connection is working {:healthcheck_url=>http:
//192
.168.180.23:9200/, :path=>
"/"
}
[2017-06-20T22:55:23,901][WARN ][logstash.outputs.elasticsearch] Restored connection to ES instance {:url=>
#<URI::HTTP:0x4e54594d URL:http://192.168.180.23:9200/>}
[2017-06-20T22:55:23,909][INFO ][logstash.outputs.elasticsearch] Using mapping template from {:path=>nil}
[2017-06-20T22:55:23,947][INFO ][logstash.outputs.elasticsearch] Attempting to
install
template {:manage_template=>{
"template"
=>
"logstash-*"
,
"version"
=>50001,
"settings"
=>{
"index.refresh_interval"
=>
"5s"
},
"mappings"
=>{
"_default_"
=>{
"_all"
=>{
"enabled"
=>
true
,
"norms"
=>
false
},
"dynamic_templates"
=>[{
"message_field"
=>{
"path_match"
=>
"message"
,
"match_mapping_type"
=>
"string"
,
"mapping"
=>{
"type"
=>
"text"
,
"norms"
=>
false
}}}, {
"string_fields"
=>{
"match"
=>
"*"
,
"match_mapping_type"
=>
"string"
,
"mapping"
=>{
"type"
=>
"text"
,
"norms"
=>
false
,
"fields"
=>{
"keyword"
=>{
"type"
=>
"keyword"
}}}}}],
"properties"
=>{
"@timestamp"
=>{
"type"
=>
"date"
,
"include_in_all"
=>
false
},
"@version"
=>{
"type"
=>
"keyword"
,
"include_in_all"
=>
false
},
"geoip"
=>{
"dynamic"
=>
true
,
"properties"
=>{
"ip"
=>{
"type"
=>
"ip"
},
"location"
=>{
"type"
=>
"geo_point"
},
"latitude"
=>{
"type"
=>
"half_float"
},
"longitude"
=>{
"type"
=>
"half_float"
}}}}}}}}
[2017-06-20T22:55:23,955][INFO ][logstash.outputs.elasticsearch] New Elasticsearch output {:class=>
"LogStash::Outputs::ElasticSearch"
, :hosts=>[
#<URI::Generic:0x1e098115 URL://192.168.180.23:9200>]}
[2017-06-20T22:55:24,065][INFO ][logstash.filters.geoip ] Using geoip database {:path=>
"/usr/local/logstash/config/GeoLite2-City.mmdb"
}
[2017-06-20T22:55:24,094][INFO ][logstash.pipeline ] Starting pipeline {
"id"
=>
"main"
,
"pipeline.workers"
=>4,
"pipeline.batch.size"
=>125,
"pipeline.batch.delay"
=>5,
"pipeline.max_inflight"
=>500}
[2017-06-20T22:55:24,275][INFO ][logstash.pipeline ] Pipeline main started
[2017-06-20T22:55:24,369][INFO ][logstash.agent ] Successfully started Logstash API endpoint {:port=>9600}
|
(2)Kibana配置.
1,编辑修改kibana的配置文件kibana.yml在最后添加如下:
|
1
2
3
4
5
6
|
# The default locale. This locale can be used in certain circumstances to substitute any missing
# translations.
#i18n.defaultLocale: "en"
tilemap.url: 'http:
//webrd02
.is.autonavi.com
/appmaptile
?lang=zh_cn&size=1&scale=1&style=7&x={x}&y={y}&
z={z}'
|
2,重启kibana服务。
|
1
2
3
4
5
6
7
8
9
10
11
12
13
|
[root@localhost bin]
# /usr/local/kibana/bin/kibana &
[1] 10631
[root@localhost bin]
# ps -ef|grep kibana
root 10631 7795 21 10:52 pts
/0
00:00:02
/usr/local/kibana/bin/
..
/node/bin/node
--no-warnings
/usr/local/kibana/bin/
..
/src/cli
root 10643 7795 0 10:52 pts
/0
00:00:00
grep
--color=auto kibana
[root@localhost bin]
# log [02:52:59.297] [info][status][plugin:kibana@5.4.0] Status changed from uninitialized to green - Ready
log [02:52:59.445] [info][status][plugin:elasticsearch@5.4.0] Status changed from uninitialized to yellow - Waiting
for
Elasticsearch
log [02:52:59.482] [info][status][plugin:console@5.4.0] Status changed from uninitialized to green - Ready
log [02:52:59.512] [info][status][plugin:elasticsearch@5.4.0] Status changed from yellow to green - Kibana index ready
log [02:52:59.513] [info][status][plugin:metrics@5.4.0] Status changed from uninitialized to green - Ready
log [02:53:00.075] [info][status][plugin:timelion@5.4.0] Status changed from uninitialized to green - Ready
log [02:53:00.080] [info][listening] Server running at http:
//192
.168.180.23:5601
log [02:53:00.081] [info][status][ui settings] Status changed from uninitialized to green - Ready
|
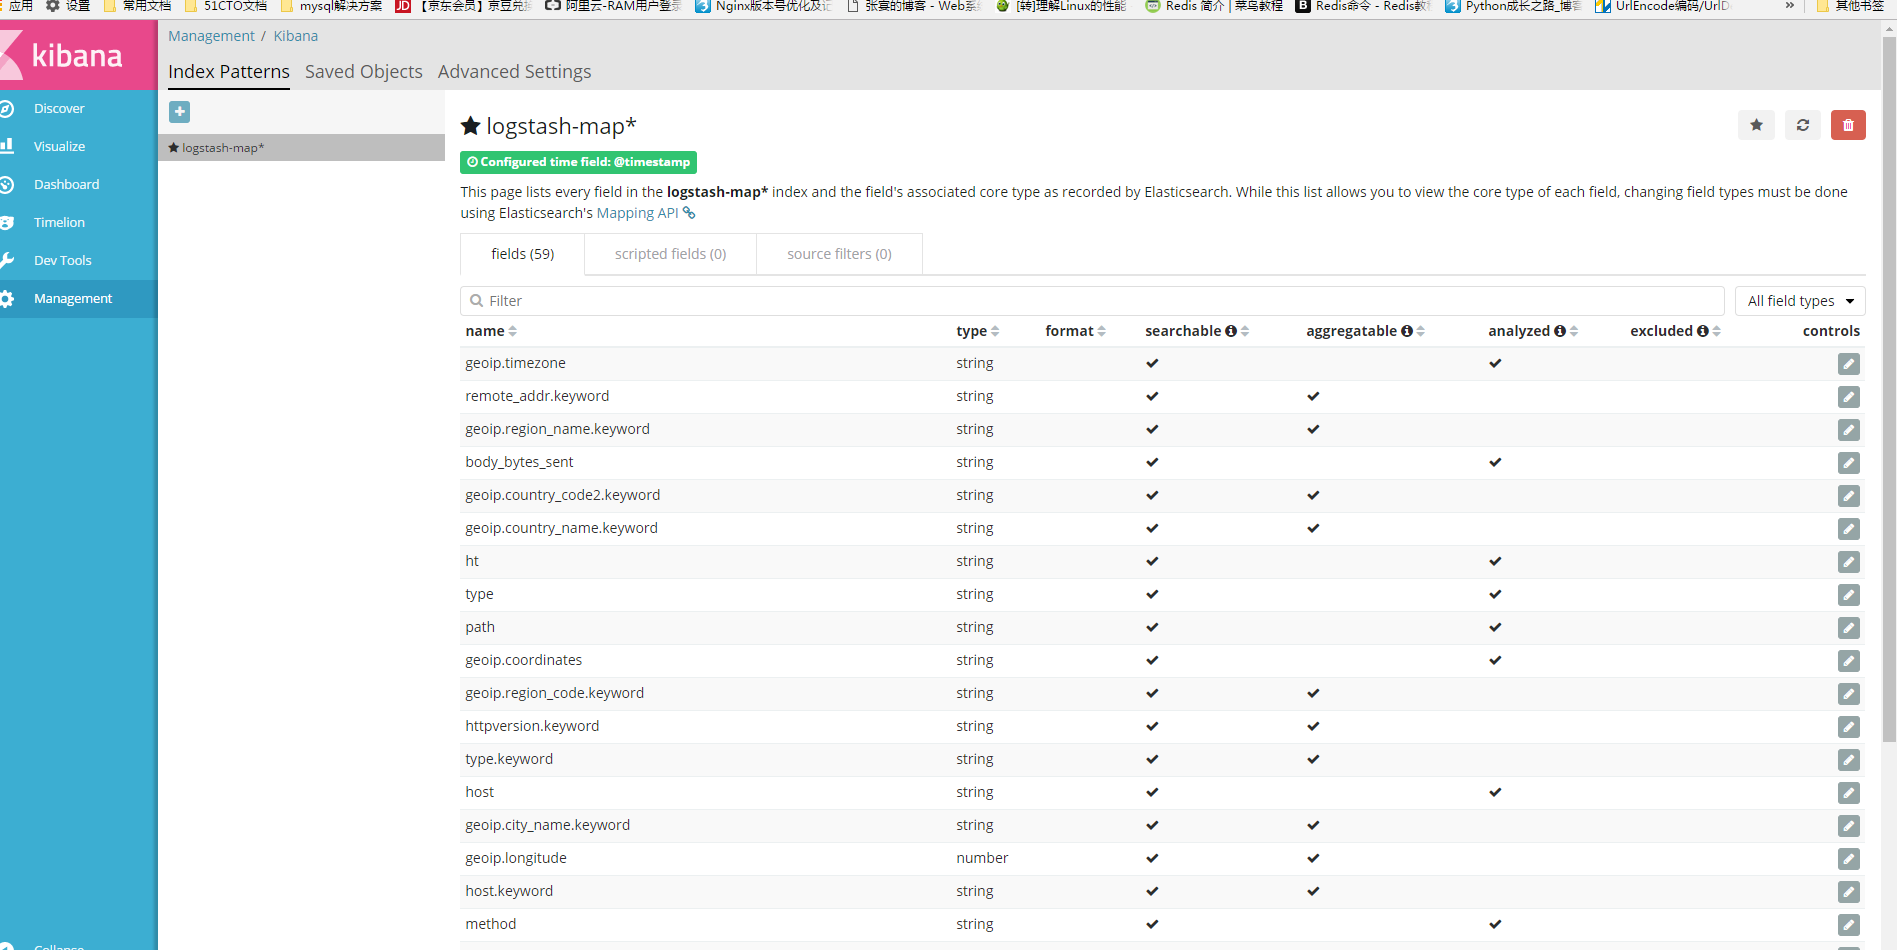
3,创建nginx的访问索引lostash-map*。具体步骤如下:ip:5601--->Management--Index Patterns--->+--->在Index name or pattern中添加logstash-map*--->create。具体如下图:
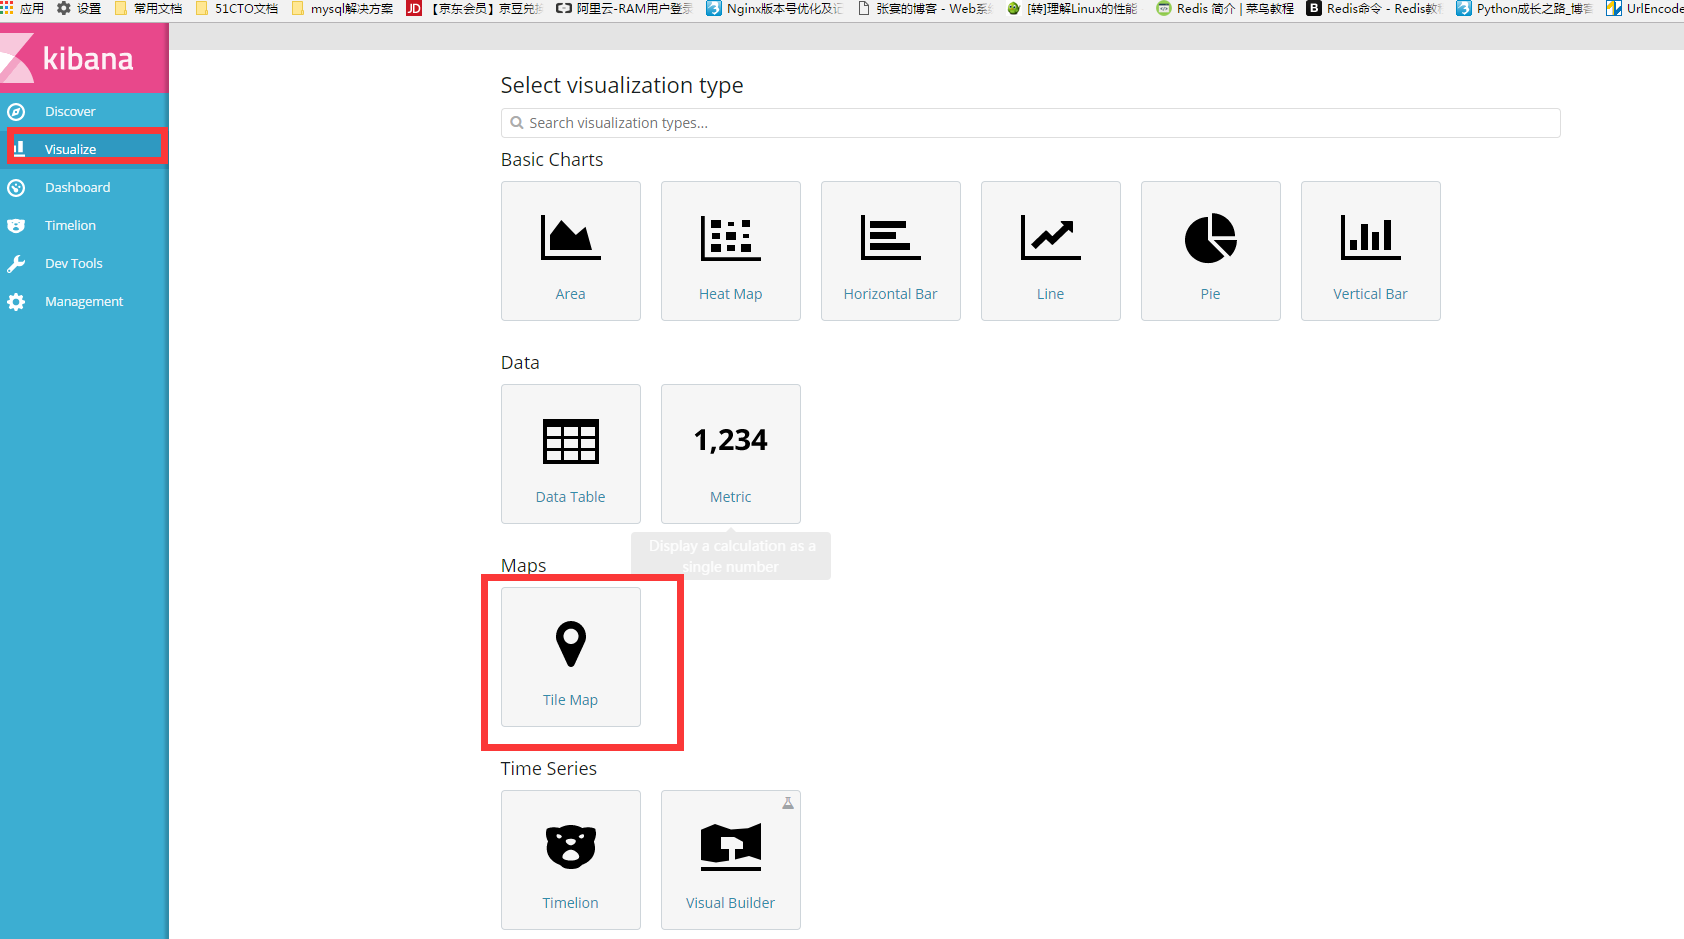
4,创建Visualize。具体步骤如下:Visalize--->+--->Maps(Tile Maps)
本文转自 lqbyz 51CTO博客,原文链接:http://blog.51cto.com/liqingbiao/1940469