版权声明:本文为博主原创文章,未经博主允许不得转载。 https://blog.csdn.net/xmt1139057136/article/details/81413998
在我的第四篇文章断路器讲述了如何使用断路器,并简单的介绍了下Hystrix Dashboard组件,这篇文章更加详细的介绍Hystrix Dashboard。
一、Hystrix Dashboard简介
在微服务架构中为例保证程序的可用性,防止程序出错导致网络阻塞,出现了断路器模型。断路器的状况反应了一个程序的可用性和健壮性,它是一个重要指标。Hystrix Dashboard是作为断路器状态的一个组件,提供了数据监控和友好的图形化界面。
二、准备工作
本文的的工程栗子,来源于第一篇文章的栗子,在它的基础上进行改造。
三、开始改造service-hi
在pom的工程文件引入相应的依赖:
<dependencies>
        <dependency>
            <groupId>org.springframework.cloud</groupId>
            <artifactId>spring-cloud-starter-netflix-eureka-client</artifactId>
        </dependency>
        <dependency>
            <groupId>org.springframework.boot</groupId>
            <artifactId>spring-boot-starter-web</artifactId>
        </dependency>
        <dependency>
            <groupId>org.springframework.boot</groupId>
            <artifactId>spring-boot-starter-actuator</artifactId>
        </dependency>
        <dependency>
            <groupId>org.springframework.cloud</groupId>
            <artifactId>spring-cloud-starter-netflix-hystrix</artifactId>
        </dependency>
        <dependency>
            <groupId>org.springframework.cloud</groupId>
            <artifactId>spring-cloud-starter-netflix-hystrix-dashboard</artifactId>
        </dependency>

    </dependencies>
其中,这三个依赖是必须的,缺一不可。
在程序的入口ServiceHiApplication类,加上@EnableHystrix注解开启断路器,这个是必须的,并且需要在程序中声明断路点HystrixCommand;加上@EnableHystrixDashboard注解,开启HystrixDashboard
@SpringBootApplication
@EnableEurekaClient
@EnableDiscoveryClient
@RestController
@EnableHystrix
@EnableHystrixDashboard
@EnableCircuitBreaker
public class ServiceHiApplication {

    /**
     * 访问地址 http://localhost:8762/actuator/hystrix.stream
     * @param args
     */

    public static void main(String[] args) {
        SpringApplication.run( ServiceHiApplication.class, args );
    }

    @Value("${server.port}")
    String port;

    @RequestMapping("/hi")
    @HystrixCommand(fallbackMethod = "hiError")
    public String home(@RequestParam(value = "name", defaultValue = "forezp") String name) {
        return "hi " + name + " ,i am from port:" + port;
    }

    public String hiError(String name) {
        return "hi,"+name+",sorry,error!";
    }

}
运行程序: 依次开启eureka-server 和service-hi.
四、Hystrix Dashboard图形展示
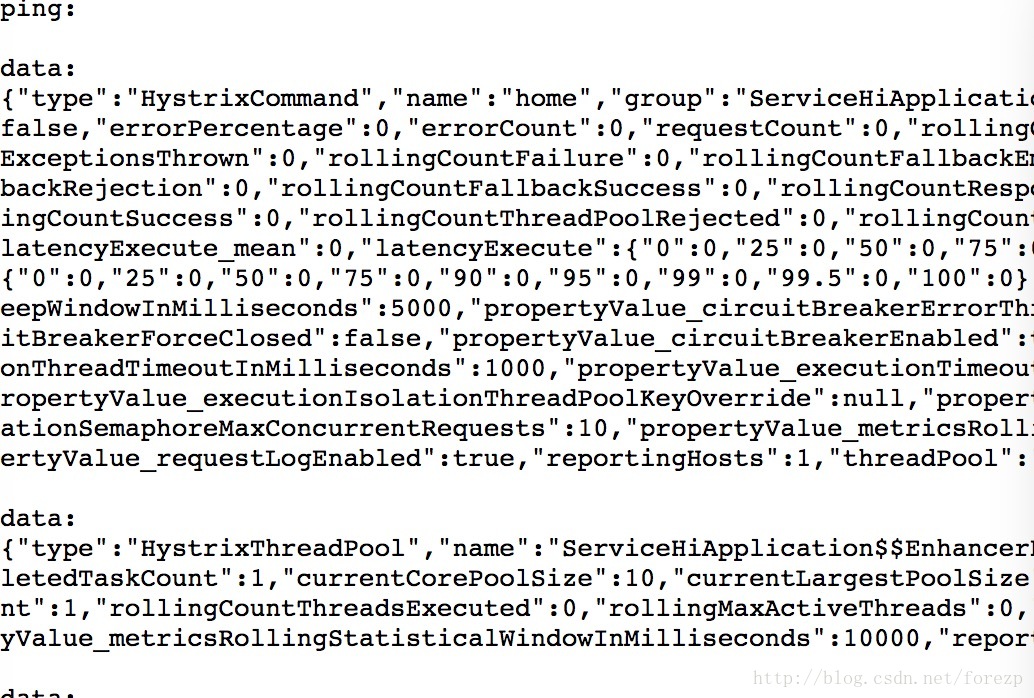
打开http://localhost:8762/actuator/hystrix.stream,可以看到一些具体的数据:
![这里写图片描述]()
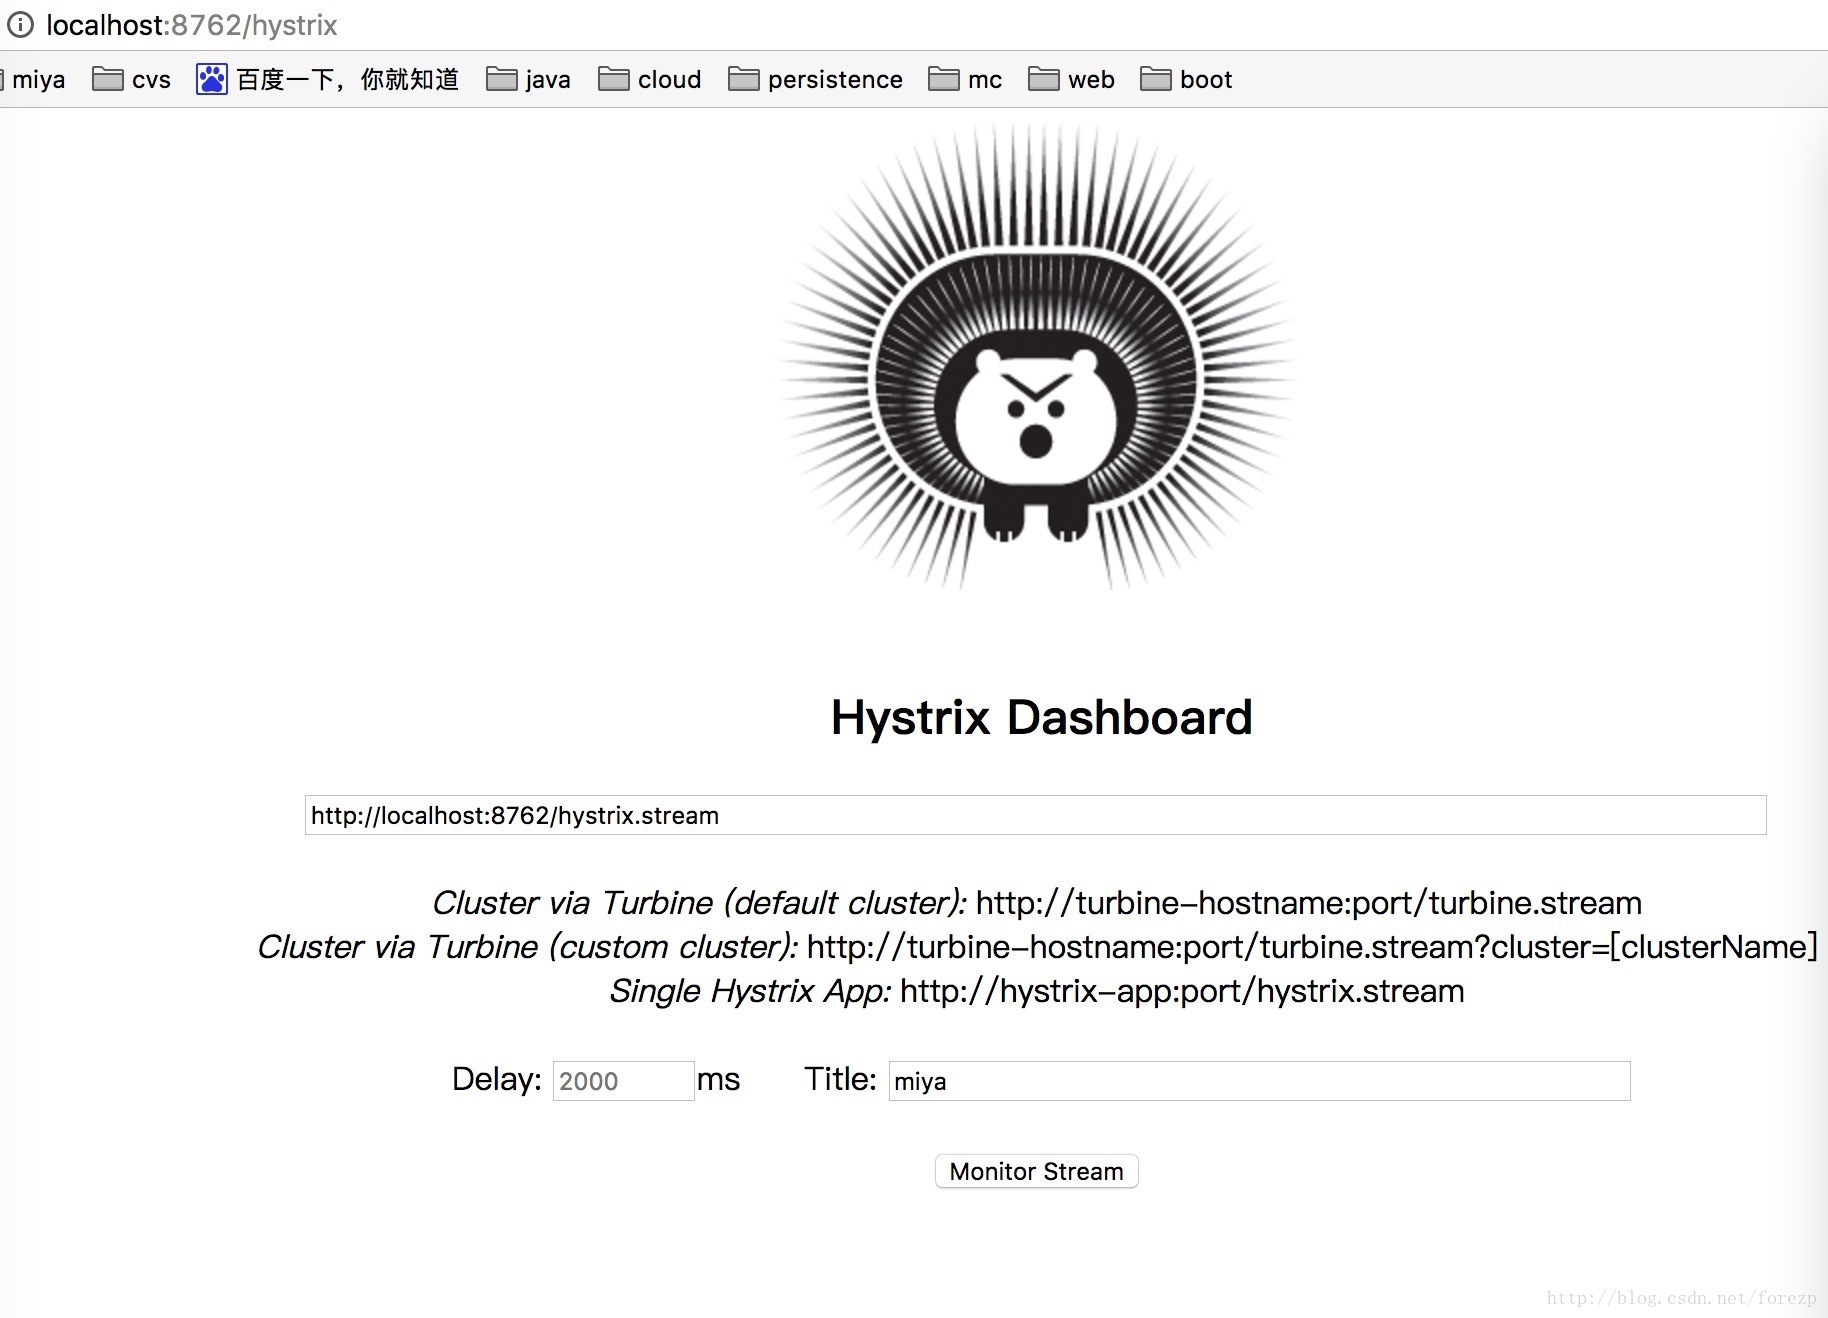
打开locahost:8762/hystrix 可以看见以下界面:
![这里写图片描述]()
在界面依次输入:http://localhost:8762/actuator/hystrix.stream 、2000 、miya
;点确定。
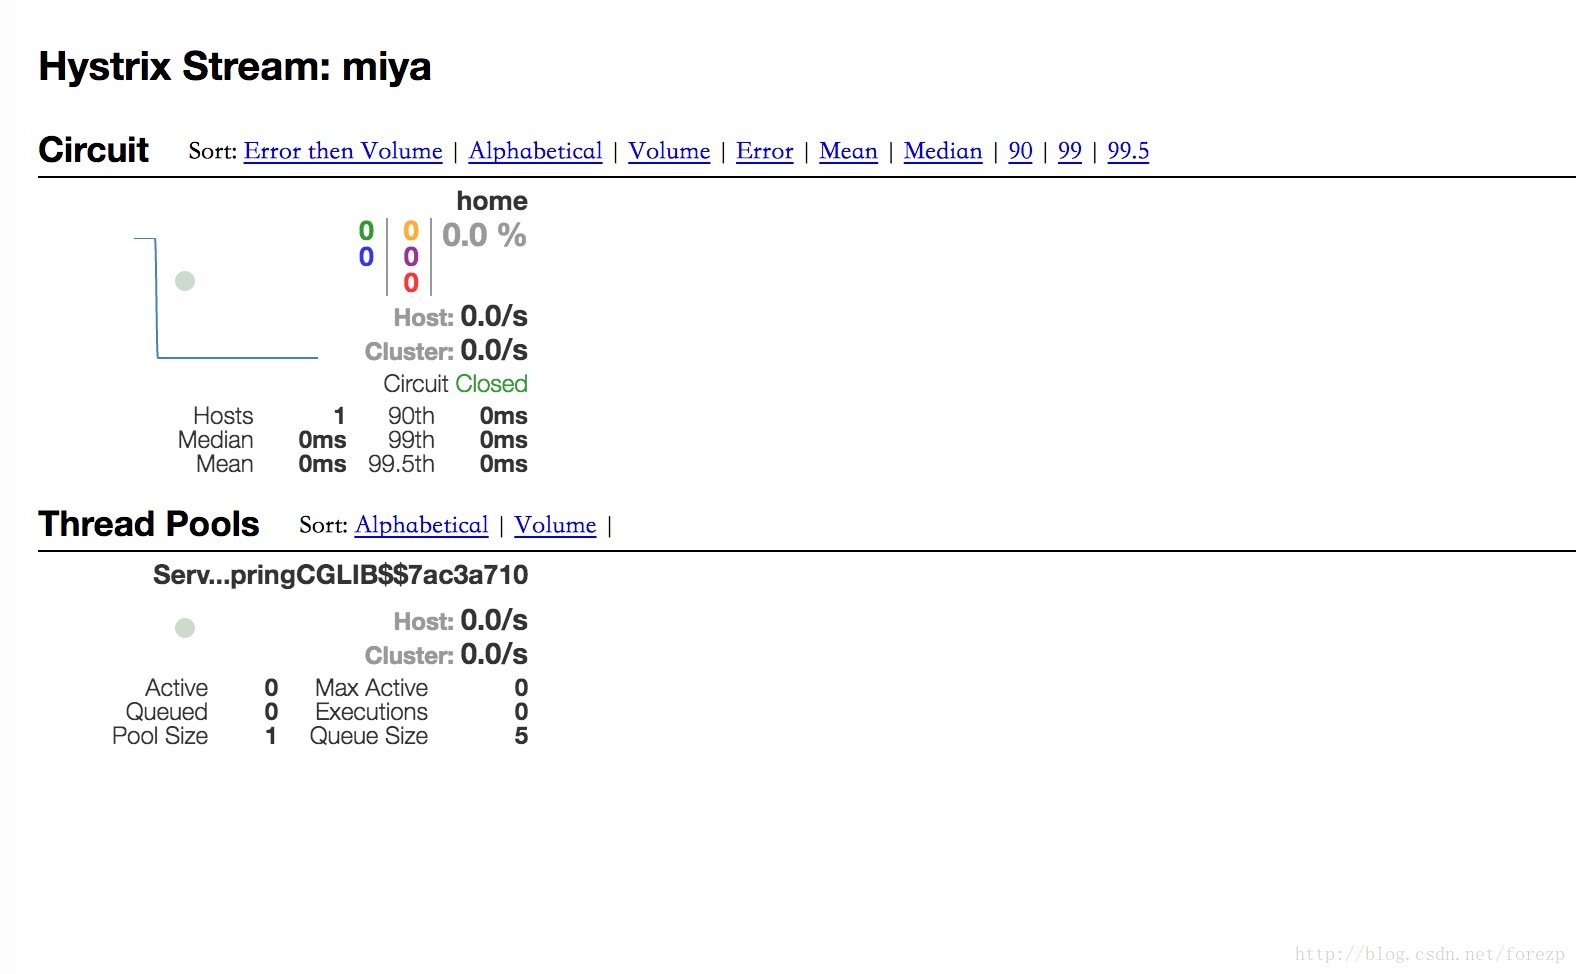
在另一个窗口输入: http://localhost:8762/hi?name=forezp
重新刷新hystrix.stream网页,你会看到良好的图形化界面:
![这里写图片描述]()
源码下载:
https://github.com/forezp/SpringCloudLearning/tree/master/sc-f-chapter12
五、参考资料
hystrix-dashboard
![业余草微信公众号]()
感谢您的关注!可加QQ1群:135430763,QQ2群:454796847,QQ3群:187424846。QQ群进群密码:xttblog,想加微信群的朋友,可以微信搜索:xmtxtt,备注:“xttblog”,添加助理微信拉你进群。备注错误不会同意好友申请。再次感谢您的关注!后续有精彩内容会第一时间发给您!原创文章投稿请发送至532009913@qq.com邮箱。商务合作可添加助理微信进行沟通!