前言
最近有个新项目需要搞一套完整的监控告警系统,我们使用了开源监控告警系统Prometheus;其功能强大,可以很方便对其进行扩展,并且可以安装和使用简单;本文首先介绍Prometheus的整个监控流程;然后介绍如何收集监控数据,如何展示监控数据,如何触发告警;最后展示一个业务系统监控的demo。
监控架构
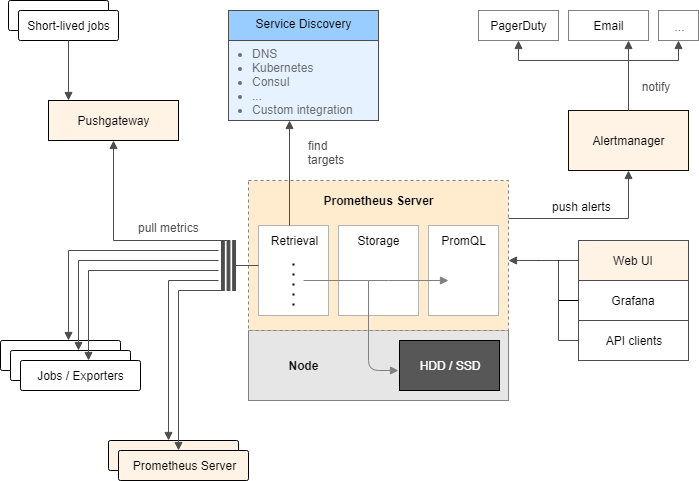
Prometheus的整个架构流程可以参考如下图片:
![]()
整个流程大致分为收集数据,存储数据,展示监控数据,监控告警;核心组件包括:Exporters,Prometheus Server,AlertManager,PushGateway;
- Exporters:监控数据采集器,将数据通过Http的方式暴露给Prometheus Server;
- Prometheus Server:负责对监控数据的获取,存储以及查询;获取的监控数据需要是指定的Metrics 格式,这样才能处理监控数据;对于查询Prometheus提供了PromQL方便对数据进行查询汇总,当然Prometheus本身也提供了Web UI;
- AlertManager:Prometheus支持通过PromQL来创建告警规则,如果满足规则则创建一条告警,后续的告警流程就交给AlertManager,其提供了多种告警方式包括email,webhook等方式;
- PushGateway:正常情况下Prometheus Server能够直接与Exporter进行通信,然后pull数据;当网络需求无法满足时就可以使用PushGateway作为中转站了;
收集数据
Exporter的主要功能就是收集数据,然后将数据通过http的方式暴露给Prometheus,然后Prometheus通过定期拉取的方式来获取监控数据;
数据的来源多种多样包括:系统级监控数据比如节点的cpu,io等,中间件比如mysql,mq等,进程级监控比如jvm等,业务监控数据等;除了监控的业务数据每个系统可能不一样,除此之外其他的监控数据其实每个系统都是大同小异的;所以在Exporter的来源分成了两类:社区提供的,用户自定义的;
Exporter来源
| 范围 |
常用Exporter |
| 数据库 |
MySQL Exporter, Redis Exporter, MongoDB Exporter等 |
| 硬件 |
Node Exporter等 |
| 消息队列 |
Kafka Exporter, RabbitMQ Exporter等 |
| HTTP服务 |
Apache Exporter, Nginx Exporter等 |
| 存储 |
HDFS Exporter等 |
| API服务 |
Docker Hub Exporter, GitHub Exporter等 |
| 其他 |
JIRA Exporter, Jenkins Exporter, Confluence Exporter等 |
官方提供的第三方Exporter:Exporters
除了以上提供的第三方Exporter,用户也可以自定义Exporter,当然需要基于Prometheus提供的Client Library创建自己的Exporter程序,提供了对多种语言的支持包括:Go、Java/Scala、Python、Ruby等;
Exporter运行方式
从Exporter的运行方式上来讲,又可以分为:独立运行和集成到应用中;
像mysql,redis,mq这些中间件本身时不支持Prometheus,这时候就可以提供一个独立的Exporter,通过中间件对外提供的监控数据API,来获取监控数据,然后转换成Prometheus可以识别的数据格式;
一些需要自定义监控指标的系统,可以通过Prometheus提供的Client Library将监控数据在系统内部提供给Prometheus;
数据格式
Prometheus通过轮询的方式从Exporter获取监控数据,当然数据需要遵循一定的格式,不然Prometheus也是无法识别的,这个格式就是 Metrics 格式.
<metric name>{<label name>=<label value>, ...}
主要分为三个部分 各个部分需符合相关的正则表达式
- metric name:指标的名称,主要反映被监控样本的含义
a-zA-Z_:*_
- label name: 标签 反映了当前样本的特征维度
[a-zA-Z0-9_]*
- label value: 各个标签的值,不限制格式
可以看一个JVM的监控数据:
# HELP jvm_memory_max_bytes The maximum amount of memory in bytes that can be used for memory management
# TYPE jvm_memory_max_bytes gauge
jvm_memory_max_bytes{application="springboot-actuator-prometheus-test",area="nonheap",id="Metaspace",} -1.0
jvm_memory_max_bytes{application="springboot-actuator-prometheus-test",area="heap",id="PS Eden Space",} 1.033895936E9
jvm_memory_max_bytes{application="springboot-actuator-prometheus-test",area="nonheap",id="Code Cache",} 2.5165824E8
jvm_memory_max_bytes{application="springboot-actuator-prometheus-test",area="nonheap",id="Compressed Class Space",} 1.073741824E9
jvm_memory_max_bytes{application="springboot-actuator-prometheus-test",area="heap",id="PS Survivor Space",} 2621440.0
jvm_memory_max_bytes{application="springboot-actuator-prometheus-test",area="heap",id="PS Old Gen",} 2.09190912E9
更多:data_model
数据类型
Prometheus定义了4种不同的指标类型(metric type):Counter(计数器)、Gauge(仪表盘)、Histogram(直方图)、Summary(摘要)
只增不减的计数器,比如可以在应用程序中记录某些事件发生的次数;常见的监控指标,如http_requests_total;
# HELP jvm_gc_memory_allocated_bytes_total Incremented for an increase in the size of the young generation memory pool after one GC to before the next
# TYPE jvm_gc_memory_allocated_bytes_total counter
jvm_gc_memory_allocated_bytes_total{application="springboot-actuator-prometheus-test",} 6.3123664E9
侧重于反应系统的当前状态,可增可减;常见指标如:node_memory_MemFree(主机当前空闲的内容大小)、node_memory_MemAvailable(可用内存大小);
# HELP jvm_threads_live_threads The current number of live threads including both daemon and non-daemon threads
# TYPE jvm_threads_live_threads gauge
jvm_threads_live_threads{application="springboot-actuator-prometheus-test",} 20.0
主用用于统计和分析样本的分布情况
# HELP jvm_gc_pause_seconds Time spent in GC pause
# TYPE jvm_gc_pause_seconds summary
jvm_gc_pause_seconds_count{action="end of minor GC",application="springboot-actuator-prometheus-test",cause="Metadata GC Threshold",} 1.0
jvm_gc_pause_seconds_sum{action="end of minor GC",application="springboot-actuator-prometheus-test",cause="Metadata GC Threshold",} 0.008
jvm_gc_pause_seconds_count{action="end of minor GC",application="springboot-actuator-prometheus-test",cause="Allocation Failure",} 38.0
jvm_gc_pause_seconds_sum{action="end of minor GC",application="springboot-actuator-prometheus-test",cause="Allocation Failure",} 0.134
jvm_gc_pause_seconds_count{action="end of major GC",application="springboot-actuator-prometheus-test",cause="Metadata GC Threshold",} 1.0
jvm_gc_pause_seconds_sum{action="end of major GC",application="springboot-actuator-prometheus-test",cause="Metadata GC Threshold",} 0.073
更多:metric_types
展示数据
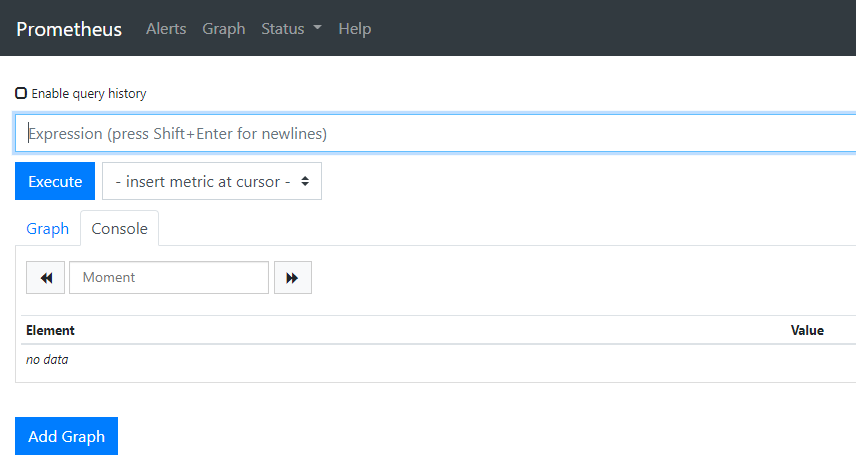
Prometheus可以通过内置的Prometheus UI以及Grafana来展示数据,Prometheus UI是Prometheus自带的Web UI,可以方便的用来执行测试PromQL;
Grafana是一款采用go语言编写的开源应用,允许您从Elasticsearch,Prometheus,Graphite,InfluxDB等各种数据源中获取数据,并通过精美的图形将其可视化;
主界面大致如下:
![]()
所有注册的Exporter都可以在UI查看,告警也可以在Alerts界面查看,同时也可以执行PromQL来查询监控数据,进行展示;
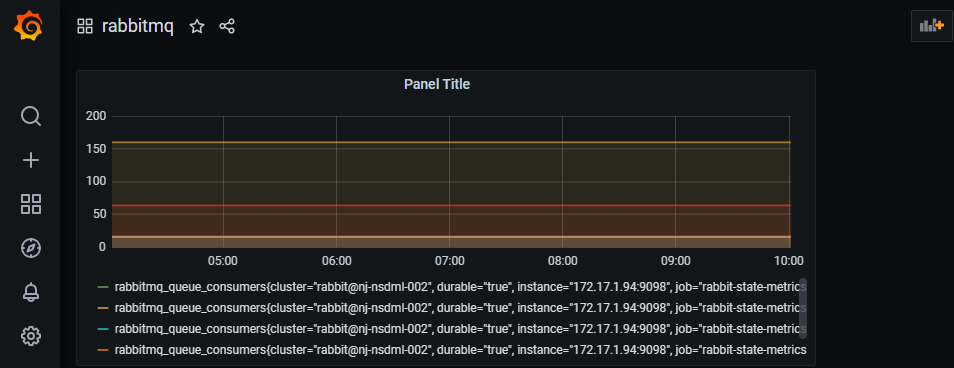
在Grafana中每个监控查询都可以做成一个面板,面板可以有多种展示方式,比如:
![]()
PromQL简介
PromQL是Prometheus内置的数据查询语言,可以类比成SQL;提供了丰富的查询,逻辑运算,聚合函数等等;
操作符包括:数学运算符,逻辑运算符,布尔运算符等等;比如:
rabbitmq_queue_messages>0
提供了大量的内置函数,比如: sum (求和), min (最小值),max (最大值),avg (平均值)等等;
sum(rabbitmq_queue_messages)>0
更多:PromQL
告警
告警的流程大致就是:在prometheus中通过PromQL配置告警规则,如果规则成立,则发送一条消息给接收者,这里的接收者其实就是AlertManager,AlertManager可以配置多种告警方法如email,webhook等;
自定义告警规则
Prometheus中的告警规则允许你基于PromQL表达式定义告警触发条件,Prometheus后端对这些触发规则进行周期性计算,当满足触发条件后则会触发告警通知;
比如如下告警规则:
- name: queue-messages-warning
  rules:
  - alert: queue-messages-warning
    expr: sum(rabbitmq_queue_messages{job='rabbit-state-metrics'}) > 500
    labels:
      team: webhook-warning
    annotations:
      summary: High queue-messages usage detected
      threshold: 500
      current: '{{ $value }}'
- alert:告警规则的名称;
- expr:基于PromQL表达式告警触发条件;
- labels:自定义标签,通过其关联到具体Alertmanager上;
- annotations:用于指定一组附加信息,比如用于描述告警详细信息的文字等;
AlertManager
AlertManager是一个告警管理器,它提供了 丰富的告警方式包括:电子邮件,pagerduty,OpsGenie, webhook 等;在如上的告警规则表达式成功之后,可以将告警发送给AlertManager,由AlertManager来讲告警以更加丰富的方式告诉给开发人员;
global:
  resolve_timeout: 5m
route:
  receiver: webhook
  group_wait: 30s
  group_interval: 1m
  repeat_interval: 5m
  group_by:
    - alertname
  routes:
    - receiver: webhook
      group_wait: 10s
      match:
       team: webhook-warning
receivers:
  - name: webhook
    webhook_configs:
      - url: 'http://ip:port/api/v1/monitor/alert-receiver'
        send_resolved: true
以上即是在AlertManager中配置的路由和接收者webhook;
更多:alerting
安装与配置
下面看一个几个核心组件的安装包括:Prometheus,AlertManager,Exporter,Grafana;所有组件的安装都是基于k8s平台;
Prometheus和AlertManager
如下yml文件分别安装了Prometheus和AlertManager,如下所示:
apiVersion: apps/v1
kind: Deployment
metadata:
  annotations:
    deployment.kubernetes.io/revision: '18'
  generation: 18
  labels:
    app: prometheus
  name: prometheus
  namespace: monitoring

spec:
  progressDeadlineSeconds: 600
  replicas: 1
  revisionHistoryLimit: 10
  selector:
    matchLabels:
      app: prometheus
  template:
    metadata:
      labels:
        app: prometheus
    spec:
      containers:
        - image: 'prom/prometheus:latest'
          imagePullPolicy: Always
          name: prometheus-0
          ports:
            - containerPort: 9090
              name: p-port
              protocol: TCP
          resources:
            requests:
              cpu: 250m
              memory: 512Mi
          terminationMessagePath: /dev/termination-log
          terminationMessagePolicy: File
          volumeMounts:
            - mountPath: /etc/prometheus
              name: config-volume
        - image: 'prom/alertmanager:latest'
          imagePullPolicy: Always
          name: prometheus-1
          ports:
            - containerPort: 9093
              name: a-port
              protocol: TCP
          resources: {}
          terminationMessagePath: /dev/termination-log
          terminationMessagePolicy: File
          volumeMounts:
            - mountPath: /etc/alertmanager
              name: alertcfg
      dnsPolicy: ClusterFirst
      restartPolicy: Always
      schedulerName: default-scheduler
      securityContext: {}
      terminationGracePeriodSeconds: 30
      volumes:
        - name: data
          persistentVolumeClaim:
            claimName: monitoring-nfs-pvc
        - configMap:
            defaultMode: 420
            name: prometheus-config
          name: config-volume
        - configMap:
            defaultMode: 420
            name: alert-config
          name: alertcfg
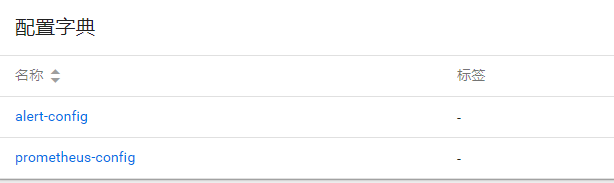
其中指定了两个镜像分别是prom/prometheus:latest和prom/alertmanager:latest,以及指定对外的端口;因为启动两个容器需要用到配置文件prometheus.yml和alertmanager.yml,通过在volumes中配置了prometheus-config和alert-config两个配置字典:
![]()
prometheus.yml配置如下:
global:
  scrape_interval:     15s
  evaluation_interval: 15s

rule_files:
  - 'rabbitmq_warn.yml'

alerting:
  alertmanagers:
    - static_configs:
      - targets: ['127.0.0.1:9093']

scrape_configs:

- job_name: 'rabbit-state-metrics'
  static_configs:
    - targets: ['ip:port']
其中配置了alertmanager,以及规则文件rabbitmq_warn.yml,还有配置了需要收集监控信息的exporter,也就是这边的job_name,可以配置多个;
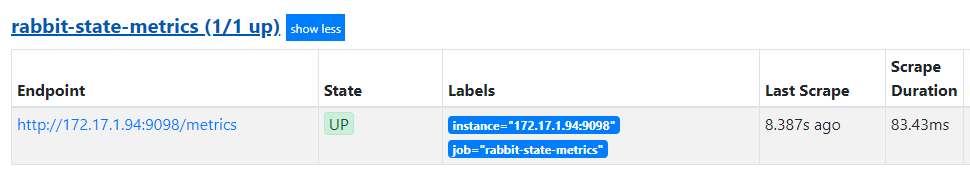
启动prometheus之后可以在prometheus web ui中查看相关exporter以及告警规则:
![]()
可以在status/targets目录下查看到当前的所有exporter,如果状态都为up表示,表示prometheus已经可以接受监控数据了,比如我这里配置的接收rabbitmq相关监控数据;
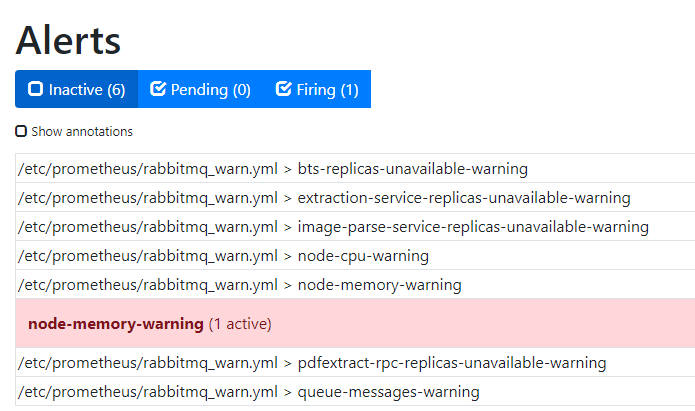
配置的相关告警也可以在prometheus web ui中查看:
![]()
如果告警规则成立会显示红色,当然同时也会发送消息给alertmanager;
Grafana
grafana安装yml文件如下所示:
apiVersion: apps/v1
kind: Deployment
metadata:
  annotations:
    deployment.kubernetes.io/revision: '1'
  generation: 1
  labels:
    app: grafana
  name: grafana
  namespace: monitoring
spec:
  progressDeadlineSeconds: 600
  replicas: 1
  revisionHistoryLimit: 10
  selector:
    matchLabels:
      app: grafana
  template:
    metadata:
      labels:
        app: grafana
    spec:
      containers:
        - image: grafana/grafana
          imagePullPolicy: Always
          name: grafana
          ports:
            - containerPort: 3000
              protocol: TCP
          resources: {}
      dnsPolicy: ClusterFirst
      restartPolicy: Always
      schedulerName: default-scheduler
      securityContext: {}
      terminationGracePeriodSeconds: 30
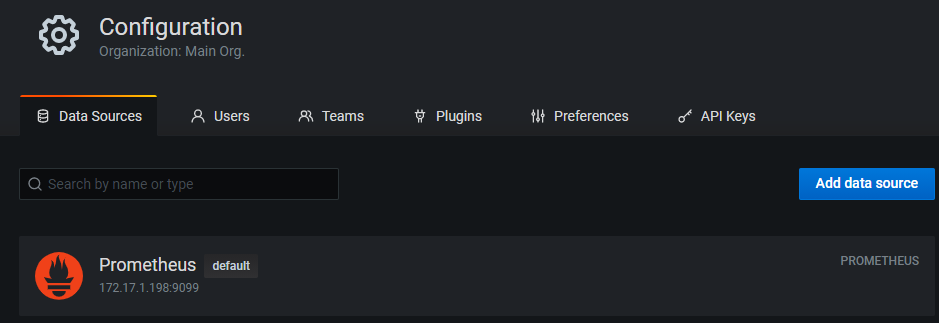
安装完之后,就可以使用grafana了,Grafana需要能获取到prometheus的数据,所以需要配置数据源data sources:
![]()
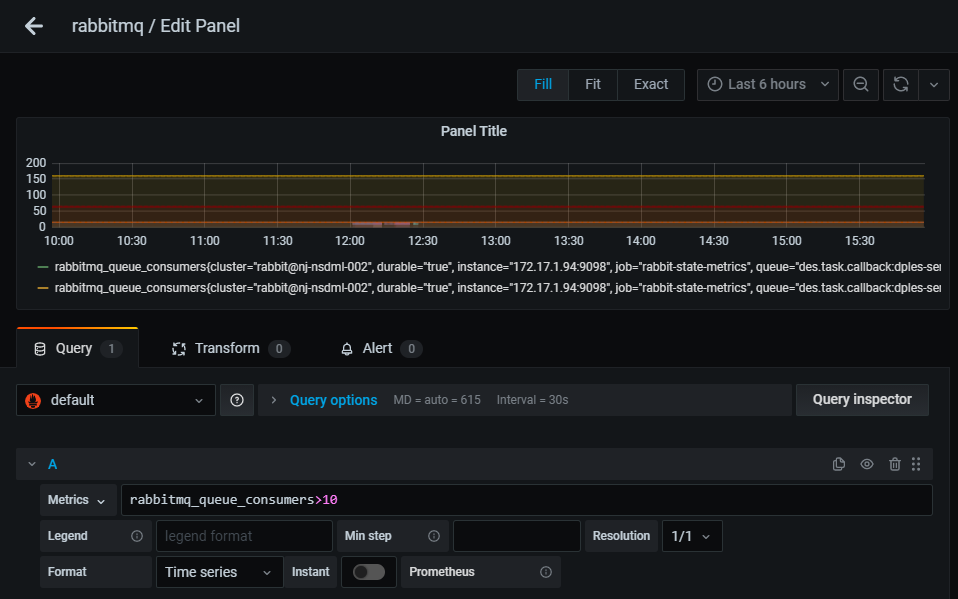
这时候就可以在里面创建监控看板了,并且在里面可以直接使用PromQL:
![]()
Exporter
大部分我们使用的中间件都是通过独立模式部署的,比如我这里使用的rabbitmq:
apiVersion: apps/v1
kind: Deployment
metadata:
  annotations:
    deployment.kubernetes.io/revision: '3'
  labels:
    k8s-app: rabbitmq-exporter
  name: rabbitmq-exporter
  namespace: monitoring
spec:
  progressDeadlineSeconds: 600
  replicas: 1
  revisionHistoryLimit: 2
  selector:
    matchLabels:
      k8s-app: rabbitmq-exporter
  template:
    metadata:
      labels:
        k8s-app: rabbitmq-exporter
    spec:
      containers:
        - env:
            - name: PUBLISH_PORT
              value: '9098'
            - name: RABBIT_CAPABILITIES
              value: 'bert,no_sort'
            - name: RABBIT_USER
              value: xxxx
            - name: RABBIT_PASSWORD
              value: xxxx
            - name: RABBIT_URL
              value: 'http://ip:15672'
          image: kbudde/rabbitmq-exporter
          imagePullPolicy: IfNotPresent
          name: rabbitmq-exporter
          ports:
            - containerPort: 9098
              protocol: TCP
这里启动了一个rabbitmq-exporter服务,端口为9098,并且监听RabbitMQ的15672接口,获取其中的指标数据,转换成prometheus可以识别的metrics;如果需要对业务进行监控,这时候就需要自定义监控了。
MicroMeter
SpringBoot本身提供了健康检查,度量,指标收集和监控,怎么把这些数据暴露给Prometheus,这就要用到Micrometer ,Micrometer为Java平台上的性能数据收集提供了一个通用的API,应用程序只需要使用Micrometer的通用API来收集性能指标即可。Micrometer会负责完成与不同监控系统的适配工作。
添加依赖
<dependency>
    <groupId>io.micrometer</groupId>
    <artifactId>micrometer-registry-prometheus</artifactId>
</dependency>
添加上述依赖项之后,Spring Boot 将会自动配置 PrometheusMeterRegistry 和 CollectorRegistry来以Prometheus 可以抓取的格式收集和导出指标数据;
所有的相关数据,都会在Actuator 的 /prometheus端点暴露出来。Prometheus 可以抓取该端点以定期获取度量标准数据。
prometheus端点
启动SpringBoot服务,可以直接访问http://ip:8080/actuator/prometheus地址,可以看到SpringBoot已经提供了一些应用公共的监控数据比如jvm:
# HELP tomcat_sessions_created_sessions_total
# TYPE tomcat_sessions_created_sessions_total counter
tomcat_sessions_created_sessions_total{application="springboot-actuator-prometheus-test",} 1782.0
# HELP tomcat_sessions_active_current_sessions
# TYPE tomcat_sessions_active_current_sessions gauge
tomcat_sessions_active_current_sessions{application="springboot-actuator-prometheus-test",} 365.0
# HELP jvm_threads_daemon_threads The current number of live daemon threads
# TYPE jvm_threads_daemon_threads gauge
jvm_threads_daemon_threads{application="springboot-actuator-prometheus-test",} 16.0
# HELP process_cpu_usage The "recent cpu usage" for the Java Virtual Machine process
# TYPE process_cpu_usage gauge
process_cpu_usage{application="springboot-actuator-prometheus-test",} 0.0102880658436214
# HELP jvm_gc_memory_allocated_bytes_total Incremented for an increase in the size of the young generation memory pool after one GC to before the next
# TYPE jvm_gc_memory_allocated_bytes_total counter
jvm_gc_memory_allocated_bytes_total{application="springboot-actuator-prometheus-test",} 9.13812704E8
# HELP jvm_buffer_count_buffers An estimate of the number of buffers in the pool
# TYPE jvm_buffer_count_buffers gauge
jvm_buffer_count_buffers{application="springboot-actuator-prometheus-test",id="mapped",} 0.0
jvm_buffer_count_buffers{application="springboot-actuator-prometheus-test",id="direct",} 10.0
...
prometheus配置target
在prometheus.yml中做如下配置:
- job_name: 'springboot-actuator-prometheus-test'
  metrics_path: '/actuator/prometheus'
  scrape_interval: 5s
  basic_auth:
    username: 'actuator'
    password: 'actuator'
  static_configs:
    - targets: ['ip:8080']
添加完之后可以重新加载配置:
curl -X POST http:``//ip:9090/-/reload
再次查看prometheus的target:
![]()
Grafana
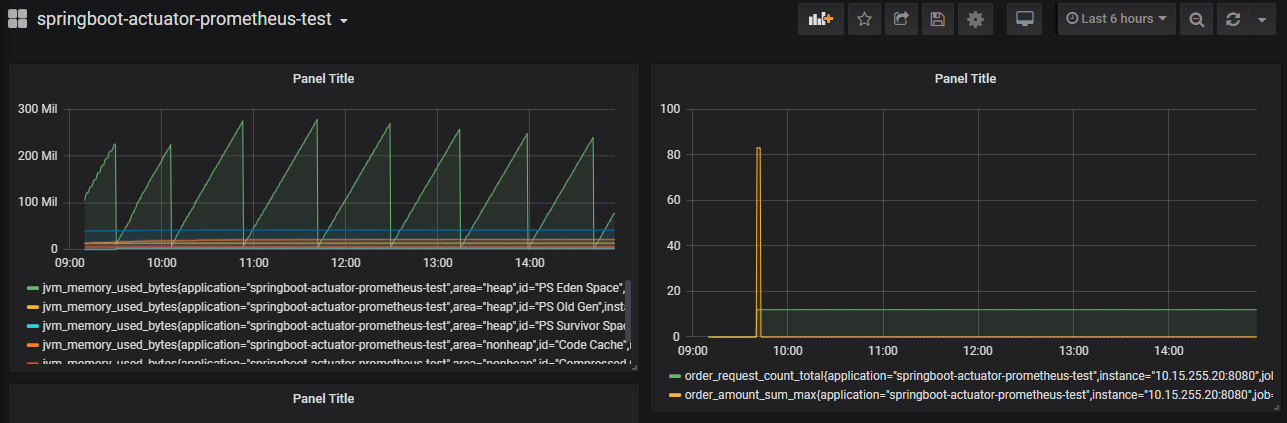
可以增加一个JVM的看板,如下所示:
![]()
业务埋点
Micrometer提供一系列原生的Meter,包括Timer , Counter , Gauge , DistributionSummary , LongTaskTimer等。不同的meter类型导致有不同的时间序列指标值。例如,单个指标值用Gauge表示,计时事件的次数和总时间用Timer表示;
- Counter:允许以固定的数值递增,该数值必须为正数;
- Gauge:获取当前值的句柄。典型的例子是,获取集合、map、或运行中的线程数等;
- Timer:Timer用于测量短时间延迟和此类事件的频率。所有Timer实现至少将总时间和事件次数报告为单独的时间序列;
- LongTaskTimer:长任务计时器用于跟踪所有正在运行的长时间运行任务的总持续时间和此类任务的数量;
- DistributionSummary:用于跟踪分布式的事件;
更多:Micrometer
总结
本文介绍了prometheus做监控服务的整个流程,从原理到实例,可以作为一个入门教程,但是prometheus强大之处在于它提供的PromQL,这个可以根据需求自己去学习;还有就是Micrometer埋点接口其实对prometheus api(simpleclient)的包装,方便开发者去使用,可以根据需求去学习即可。