使用 CLI 创建一个名为 "cpu_high" 的 Threshold Alarm “当连续 3 个 10 分钟内 某 instance 的 cpu_util 值超过70 的时候产告警,并其内容被写入日志文件”:
ceilometer alarm-threshold-create --name cpu_high --description 'instance running hot' --meter-name cpu_util --threshold 70.0 --comparison-operator gt --statistic avg --period 600 --evaluation-periods 3 --alarm-action 'log://' --query resource_id=INSTANCE_ID
{"current": "alarm", "alarm_id": "742873f0-97f0-4d99-87da-b5f7c7829b7f", "reason": "Remaining as alarm due to 1 samples outside threshold, most recent: 0.138333333333", "previous": "alarm"}
{"current": "ok", "alarm_id": "742873f0-97f0-4d99-87da-b5f7c7829b7f", "reason": "Remaining as ok due to 1 samples inside threshold, most recent: 0.138333333333", "previous": "ok"}
- Insufficient Data (默认状态 - 数据不足):
{"current": "insufficient data", "alarm_id": "742873f0-97f0-4d99-87da-b5f7c7829b7f", "reason": "1 datapoints are unknown", "previous": "ok"}
1.4.4 Alarm Action
使用Ceilometer alarm-threshold/combination-create CLI 的如下属性来为不同状态的下的 Alarm 定义不同的 Action:
- --ok-action
- --alarm-action
- --insufficient-data-action
Ceilometer 支持两种Action:
- 'log://':Alarm 被写入 Log 文件
- Webhook URL: 这是一个 HTTP(S) endpoint 的URL,例如 'http://130.56.250.199:8080/alarm/instances_TOO_MANY'。Alarm 的内容会以 JSON 的格式被 POST 到该URL 中。
参考:http://blog.csdn.net/hackerain/article/details/38172941
2. Ceilometer 的数据处理
Ceilometer 的功能就是对上面各种概念的对象的处理:
![]()
| 功能名称 |
功能描述 |
提供功能Ceilometer 模块 |
| Collect |
Meters 数据收集 |
ceilometer-agent-compute ceilometer-agent-central ceilometer-agent-notification ceilometer-collector |
| Transform |
Meters 数据转换 |
|
| Publish |
Meters 数据发布 |
|
| Store |
Meters 数据保存 |
|
| Read |
Meters 数据访问 |
ceilometer-api |
| Alarm |
告警 |
ceilometer-alarm-notifier
ceilometer-alarm-evaluator
|
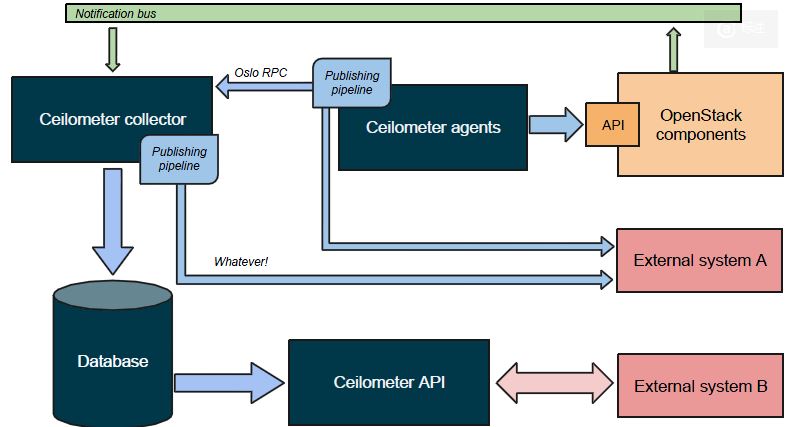
总体架构如下:
![]()
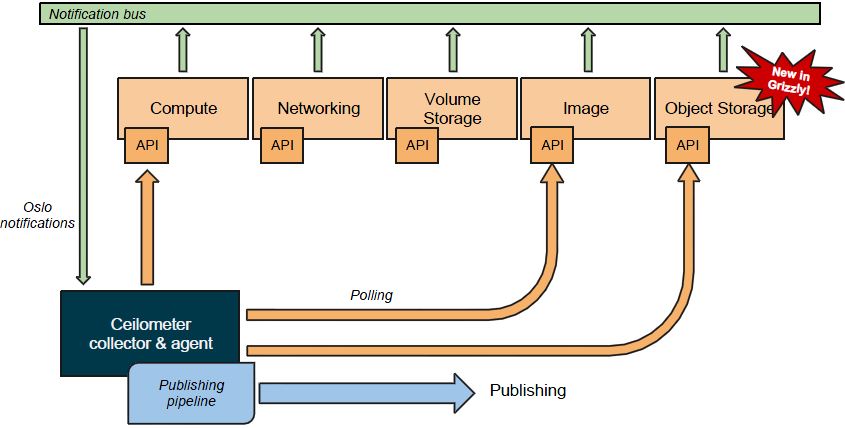
2.1 Meters数据的收集
Ceilometer 有两种数据收集方式:
- Poller:
- Compute agent (ceilometer-agent-compute)运行在每个 compute 节点上,以轮询的方式通过调用 Image 的 driver 来获取资源使用统计数据。
- Central agent (ceilometer-agent-central)运行在 management server 上,以轮询的方式通过调用 OpenStack 各个组件(包括 Nova、Cinder、Glance、Neutron、Swift 等)的 API 收集资源使用统计数据。
- Notificaiton:Collector (ceilometer-collector)是一个运行在一个或者多个management server上的数据收集程序,它会监控 OpenStack 各组件的消息队列。队列中的 notification 消息会被它处理并转化为计量消息,再发回到消息系统中。计费消息会被直接保存到存储系统中。
![]()
除了监控这些对象以外,Ceilometer 还可以监控 Neutron 的 Bandwidth, 以及 hardware。关于数据收集的细节,会有另一篇文章来阐述。
2.2 Meters 数据处理
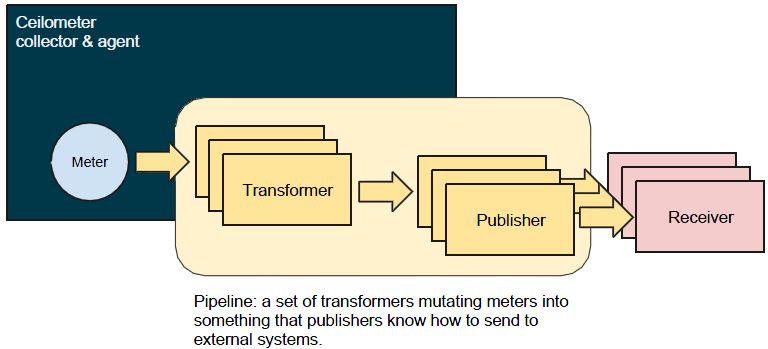
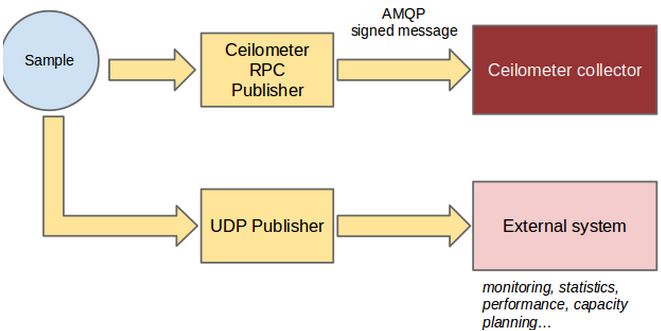
Meters 数据的处理使用 Pipeline 的方式,即Metes 数据依次经过(零个或者多个) Transformer 和 (一个或者多个)Publisher 处理,最后达到(一个或者多个)Receiver。其中Recivers 包括 Ceilometer Collector 和 外部系统。
2.2.1 Pipeline
![]()
Ceilometer 根据配置文件 /etc/ceilometer/pipeline.yaml 来配置 meters 所使用的 transformers 和 publishers。以 cpu meter 为例:
sources: A source is a producer of samples
......
  - name: cpu_source
    interval: 600
    meters:
        - "cpu"
    sinks:
        - cpu_sink

......
sinks: A sink on the other hand is a chain of handlers of samples
......
  - name: cpu_sink
    transformers:
      - name: "rate_of_change"
        parameters:
                target:
                    name: "cpu_util"
                    unit: "%"
                    type: "gauge"
                    scale: "100.0 / (10**9 * (resource_metadata.cpu_number or1))"
     publishers:
         - notifier://
这段代码定义了 cpu meter 的 :
- interval: 600:Poller 获取 cpu samples 的间隔为 10 分钟
- cpu meter 的 transformer 为 "rate_of_change"
- cpu meter 的 publisher 为 notifier://,它使用默认的配置经过 AMQP 使用 oslo.messaging 发出数据
该配置文件的详细信息可参考 http://docs.openstack.org/developer/ceilometer/configuration.html
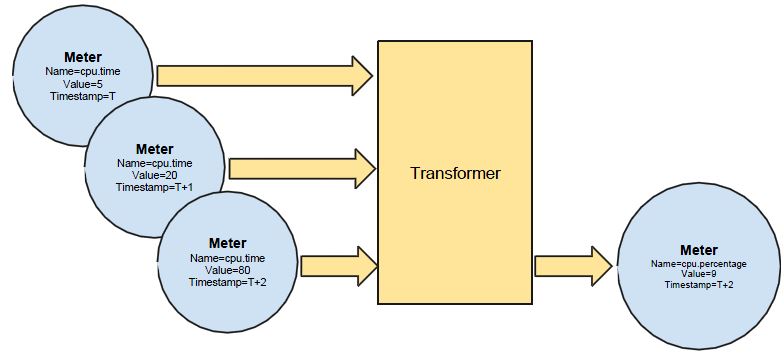
2.2.1 Transformer 转换器
Transformer 即 Sample 的转换器。常见的 transformer 包括:
- unit_conversion: 单位转换器,比如温度从°F 转换成°C
- rate_of_change: 计算方式转换器,比如根据一定的计算规则来转换一个sample。例如:
name: "rate_of_change"
parameters:
target:
name: "cpu_util"
unit: "%"
type: "gauge"
scale: "100.0 / (10**9 * (resource_metadata.cpu_number or 1))"
![]()
2.2.2 Publisher 分发器
参考文档: http://docs.openstack.org/admin-guide-cloud/content/section_telemetry-publishers.html
Ceilometer 支持如下几种 Publishers:
| Publisher |
格式 |
说明 |
配置项 |
示例 |
| Notifier |
notifier://?option1=value1&option2=value2 |
samples 数据被发到 AMQP 系统,然后被 Ceilometer collecter 接收。默认的 AMQP Queue 是 metering_topic=metering。这默认的方式。 |
[publisher_notifier]
metering_driver = messagingv2
metering_topic = metering |
notifier://?policy=drop&max_queue_length=512 |
| RPC |
rpc://?option1=value1&option2=value2 |
与 notifier类似,同样经过 AMQP, 不过是同步操作,因此可能有性能问题。 |
[publisher_rpc]
metering_topic = metering |
rpc://?per_meter_topic=1 |
| UDP |
udp://<host>:<port>/ |
经过 UDP port 发出。默认的 UDP 端口是 4952 |
udp_port=4952 |
udp://10.0.0.2:1234 |
| File |
file://path?option1=value1&option2=value2 |
发送到文件保存 |
|
|
![]()
可以在 /etc/ceilometer/pipeline.yaml 中为某个 meter 配置多个 publisher。比如增加一个file publisher:
sinks:
    - name: meter_sink
      transformers:
      publishers:
          - notifier://
          - file:///var/log/ceilometer/ceilometer-file-publisher #新增的file publisher
那么在该文件中你会看到如下的 sample:
{'user_id': None, 'name': 'image', 'resource_id': u'bb8838d5-06b5-4f7e-b6ef-87c908f04cc7', 'timestamp': '2015-03-29T15:39:05Z', 'resource_metadata': {'status': u'active', 'name': u'cinderimg', 'deleted': False, 'container_format': u'bare', 'created_at': u'2015-01-21T17:15:56', 'disk_format': u'qcow2', 'updated_at': u'2015-01-21T17:15:56', 'protected': True, 'min_ram': 0, 'checksum': u'64d7c1cd2b6f60c92c14662941cb7913', 'min_disk': 0, 'is_public': False, 'deleted_at': None, 'properties': {}, 'size': 13167616}, 'volume': 1, 'source': 'openstack', 'project_id': u'fa2046aaead44a698de8268f94759fc1', 'type': 'gauge', 'id': 'bb2b4142-d629-11e4-925a-080027ff4b45', 'unit': 'image'}
2.3 数据保存
参考文档:http://docs.openstack.org/admin-guide-cloud/content/section_telemetry-storing-data.html
Ceilometer Collector 从 AMQP 接收到数据后,会原封不动地通过一个或者多个分发器(dispatchers)将它保存到指定位置。目前它支持的分发器:
- 文件分发器:保存到文件 - 添加配置项dispatcher = file 和 [dispatcher_file] 部分的配置项
- HTTP 分发器:保存到外部的 HTTP target - 添加配置项 dispatcher = http
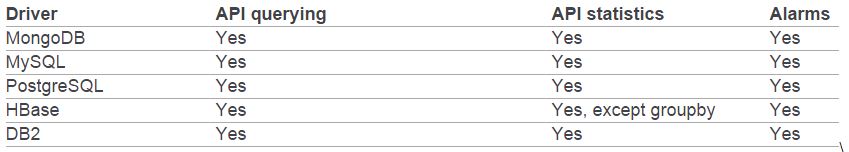
- 数据库分发器:保存到数据库 - 添加配置项 dispatcher = database。参考文档
-
- MongoDB:默认DB。
- SQL DB:支持 mysql、postgreSQL 和 IBM DB2等。
- HBase DB
![]()
![]()
Ceilometer 支持同时配置多个分发器,将数据保存到多个目的位置。比如在 ceilometer.conf 中做如下配置使得同时使用 file 和 database dispatcher:
[DEFAULT]
dispatcher = database
dispatcher = file

[dispatcher_file]
backup_count = 5
file_path = /var/log/ceilometer/ceilometer-samples
max_bytes = 100000
在 /var/log/ceilometer/ceilometer-samples 文件中将收到如下类似的 samples 数据:
![复制代码]()
[{u'counter_name': u'cpu_util', u'user_id': u'8f4f734443674afcbbb57b9909d5a07f', u'message_signature': u'21fdc2cbf50b4da39746eba47ac0a1b742c759a1bb42e17c00e293413c356a38', u'timestamp': u'2015-03-29T14:47:10Z', u'resource_id': u'49618cae-dd28-41a0-ae97-e98899d717eb', u'message_id': u'7ad714f6-d622-11e4-8f83-080027df9b16', u'source': u'openstack', u'counter_unit': u'%', u'counter_volume': 0.0, u'project_id': u'd6feddb5279a42f4854b93a729470448', u'resource_metadata': {u'status': u'shutoff', u'cpu_number': 1, u'ramdisk_id': None, u'display_name': u'vm-1-for-user-one', u'name': u'instance-0000000e', u'disk_gb': 1, u'kernel_id': None, u'image': None, u'ephemeral_gb': 0, u'host': u'5d9f88849c5458f5b903fbc7a7d19bb90c3a4b0c492c5180434d216d', u'memory_mb': 100, u'instance_type': u'7124c366-3e56-4923-b32a-124ee31abaf7', u'vcpus': 1, u'root_gb': 1, u'image_ref': None, u'flavor': {u'name': u'tiny', u'links': [{u'href': u'http://controller:8774/e5defbf994694519b1261fa855a058ae/flavors/7124c366-3e56-4923-b32a-124ee31abaf7', u'rel': u'bookmark'}], u'ram': 100, u'ephemeral': 0, u'vcpus': 1, u'disk': 1, u'id': u'7124c366-3e56-4923-b32a-124ee31abaf7'}, u'OS-EXT-AZ:availability_zone': u'nova', u'image_ref_url': None}, u'counter_type': u'gauge'}]
![复制代码]()
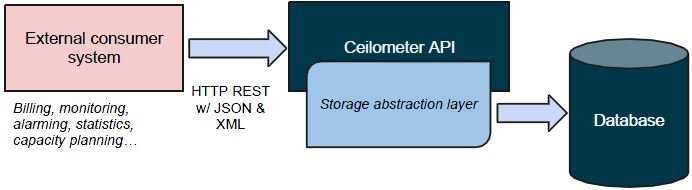
2.4 数据访问
外部系统通过 ceilometer-api 模块提供的 Ceilometer REST API 来访问保存在数据库中的数据。API 有 V1 和 V2 两个版本,现在使用的是 V2.
![]()
API Service 默认在 8777 端口监听 (#port=8777)。V2 API 列表在这里。
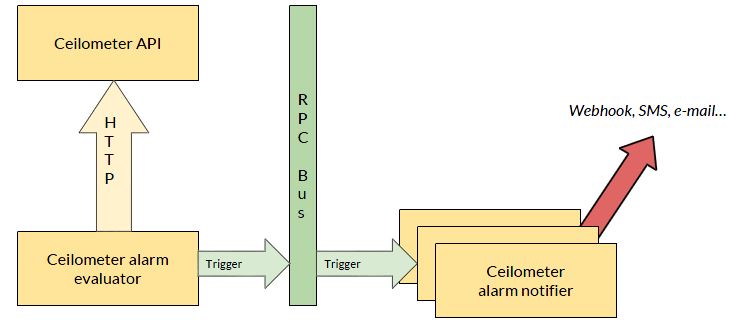
2.5 告警
2.5.1 架构
(1)ceilometer-alarm-evaluator 使用 Ceilometer REST API 获取 statistics 数据
(2)ceilometer-alarm-evaluator 生成 alarm 数据, 并通过 AMQP 发给 ceilometer-alarm-notifer
(3)ceilometer-alarm-notifer 会通过指定方式把 alarm 发出去。
![]()
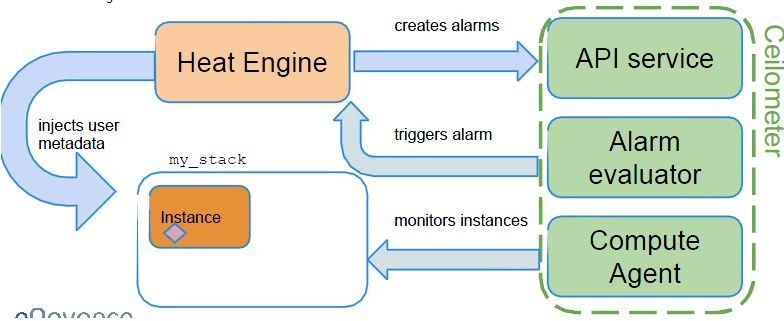
2.5.2 Heat 和 Ceilometer 通过 Ceilometer Alarm 进行交互来实现 Instance auto-scaling
参考文档:http://superuser.openstack.org/articles/simple-auto-scaling-environment-with-heat
示意图:
![]()
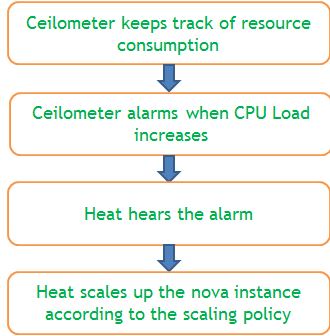
步骤:
![]()
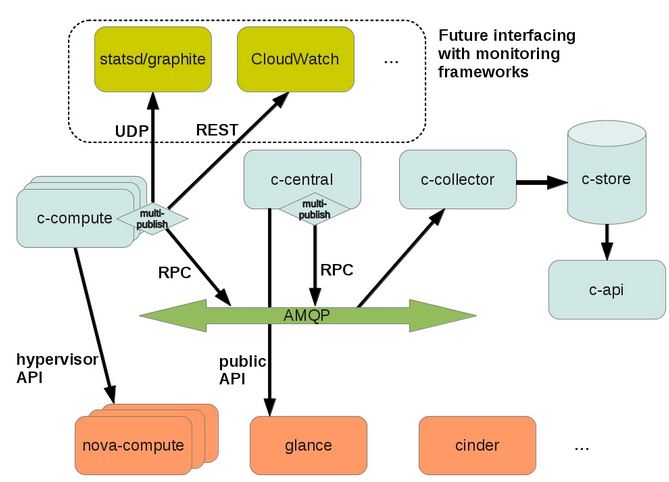
3. 总体架构
3.1 总体架构
![]()
![]()
3.2 特点
(1)Ceilometer 的架构的开放性应该说非常好,处处都留有和外部系统交互的接口。
(2)其性能可能是个问题,特别是大的生产系统中计量数据量非常大的情况下。据说京东对该模块有很大的修改后才用到其生产系统中。
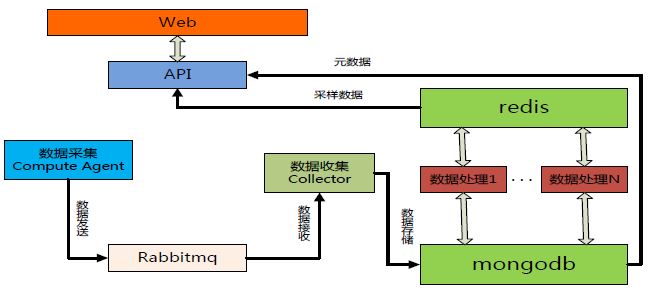
3.3 京东对 Ceilometer 的优化 (摘自京东架构师在2015年初OpenStack meetup 上的材料)
- 消息跟踪:集成 Stacktach 到 Ceilometer,跟踪message
- 性能优化:
- 增加数据处理服务 + cache,提升ceilometer-api 和 alarm 性能
- 自研 filter 功能,直接 hook 在 collector 进程上面,做到及时告警
- 去 MQ,使用自研 RPC 传输监控 sample,并采用 gzip 压缩
- 功能增强:增加邮件告警功能,做到告警及时通知
![]()
参考文档:
本文转自SammyLiu博客园博客,原文链接:http://www.cnblogs.com/sammyliu/p/4383289.html,如需转载请自行联系原作者