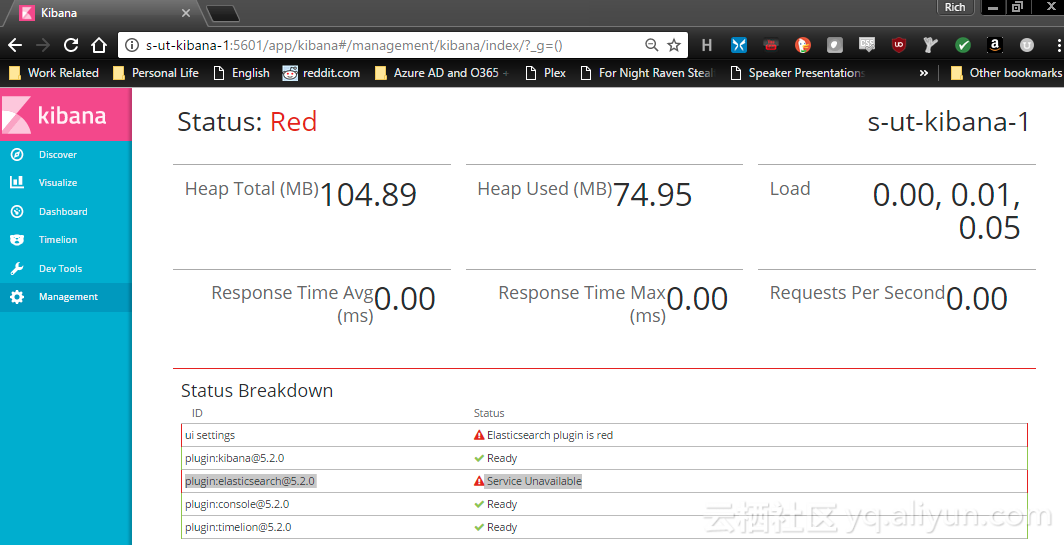
今天客户反映后台管理系统审核功能失效, 到kibana查看错误信息时发现, kibana提示elasticsearch: service Unavailable, 如下:
到kibana查看日志信息如下:
{"type":"log","@timestamp":"2018-06-29T23:08:09+00:00","tags":["status","plugin:elasticsearch","error"],"pid":19806,"name":"plugin:elasticsearch","state":"red","message":"Status changed from red to red - [master_not_discovered_exception] null","prevState":"red","prevMsg":"Request Timeout after 30000ms"}
{"type":"log","@timestamp":"2018-06-29T23:08:11+00:00","tags":["status","plugin:elasticsearch","error"],"pid":19806,"name":"plugin:elasticsearch","state":"red","message":"Status changed from red to red - Service Unavailable","prevState":"red","prevMsg":"[master_not_discovered_exception] null"}
{"type":"log","@timestamp":"2018-06-29T23:45:20+00:00","tags":["status","plugin:elasticsearch","error"],"pid":19806,"name":"plugin:elasticsearch","state":"red","message":"Status changed from red to red - Request Timeout after 30000ms","prevState":"red","prevMsg":"Service Unavailable"}
{"type":"log","@timestamp":"2018-06-29T23:48:43+00:00","tags":["status","plugin:elasticsearch","error"],"pid":19806,"name":"plugin:elasticsearch","state":"red","message":"Status changed from red to red - [master_not_discovered_exception] null","prevState":"red","prevMsg":"Request Timeout after 30000ms"}
{"type":"log","@timestamp":"2018-06-29T23:48:46+00:00","tags":["status","plugin:elasticsearch","error"],"pid":19806,"name":"plugin:elasticsearch","state":"red","message":"Status changed from red to red - Service Unavailable","prevState":"red","prevMsg":"[master_not_discovered_exception] null"}
提示elasticsearch组件请求错误.
查看kibana配置:
# The maximum payload size in bytes on incoming server requests.
# server.maxPayloadBytes: 1048576

# The Elasticsearch instance to use for all your queries.
elasticsearch.url: "http://**.**.75.206:9200"
找到elasticsearch服务所在IP, 到elasticsearch机器上查看其配置:
# ----------------------------------- Paths ------------------------------------
#
# Path to directory where to store the data (separate multiple locations by comma):
#
path.data: /server/pd/elasticsearch-2.3.3/data
#
# Path to log files:
#
path.logs: /server/pd/elasticsearch-2.3.3/logs

#
# Pass an initial list of hosts to perform discovery when new node is started:
# The default list of hosts is ["127.0.0.1", "[::1]"]
#
discovery.zen.ping.unicast.hosts: ["**.**.52.15:9300", "**.**.81.194:9300"]

#
# Prevent the "split brain" by configuring the majority of nodes (total number of nodes / 2 + 1):
#
discovery.zen.minimum_master_nodes: 3
获取elasticsearch节点地址, 查看path.logs配置地址下的日志文件, 节点1:
[2018-07-26 11:21:41,151][WARN ][discovery.zen.ping.unicast] [node-1] failed to send ping to [{#zen_unicast_2#}{**.**.81.194}{**.**.81.194:9300}]
ReceiveTimeoutTransportException[[][**.**.81.194:9300][internal:discovery/zen/unicast] request_id [210480863] timed out after [3750ms]]
	at org.elasticsearch.transport.TransportService$TimeoutHandler.run(TransportService.java:679)
	at java.util.concurrent.ThreadPoolExecutor.runWorker(ThreadPoolExecutor.java:1142)
	at java.util.concurrent.ThreadPoolExecutor$Worker.run(ThreadPoolExecutor.java:617)
	at java.lang.Thread.run(Thread.java:745)
[2018-07-26 11:21:45,652][WARN ][discovery.zen.ping.unicast] [node-1] failed to send ping to [{#zen_unicast_2#}{**.**.81.194}{**.**.81.194:9300}]
ReceiveTimeoutTransportException[[][**.**.81.194:9300][internal:discovery/zen/unicast] request_id [210480875] timed out after [3750ms]]
	at org.elasticsearch.transport.TransportService$TimeoutHandler.run(TransportService.java:679)
	at java.util.concurrent.ThreadPoolExecutor.runWorker(ThreadPoolExecutor.java:1142)
	at java.util.concurrent.ThreadPoolExecutor$Worker.run(ThreadPoolExecutor.java:617)
	at java.lang.Thread.run(Thread.java:745)
:q
[2018-07-26 11:21:50,153][WARN ][discovery.zen.ping.unicast] [node-1] failed to send ping to [{#zen_unicast_2#}{**.**.81.194}{**.**.81.194:9300}]
ReceiveTimeoutTransportException[[][**.**.81.194:9300][internal:discovery/zen/unicast] request_id [210480887] timed out after [3750ms]]
	at org.elasticsearch.transport.TransportService$TimeoutHandler.run(TransportService.java:679)
	at java.util.concurrent.ThreadPoolExecutor.runWorker(ThreadPoolExecutor.java:1142)
	at java.util.concurrent.ThreadPoolExecutor$Worker.run(ThreadPoolExecutor.java:617)
	at java.lang.Thread.run(Thread.java:745)
节点2:
[2018-07-26 11:21:41,151][WARN ][discovery.zen.ping.unicast] [node-1] failed to send ping to [{#zen_unicast_2#}{**.**.81.194}{**.**.81.194:9300}]
ReceiveTimeoutTransportException[[][**.**.81.194:9300][internal:discovery/zen/unicast] request_id [210480863] timed out after [3750ms]]
	at org.elasticsearch.transport.TransportService$TimeoutHandler.run(TransportService.java:679)
	at java.util.concurrent.ThreadPoolExecutor.runWorker(ThreadPoolExecutor.java:1142)
	at java.util.concurrent.ThreadPoolExecutor$Worker.run(ThreadPoolExecutor.java:617)
	at java.lang.Thread.run(Thread.java:745)
[2018-07-26 11:21:45,652][WARN ][discovery.zen.ping.unicast] [node-1] failed to send ping to [{#zen_unicast_2#}{**.**.81.194}{**.**.81.194:9300}]
ReceiveTimeoutTransportException[[][**.**.81.194:9300][internal:discovery/zen/unicast] request_id [210480875] timed out after [3750ms]]
	at org.elasticsearch.transport.TransportService$TimeoutHandler.run(TransportService.java:679)
	at java.util.concurrent.ThreadPoolExecutor.runWorker(ThreadPoolExecutor.java:1142)
	at java.util.concurrent.ThreadPoolExecutor$Worker.run(ThreadPoolExecutor.java:617)
	at java.lang.Thread.run(Thread.java:745)
:q
[2018-07-26 11:21:50,153][WARN ][discovery.zen.ping.unicast] [node-1] failed to send ping to [{#zen_unicast_2#}{**.**.81.194}{**.**.81.194:9300}]
ReceiveTimeoutTransportException[[][**.**.81.194:9300][internal:discovery/zen/unicast] request_id [210480887] timed out after [3750ms]]
	at org.elasticsearch.transport.TransportService$TimeoutHandler.run(TransportService.java:679)
	at java.util.concurrent.ThreadPoolExecutor.runWorker(ThreadPoolExecutor.java:1142)
	at java.util.concurrent.ThreadPoolExecutor$Worker.run(ThreadPoolExecutor.java:617)
	at java.lang.Thread.run(Thread.java:745)
节点1,2提示无法ping通节点3, 登录到节点3上执行:
ps -ef|grep elastic
重启elasticsearch, 因为elasticsearch没有重启命令, 只能根据ps出的进程号杀掉进程, 然后执行:
./elasticsearch -d
中途可能会报错:
Exception in thread "main" java.lang.RuntimeException: don't run elasticsearch as root.
	at org.elasticsearch.bootstrap.Bootstrap.initializeNatives(Bootstrap.java:93)
	at org.elasticsearch.bootstrap.Bootstrap.setup(Bootstrap.java:144)
	at org.elasticsearch.bootstrap.Bootstrap.init(Bootstrap.java:270)
	at org.elasticsearch.bootstrap.Elasticsearch.main(Elasticsearch.java:35)
Refer to the log for complete error details.
因为安全问题elasticsearch 不让用root用户直接运行,所以要创建新用户:
第一步:liunx创建新用户 adduser XXX 然后给创建的用户加密码 passwd XXX 输入两次密码。
第二步:切换刚才创建的用户 su XXX 然后执行elasticsearch 会显示Permission denied 权限不足。
第三步:给新建的XXX赋权限,chmod 777 * 这个不行,因为这个用户本身就没有权限,肯定自己不能给自己付权限。所以要用root用户登录付权限。
第四步:root给XXX赋权限,chown -R XXX /你的elasticsearch安装目录。
如果提示:
log4j:ERROR setFile(null,true) call failed.
java.io.FileNotFoundException: /server/pd/elasticsearch-2.3.3/logs/cc.log (Permission denied)
	at java.io.FileOutputStream.open0(Native Method)
	at java.io.FileOutputStream.open(FileOutputStream.java:270)
	at java.io.FileOutputStream.<init>(FileOutputStream.java:213)
	at java.io.FileOutputStream.<init>(FileOutputStream.java:133)
	at org.apache.log4j.FileAppender.setFile(FileAppender.java:294)
	at org.apache.log4j.FileAppender.activateOptions(FileAppender.java:165)
	at org.apache.log4j.DailyRollingFileAppender.activateOptions(DailyRollingFileAppender.java:223)
	at org.apache.log4j.config.PropertySetter.activate(PropertySetter.java:307)
	at org.apache.log4j.config.PropertySetter.setProperties(PropertySetter.java:172)
	at org.apache.log4j.config.PropertySetter.setProperties(PropertySetter.java:104)
	at org.apache.log4j.PropertyConfigurator.parseAppender(PropertyConfigurator.java:842)
	at org.apache.log4j.PropertyConfigurator.parseCategory(PropertyConfigurator.java:768)
	at org.apache.log4j.PropertyConfigurator.configureRootCategory(PropertyConfigurator.java:648)
	at org.apache.log4j.PropertyConfigurator.doConfigure(PropertyConfigurator.java:514)
	at org.apache.log4j.PropertyConfigurator.configure(PropertyConfigurator.java:440)
	at org.elasticsearch.common.logging.log4j.LogConfigurator.configure(LogConfigurator.java:128)
	at org.elasticsearch.bootstrap.Bootstrap.init(Bootstrap.java:243)
	at org.elasticsearch.bootstrap.Elasticsearch.main(Elasticsearch.java:35)
log4j:ERROR Either File or DatePattern options are not set for appender [file].
表示没有写入日志的权限, 把日志权限赋给该用户即可:
sudo chown pd:users cc.log