import matplotlib.pyplot as plt
import numpy as np
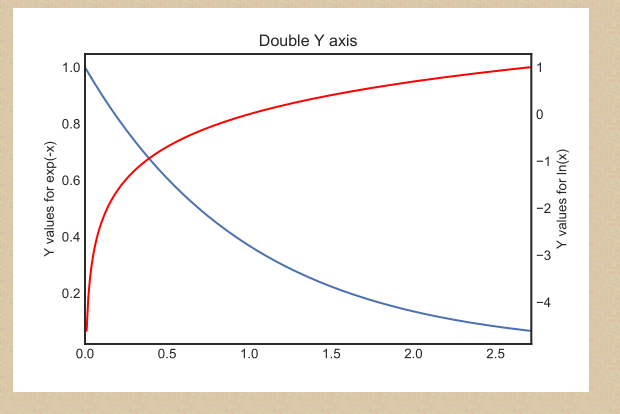
x = np.arange(0., np.e, 0.01)
y1 = np.exp(-x)
y2 = np.log(x)
fig = plt.figure()
sns.set_style('white')
ax1 = fig.add_subplot(111)
ax1.plot(x, y1)
ax1.set_ylabel('Y values for exp(-x)')
ax1.set_title("Double Y axis")
ax2 = ax1.twinx() # this is the important function
ax2.plot(x, y2, 'r')
ax2.set_xlim([0, np.e])
ax2.set_ylabel('Y values for ln(x)')
ax2.set_xlabel('Same X for both exp(-x) and ln(x)')
plt.show()
fig.savefig('doubleY.pdf')
# 生成画布, 并设定标题
plt.figure(figsize=(8, 6), dpi=80)
plt.grid(True)
# 画图的另外一种方式
ax_1 = plt.subplot(111)
ax_1.plot(x, y_cos, color="blue", linewidth=2.0, linestyle="--", label="cos")
ax_1.legend(loc="upper left", shadow=True)
# 设置Y轴(左边)
ax_1.set_ylabel("cosy")
ax_1.set_ylim(-1.0, 1.0)
ax_1.set_yticks(np.linspace(-1, 1, 9, endpoint=True))

# 画图的另外一种方式
ax_2 = ax_1.twinx()
ax_2.plot(x, y_sin, color="green", linewidth=2.0, linestyle="-", label="sin")
ax_2.legend(loc="upper right",  shadow=True)

# 设置Y轴(右边)
ax_2.set_ylabel("siny")
ax_2.set_ylim(-2.0, 2.0)
ax_2.set_yticks(np.linspace(-2, 2, 9, endpoint=True))

# 设置X轴(共同)
ax_1.set_xlabel("x")
ax_1.set_xlim(-4.0, 4.0)
ax_1.set_xticks(np.linspace(-4, 4, 9, endpoint=True))

# 图形显示
plt.show()