带你打造一套 APM 监控系统
APM 是 Application Performance Monitoring 的缩写,监视和管理软件应用程序的性能和可用性。应用性能管理对一个应用的持续稳定运行至关重要。所以这篇文章就从一个 iOS App 的性能管理的纬度谈谈如何精确监控以及数据如何上报等技术点
App 的性能问题是影响用户体验的重要因素之一。性能问题主要包含:Crash、网络请求错误或者超时、UI 响应速度慢、主线程卡顿、CPU 和内存使用率高、耗电量大等等。大多数的问题原因在于开发者错误地使用了线程锁、系统函数、编程规范问题、数据结构等等。解决问题的关键在于尽早的发现和定位问题。
本篇文章着重总结了 APM 的原因以及如何收集数据。APM 数据收集后结合数据上报机制,按照一定策略上传数据到服务端。服务端消费这些信息并产出报告。请结合姊妹篇, 总结了如何打造一款灵活可配置、功能强大的数据上报组件。
一、卡顿监控
卡顿问题,就是在主线程上无法响应用户交互的问题。影响着用户的直接体验,所以针对 App 的卡顿监控是 APM 里面重要的一环。
FPS(frame per second)每秒钟的帧刷新次数,iPhone 手机以 60 为最佳,iPad 某些型号是 120,也是作为卡顿监控的一项参考参数,为什么说是参考参数?因为它不准确。先说说怎么获取到 FPS。CADisplayLink 是一个系统定时器,会以帧刷新频率一样的速率来刷新视图。 [CADisplayLink displayLinkWithTarget:self selector:@selector(###:)]。至于为什么不准我们来看看下面的示例代码
_displayLink = [CADisplayLink displayLinkWithTarget:self selector:@selector(p_displayLinkTick:)];
[_displayLink setPaused:YES];
[_displayLink addToRunLoop:[NSRunLoop currentRunLoop] forMode:NSRunLoopCommonModes];
代码所示,CADisplayLink 对象是被添加到指定的 RunLoop 的某个 Mode 下。所以还是 CPU 层面的操作,卡顿的体验是整个图像渲染的结果:CPU + GPU。请继续往下看
1. 屏幕绘制原理
![老式 CRT 显示器原理]()
讲讲老式的 CRT 显示器的原理。 CRT 电子枪按照上面方式,从上到下一行行扫描,扫面完成后显示器就呈现一帧画面,随后电子枪回到初始位置继续下一次扫描。为了把显示器的显示过程和系统的视频控制器进行同步,显示器(或者其他硬件)会用硬件时钟产生一系列的定时信号。当电子枪换到新的一行,准备进行扫描时,显示器会发出一个水平同步信号(horizonal synchronization),简称 HSync;当一帧画面绘制完成后,电子枪恢复到原位,准备画下一帧前,显示器会发出一个垂直同步信号(Vertical synchronization),简称 VSync。显示器通常以固定的频率进行刷新,这个固定的刷新频率就是 VSync 信号产生的频率。虽然现在的显示器基本都是液晶显示屏,但是原理保持不变。
![显示器和 CPU、GPU 关系]()
通常,屏幕上一张画面的显示是由 CPU、GPU 和显示器是按照上图的方式协同工作的。CPU 根据工程师写的代码计算好需要现实的内容(比如视图创建、布局计算、图片解码、文本绘制等),然后把计算结果提交到 GPU,GPU 负责图层合成、纹理渲染,随后 GPU 将渲染结果提交到帧缓冲区。随后视频控制器会按照 VSync 信号逐行读取帧缓冲区的数据,经过数模转换传递给显示器显示。
在帧缓冲区只有一个的情况下,帧缓冲区的读取和刷新都存在效率问题,为了解决效率问题,显示系统会引入2个缓冲区,即双缓冲机制。在这种情况下,GPU 会预先渲染好一帧放入帧缓冲区,让视频控制器来读取,当下一帧渲染好后,GPU 直接把视频控制器的指针指向第二个缓冲区。提升了效率。
目前来看,双缓冲区提高了效率,但是带来了新的问题:当视频控制器还未读取完成时,即屏幕内容显示了部分,GPU 将新渲染好的一帧提交到另一个帧缓冲区并把视频控制器的指针指向新的帧缓冲区,视频控制器就会把新的一帧数据的下半段显示到屏幕上,造成画面撕裂的情况。
为了解决这个问题,GPU 通常有一个机制叫垂直同步信号(V-Sync),当开启垂直同步信号后,GPU 会等到视频控制器发送 V-Sync 信号后,才进行新的一帧的渲染和帧缓冲区的更新。这样的几个机制解决了画面撕裂的情况,也增加了画面流畅度。但需要更多的计算资源 ![IPC唤醒 RunLoop]()
答疑
可能有些人会看到「当开启垂直同步信号后,GPU 会等到视频控制器发送 V-Sync 信号后,才进行新的一帧的渲染和帧缓冲区的更新」这里会想,GPU 收到 V-Sync 才进行新的一帧渲染和帧缓冲区的更新,那是不是双缓冲区就失去意义了?
设想一个显示器显示第一帧图像和第二帧图像的过程。首先在双缓冲区的情况下,GPU 首先渲染好一帧图像存入到帧缓冲区,然后让视频控制器的指针直接直接这个缓冲区,显示第一帧图像。第一帧图像的内容显示完成后,视频控制器发送 V-Sync 信号,GPU 收到 V-Sync 信号后渲染第二帧图像并将视频控制器的指针指向第二个帧缓冲区。
看上去第二帧图像是在等第一帧显示后的视频控制器发送 V-Sync 信号。是吗?真是这样的吗? 😭 想啥呢,当然不是。 🐷 不然双缓冲区就没有存在的意义了
揭秘。请看下图 ![多缓冲区显示原理]()
当第一次 V-Sync 信号到来时,先渲染好一帧图像放到帧缓冲区,但是不展示,当收到第二个 V-Sync 信号后读取第一次渲染好的结果(视频控制器的指针指向第一个帧缓冲区),并同时渲染新的一帧图像并将结果存入第二个帧缓冲区,等收到第三个 V-Sync 信号后,读取第二个帧缓冲区的内容(视频控制器的指针指向第二个帧缓冲区),并开始第三帧图像的渲染并送入第一个帧缓冲区,依次不断循环往复。
请查看资料,需要梯子:Multiple buffering
2. 卡顿产生的原因
![卡顿原因]()
VSync 信号到来后,系统图形服务会通过 CADisplayLink 等机制通知 App,App 主线程开始在 CPU 中计算显示内容(视图创建、布局计算、图片解码、文本绘制等)。然后将计算的内容提交到 GPU,GPU 经过图层的变换、合成、渲染,随后 GPU 把渲染结果提交到帧缓冲区,等待下一次 VSync 信号到来再显示之前渲染好的结果。在垂直同步机制的情况下,如果在一个 VSync 时间周期内,CPU 或者 GPU 没有完成内容的提交,就会造成该帧的丢弃,等待下一次机会再显示,这时候屏幕上还是之前渲染的图像,所以这就是 CPU、GPU 层面界面卡顿的原因。
目前 iOS 设备有双缓存机制,也有三缓冲机制,Android 现在主流是三缓冲机制,在早期是单缓冲机制。 iOS 三缓冲机制例子
CPU 和 GPU 资源消耗原因很多,比如对象的频繁创建、属性调整、文件读取、视图层级的调整、布局的计算(AutoLayout 视图个数多了就是线性方程求解难度变大)、图片解码(大图的读取优化)、图像绘制、文本渲染、数据库读取(多读还是多写乐观锁、悲观锁的场景)、锁的使用(举例:自旋锁使用不当会浪费 CPU)等方面。开发者根据自身经验寻找最优解(这里不是本文重点)。
3. APM 如何监控卡顿并上报
CADisplayLink 肯定不用了,这个 FPS 仅作为参考。一般来讲,卡顿的监测有2种方案:监听 RunLoop 状态回调、子线程 ping 主线程
3.1 RunLoop 状态监听的方式
RunLoop 负责监听输入源进行调度处理。比如网络、输入设备、周期性或者延迟事件、异步回调等。RunLoop 会接收2种类型的输入源:一种是来自另一个线程或者来自不同应用的异步消息(source0事件)、另一种是来自预定或者重复间隔的事件。
RunLoop 状态如下图
![RunLoop]()
第一步:通知 Observers,RunLoop 要开始进入 loop,紧接着进入 loop
if (currentMode->_observerMask & kCFRunLoopEntry )
    // 通知 Observers: RunLoop 即将进入 loop
    __CFRunLoopDoObservers(rl, currentMode, kCFRunLoopEntry);
// 进入loop
result = __CFRunLoopRun(rl, currentMode, seconds, returnAfterSourceHandled, previousMode);
第二步:开启 do while 循环保活线程,通知 Observers,RunLoop 触发 Timer 回调、Source0 回调,接着执行被加入的 block
 if (rlm->_observerMask & kCFRunLoopBeforeTimers)
    //  通知 Observers: RunLoop 即将触发 Timer 回调
    __CFRunLoopDoObservers(rl, rlm, kCFRunLoopBeforeTimers);
if (rlm->_observerMask & kCFRunLoopBeforeSources)
    //  通知 Observers: RunLoop 即将触发 Source 回调
    __CFRunLoopDoObservers(rl, rlm, kCFRunLoopBeforeSources);
// 执行被加入的block
__CFRunLoopDoBlocks(rl, rlm);
第三步:RunLoop 在触发 Source0 回调后,如果 Source1 是 ready 状态,就会跳转到 handle_msg 去处理消息。
//  如果有 Source1 (基于port) 处于 ready 状态,直接处理这个 Source1 然后跳转去处理消息
if (MACH_PORT_NULL != dispatchPort && !didDispatchPortLastTime) {
#if DEPLOYMENT_TARGET_MACOSX || DEPLOYMENT_TARGET_EMBEDDED || DEPLOYMENT_TARGET_EMBEDDED_MINI
    msg = (mach_msg_header_t *)msg_buffer;

    if (__CFRunLoopServiceMachPort(dispatchPort, &msg, sizeof(msg_buffer), &livePort, 0, &voucherState, NULL)) {
        goto handle_msg;
    }
#elif DEPLOYMENT_TARGET_WINDOWS
    if (__CFRunLoopWaitForMultipleObjects(NULL, &dispatchPort, 0, 0, &livePort, NULL)) {
        goto handle_msg;
    }
#endif
}
第四步:回调触发后,通知 Observers 即将进入休眠状态
Boolean poll = sourceHandledThisLoop || (0ULL == timeout_context->termTSR);
// 通知 Observers: RunLoop 的线程即将进入休眠(sleep)
if (!poll && (rlm->_observerMask & kCFRunLoopBeforeWaiting)) __CFRunLoopDoObservers(rl, rlm, kCFRunLoopBeforeWaiting);
	__CFRunLoopSetSleeping(rl);
第五步:进入休眠后,会等待 mach_port 消息,以便再次唤醒。只有以下4种情况才可以被再次唤醒。
- 基于 port 的 source 事件
- Timer 时间到
- RunLoop 超时
- 被调用者唤醒
do {
    if (kCFUseCollectableAllocator) {
        // objc_clear_stack(0);
        // <rdar://problem/16393959>
        memset(msg_buffer, 0, sizeof(msg_buffer));
    }
    msg = (mach_msg_header_t *)msg_buffer;

    __CFRunLoopServiceMachPort(waitSet, &msg, sizeof(msg_buffer), &livePort, poll ? 0 : TIMEOUT_INFINITY, &voucherState, &voucherCopy);

    if (modeQueuePort != MACH_PORT_NULL && livePort == modeQueuePort) {
        // Drain the internal queue. If one of the callout blocks sets the timerFired flag, break out and service the timer.
        while (_dispatch_runloop_root_queue_perform_4CF(rlm->_queue));
        if (rlm->_timerFired) {
            // Leave livePort as the queue port, and service timers below
            rlm->_timerFired = false;
            break;
        } else {
            if (msg && msg != (mach_msg_header_t *)msg_buffer) free(msg);
        }
    } else {
        // Go ahead and leave the inner loop.
        break;
    }
} while (1);
第六步:唤醒时通知 Observer,RunLoop 的线程刚刚被唤醒了
// 通知 Observers: RunLoop 的线程刚刚被唤醒了
if (!poll && (rlm->_observerMask & kCFRunLoopAfterWaiting)) __CFRunLoopDoObservers(rl, rlm, kCFRunLoopAfterWaiting);
    // 处理消息
    handle_msg:;
    __CFRunLoopSetIgnoreWakeUps(rl);
第七步:RunLoop 唤醒后,处理唤醒时收到的消息
- 如果是 Timer 时间到,则触发 Timer 的回调
- 如果是 dispatch,则执行 block
- 如果是 source1 事件,则处理这个事件
#if USE_MK_TIMER_TOO
        // 如果一个 Timer 到时间了,触发这个Timer的回调
        else if (rlm->_timerPort != MACH_PORT_NULL && livePort == rlm->_timerPort) {
            CFRUNLOOP_WAKEUP_FOR_TIMER();
            // On Windows, we have observed an issue where the timer port is set before the time which we requested it to be set. For example, we set the fire time to be TSR 167646765860, but it is actually observed firing at TSR 167646764145, which is 1715 ticks early. The result is that, when __CFRunLoopDoTimers checks to see if any of the run loop timers should be firing, it appears to be 'too early' for the next timer, and no timers are handled.
            // In this case, the timer port has been automatically reset (since it was returned from MsgWaitForMultipleObjectsEx), and if we do not re-arm it, then no timers will ever be serviced again unless something adjusts the timer list (e.g. adding or removing timers). The fix for the issue is to reset the timer here if CFRunLoopDoTimers did not handle a timer itself. 9308754
            if (!__CFRunLoopDoTimers(rl, rlm, mach_absolute_time())) {
                // Re-arm the next timer
                __CFArmNextTimerInMode(rlm, rl);
            }
        }
#endif
        //  如果有dispatch到main_queue的block,执行block
        else if (livePort == dispatchPort) {
            CFRUNLOOP_WAKEUP_FOR_DISPATCH();
            __CFRunLoopModeUnlock(rlm);
            __CFRunLoopUnlock(rl);
            _CFSetTSD(__CFTSDKeyIsInGCDMainQ, (void *)6, NULL);
#if DEPLOYMENT_TARGET_WINDOWS
            void *msg = 0;
#endif
            __CFRUNLOOP_IS_SERVICING_THE_MAIN_DISPATCH_QUEUE__(msg);
            _CFSetTSD(__CFTSDKeyIsInGCDMainQ, (void *)0, NULL);
            __CFRunLoopLock(rl);
            __CFRunLoopModeLock(rlm);
            sourceHandledThisLoop = true;
            didDispatchPortLastTime = true;
        }
        // 如果一个 Source1 (基于port) 发出事件了,处理这个事件
        else {
            CFRUNLOOP_WAKEUP_FOR_SOURCE();

            // If we received a voucher from this mach_msg, then put a copy of the new voucher into TSD. CFMachPortBoost will look in the TSD for the voucher. By using the value in the TSD we tie the CFMachPortBoost to this received mach_msg explicitly without a chance for anything in between the two pieces of code to set the voucher again.
            voucher_t previousVoucher = _CFSetTSD(__CFTSDKeyMachMessageHasVoucher, (void *)voucherCopy, os_release);

            CFRunLoopSourceRef rls = __CFRunLoopModeFindSourceForMachPort(rl, rlm, livePort);
            if (rls) {
#if DEPLOYMENT_TARGET_MACOSX || DEPLOYMENT_TARGET_EMBEDDED || DEPLOYMENT_TARGET_EMBEDDED_MINI
		mach_msg_header_t *reply = NULL;
		sourceHandledThisLoop = __CFRunLoopDoSource1(rl, rlm, rls, msg, msg->msgh_size, &reply) || sourceHandledThisLoop;
		if (NULL != reply) {
		    (void)mach_msg(reply, MACH_SEND_MSG, reply->msgh_size, 0, MACH_PORT_NULL, 0, MACH_PORT_NULL);
		    CFAllocatorDeallocate(kCFAllocatorSystemDefault, reply);
		}
#elif DEPLOYMENT_TARGET_WINDOWS
                sourceHandledThisLoop = __CFRunLoopDoSource1(rl, rlm, rls) || sourceHandledThisLoop;
#endif
第八步:根据当前 RunLoop 状态判断是否需要进入下一个 loop。当被外部强制停止或者 loop 超时,就不继续下一个 loop,否则进入下一个 loop
if (sourceHandledThisLoop && stopAfterHandle) {
    // 进入loop时参数说处理完事件就返回
    retVal = kCFRunLoopRunHandledSource;
    } else if (timeout_context->termTSR < mach_absolute_time()) {
        // 超出传入参数标记的超时时间了
        retVal = kCFRunLoopRunTimedOut;
} else if (__CFRunLoopIsStopped(rl)) {
        __CFRunLoopUnsetStopped(rl);
    // 被外部调用者强制停止了
    retVal = kCFRunLoopRunStopped;
} else if (rlm->_stopped) {
    rlm->_stopped = false;
    retVal = kCFRunLoopRunStopped;
} else if (__CFRunLoopModeIsEmpty(rl, rlm, previousMode)) {
    // source/timer一个都没有
    retVal = kCFRunLoopRunFinished;
}
完整且带有注释的 RunLoop 代码见此处。 Source1 是 RunLoop 用来处理 Mach port 传来的系统事件的,Source0 是用来处理用户事件的。收到 Source1 的系统事件后本质还是调用 Source0 事件的处理函数。
![RunLoop 状态]() RunLoop 6个状态
RunLoop 6个状态
typedef CF_OPTIONS(CFOptionFlags, CFRunLoopActivity) {
    kCFRunLoopEntry ,           // 进入 loop
    kCFRunLoopBeforeTimers ,    // 触发 Timer 回调
    kCFRunLoopBeforeSources ,   // 触发 Source0 回调
    kCFRunLoopBeforeWaiting ,   // 等待 mach_port 消息
    kCFRunLoopAfterWaiting ),   // 接收 mach_port 消息
    kCFRunLoopExit ,            // 退出 loop
    kCFRunLoopAllActivities     // loop 所有状态改变
}
RunLoop 在进入睡眠前的方法执行时间过长而导致无法进入睡眠,或者线程唤醒后接收消息时间过长而无法进入下一步,都会阻塞线程。如果是主线程,则表现为卡顿。
一旦发现进入睡眠前的 KCFRunLoopBeforeSources 状态,或者唤醒后 KCFRunLoopAfterWaiting,在设置的时间阈值内没有变化,则可判断为卡顿,此时 dump 堆栈信息,还原案发现场,进而解决卡顿问题。
开启一个子线程,不断进行循环监测是否卡顿了。在 n 次都超过卡顿阈值后则认为卡顿了。卡顿之后进行堆栈 dump 并上报(具有一定的机制,数据处理在下一 part 讲)。
WatchDog 在不同状态下具有不同的值。
- 启动(Launch):20s
- 恢复(Resume):10s
- 挂起(Suspend):10s
- 退出(Quit):6s
- 后台(Background):3min(在 iOS7 之前可以申请 10min;之后改为 3min;可连续申请,最多到 10min)
卡顿阈值的设置的依据是 WatchDog 的机制。APM 系统里面的阈值需要小于 WatchDog 的值,所以取值范围在 [1, 6] 之间,业界通常选择3秒。
通过 long dispatch_semaphore_wait(dispatch_semaphore_t dsema, dispatch_time_t timeout) 方法判断是否阻塞主线程,Returns zero on success, or non-zero if the timeout occurred. 返回非0则代表超时阻塞了主线程。
![RunLoop-ANR]()
可能很多人纳闷 RunLoop 状态那么多,为什么选择 KCFRunLoopBeforeSources 和 KCFRunLoopAfterWaiting?因为大部分卡顿都是在 KCFRunLoopBeforeSources 和 KCFRunLoopAfterWaiting 之间。比如 Source0 类型的 App 内部事件等
Runloop 检测卡顿流程图如下:
![RunLoop ANR]()
关键代码如下:
// 设置Runloop observer的运行环境
CFRunLoopObserverContext context = {0, (__bridge void *)self, NULL, NULL};
// 创建Runloop observer对象
_observer = CFRunLoopObserverCreate(kCFAllocatorDefault,
                                    kCFRunLoopAllActivities,
                                    YES,
                                    0,
                                    &runLoopObserverCallBack,
                                    &context);
// 将新建的observer加入到当前thread的runloop
CFRunLoopAddObserver(CFRunLoopGetMain(), _observer, kCFRunLoopCommonModes);
// 创建信号
_semaphore = dispatch_semaphore_create(0);

__weak __typeof(self) weakSelf = self;
// 在子线程监控时长
dispatch_async(dispatch_get_global_queue(0, 0), ^{
    __strong __typeof(weakSelf) strongSelf = weakSelf;
    if (!strongSelf) {
        return;
    }
    while (YES) {
        if (strongSelf.isCancel) {
            return;
        }
        // N次卡顿超过阈值T记录为一次卡顿
        long semaphoreWait = dispatch_semaphore_wait(self->_semaphore, dispatch_time(DISPATCH_TIME_NOW, strongSelf.limitMillisecond * NSEC_PER_MSEC));
        if (semaphoreWait != 0) {
            if (self->_activity == kCFRunLoopBeforeSources || self->_activity == kCFRunLoopAfterWaiting) {
                if (++strongSelf.countTime < strongSelf.standstillCount){
                    continue;
                }
                // 堆栈信息 dump 并结合数据上报机制,按照一定策略上传数据到服务器。堆栈 dump 会在下面讲解。数据上报会在 [打造功能强大、灵活可配置的数据上报组件](https://github.com/FantasticLBP/knowledge-kit/blob/master/Chapter1%20-%20iOS/1.80.md) 讲
            }
        }
        strongSelf.countTime = 0;
    }
});
3.2 子线程 ping 主线程监听的方式
开启一个子线程,创建一个初始值为0的信号量、一个初始值为 YES 的布尔值类型标志位。将设置标志位为 NO 的任务派发到主线程中去,子线程休眠阈值时间,时间到后判断标志位是否被主线程成功(值为 NO),如果没成功则认为猪线程发生了卡顿情况,此时 dump 堆栈信息并结合数据上报机制,按照一定策略上传数据到服务器。数据上报会在 打造功能强大、灵活可配置的数据上报组件 讲
while (self.isCancelled == NO) {
        @autoreleasepool {
            __block BOOL isMainThreadNoRespond = YES;

            dispatch_semaphore_t semaphore = dispatch_semaphore_create(0);

            dispatch_async(dispatch_get_main_queue(), ^{
                isMainThreadNoRespond = NO;
                dispatch_semaphore_signal(semaphore);
            });

            [NSThread sleepForTimeInterval:self.threshold];

            if (isMainThreadNoRespond) {
                if (self.handlerBlock) {
                    self.handlerBlock(); // 外部在 block 内部 dump 堆栈(下面会讲),数据上报
                }
            }

            dispatch_semaphore_wait(semaphore, DISPATCH_TIME_FOREVER);
        }
    }
4. 堆栈 dump
方法堆栈的获取是一个麻烦事。理一下思路。[NSThread callStackSymbols] 可以获取当前线程的调用栈。但是当监控到卡顿发生,需要拿到主线程的堆栈信息就无能为力了。从任何线程回到主线程这条路走不通。先做个知识回顾。
在计算机科学中,调用堆栈是一种栈类型的数据结构,用于存储有关计算机程序的线程信息。这种栈也叫做执行堆栈、程序堆栈、控制堆栈、运行时堆栈、机器堆栈等。调用堆栈用于跟踪每个活动的子例程在完成执行后应该返回控制的点。
维基百科搜索到 “Call Stack” 的一张图和例子,如下 ![调用栈]()
上图表示为一个栈。分为若干个栈帧(Frame),每个栈帧对应一个函数调用。下面蓝色部分表示 DrawSquare 函数,它在执行的过程中调用了 DrawLine 函数,用绿色部分表示。
可以看到栈帧由三部分组成:函数参数、返回地址、局部变量。比如在 DrawSquare 内部调用了 DrawLine 函数:第一先把 DrawLine 函数需要的参数入栈;第二把返回地址(控制信息。举例:函数 A 内调用函数 B,调用函数B 的下一行代码的地址就是返回地址)入栈;第三函数内部的局部变量也在该栈中存储。
栈指针 Stack Pointer 表示当前栈的顶部,大多部分操作系统都是栈向下生长,所以栈指针是最小值。帧指针 Frame Pointer 指向的地址中,存储了上一次 Stack Pointer 的值,也就是返回地址。
大多数操作系统中,每个栈帧还保存了上一个栈帧的帧指针。因此知道当前栈帧的 Stack Pointer 和 Frame Pointer 就可以不断回溯,递归获取栈底的帧。
接下来的步骤就是拿到所有线程的 Stack Pointer 和 Frame Pointer。然后不断回溯,还原案发现场。
5. Mach Task 知识
Mach task:
App 在运行的时候,会对应一个 Mach Task,而 Task 下可能有多条线程同时执行任务。《OS X and iOS Kernel Programming》 中描述 Mach Task 为:任务(Task)是一种容器对象,虚拟内存空间和其他资源都是通过这个容器对象管理的,这些资源包括设备和其他句柄。简单概括为:Mack task 是一个机器无关的 thread 的执行环境抽象。
作用: task 可以理解为一个进程,包含它的线程列表。
结构体:task_threads,将 target_task 任务下的所有线程保存在 act_list 数组中,数组个数为 act_listCnt
kern_return_t task_threads
(
  task_t traget_task,
  thread_act_array_t *act_list,                     //线程指针列表
  mach_msg_type_number_t *act_listCnt  //线程个数
)
thread_info:
kern_return_t thread_info
(
  thread_act_t target_act,
  thread_flavor_t flavor,
  thread_info_t thread_info_out,
  mach_msg_type_number_t *thread_info_outCnt
);
如何获取线程的堆栈数据:
系统方法 kern_return_t task_threads(task_inspect_t target_task, thread_act_array_t *act_list, mach_msg_type_number_t *act_listCnt); 可以获取到所有的线程,不过这种方法获取到的线程信息是最底层的 mach 线程。
对于每个线程,可以用 kern_return_t thread_get_state(thread_act_t target_act, thread_state_flavor_t flavor, thread_state_t old_state, mach_msg_type_number_t *old_stateCnt); 方法获取它的所有信息,信息填充在 _STRUCT_MCONTEXT 类型的参数中,这个方法中有2个参数随着 CPU 架构不同而不同。所以需要定义宏屏蔽不同 CPU 之间的区别。
_STRUCT_MCONTEXT 结构体中,存储了当前线程的 Stack Pointer 和最顶部栈帧的 Frame pointer,进而回溯整个线程调用堆栈。
但是上述方法拿到的是内核线程,我们需要的信息是 NSThread,所以需要将内核线程转换为 NSThread。
pthread 的 p 是 POSIX 的缩写,表示「可移植操作系统接口」(Portable Operating System Interface)。设计初衷是每个系统都有自己独特的线程模型,且不同系统对于线程操作的 API 都不一样。所以 POSIX 的目的就是提供抽象的 pthread 以及相关 API。这些 API 在不同的操作系统中有不同的实现,但是完成的功能一致。
Unix 系统提供的 task_threads 和 thread_get_state 操作的都是内核系统,每个内核线程由 thread_t 类型的 id 唯一标识。pthread 的唯一标识是 pthread_t 类型。其中内核线程和 pthread 的转换(即 thread_t 和 pthread_t)很容易,因为 pthread 设计初衷就是「抽象内核线程」。
memorystatus_action_neededpthread_create 方法创建线程的回调函数为 nsthreadLauncher。
static void *nsthreadLauncher(void* thread)
{
    NSThread *t = (NSThread*)thread;
    [nc postNotificationName: NSThreadDidStartNotification object:t userInfo: nil];
    [t _setName: [t name]];
    [t main];
    [NSThread exit];
    return NULL;
}
NSThreadDidStartNotification 其实就是字符串 @"_NSThreadDidStartNotification"。
<NSThread: 0x...>{number = 1, name = main}
为了 NSThread 和内核线程对应起来,只能通过 name 一一对应。 pthread 的 API pthread_getname_np 也可获取内核线程名字。np 代表 not POSIX,所以不能跨平台使用。
思路概括为:将 NSThread 的原始名字存储起来,再将名字改为某个随机数(时间戳),然后遍历内核线程 pthread 的名字,名字匹配则 NSThread 和内核线程对应了起来。找到后将线程的名字还原成原本的名字。对于主线程,由于不能使用 pthread_getname_np,所以在当前代码的 load 方法中获取到 thread_t,然后匹配名字。
static mach_port_t main_thread_id;
+ (void)load {
    main_thread_id = mach_thread_self();
}
二、 App 启动时间监控
1. App 启动时间的监控
应用启动时间是影响用户体验的重要因素之一,所以我们需要量化去衡量一个 App 的启动速度到底有多快。启动分为冷启动和热启动。
![App 启动时间]()
冷启动:App 尚未运行,必须加载并构建整个应用。完成应用的初始化。冷启动存在较大优化空间。冷启动时间从 application: didFinishLaunchingWithOptions: 方法开始计算,App 一般在这里进行各种 SDK 和 App 的基础初始化工作。
热启动:应用已经在后台运行(常见场景:比如用户使用 App 过程中点击 Home 键,再打开 App),由于某些事件将应用唤醒到前台,App 会在 applicationWillEnterForeground: 方法接受应用进入前台的事件
思路比较简单。如下
- 在监控类的
load 方法中先拿到当前的时间值
- 监听 App 启动完成后的通知
UIApplicationDidFinishLaunchingNotification
- 收到通知后拿到当前的时间
- 步骤1和3的时间差就是 App 启动时间。
mach_absolute_time 是一个 CPU/总线依赖函数,返回一个 CPU 时钟周期数。系统休眠时不会增加。是一个纳秒级别的数字。获取前后2个纳秒后需要转换到秒。需要基于系统时间的基准,通过 mach_timebase_info 获得。
mach_timebase_info_data_t g_cmmStartupMonitorTimebaseInfoData = 0;
mach_timebase_info(&g_cmmStartupMonitorTimebaseInfoData);
uint64_t timelapse = mach_absolute_time() - g_cmmLoadTime;
double timeSpan = (timelapse * g_cmmStartupMonitorTimebaseInfoData.numer) / (g_cmmStartupMonitorTimebaseInfoData.denom * 1e9);
2. 线上监控启动时间就好,但是在开发阶段需要对启动时间做优化。
要优化启动时间,就先得知道在启动阶段到底做了什么事情,针对现状作出方案。
pre-main 阶段定义为 App 开始启动到系统调用 main 函数这个阶段;main 阶段定义为 main 函数入口到主 UI 框架的 viewDidAppear。
App 启动过程:
- 解析 Info.plist:加载相关信息例如闪屏;沙盒建立、权限检查;
- Mach-O 加载:如果是胖二进制文件,寻找合适当前 CPU 架构的部分;加载所有依赖的 Mach-O 文件(递归调用 Mach-O 加载的方法);定义内部、外部指针引用,例如字符串、函数等;加载分类中的方法;c++ 静态对象加载、调用 Objc 的
+load() 函数;执行声明为 _attribute((constructor)) 的 c 函数;
- 程序执行:调用 main();调用 UIApplicationMain();调用 applicationWillFinishLaunching();
Pre-Main 阶段 ![Pre-Main 阶段]()
Main 阶段 ![Main 阶段]()
2.1 加载 Dylib
每个动态库的加载,dyld 需要
- 分析所依赖的动态库
- 找到动态库的 Mach-O 文件
- 打开文件
- 验证文件
- 在系统核心注册文件签名
- 对动态库的每一个 segment 调用 mmap()
优化:
- 减少非系统库的依赖
- 使用静态库而不是动态库
- 合并非系统动态库为一个动态库
2.2 Rebase && Binding
优化:
- 减少 Objc 类数量,减少 selector 数量,把未使用的类和函数都可以删掉
- 减少 c++ 虚函数数量
- 转而使用 Swift struct(本质就是减少符号的数量)
2.3 Initializers
优化:
- 使用
+initialize 代替 +load
- 不要使用过 attribute*((constructor)) 将方法显示标记为初始化器,而是让初始化方法调用时才执行。比如使用 dispatch_one、pthread_once() 或 std::once()。也就是第一次使用时才初始化,推迟了一部分工作耗时也尽量不要使用 c++ 的静态对象
2.4 pre-main 阶段影响因素
- 动态库加载越多,启动越慢。
- ObjC 类越多,函数越多,启动越慢。
- 可执行文件越大启动越慢。
- C 的 constructor 函数越多,启动越慢。
- C++ 静态对象越多,启动越慢。
- ObjC 的 +load 越多,启动越慢。
优化手段:
- 减少依赖不必要的库,不管是动态库还是静态库;如果可以的话,把动态库改造成静态库;如果必须依赖动态库,则把多个非系统的动态库合并成一个动态库
- 检查下 framework应当设为optional和required,如果该framework在当前App支持的所有iOS系统版本都存在,那么就设为required,否则就设为optional,因为optional会有些额外的检查
- 合并或者删减一些OC类和函数。关于清理项目中没用到的类,使用工具AppCode代码检查功能,查到当前项目中没有用到的类(也可以用根据linkmap文件来分析,但是准确度不算很高) 有一个叫做FUI的开源项目能很好的分析出不再使用的类,准确率非常高,唯一的问题是它处理不了动态库和静态库里提供的类,也处理不了C++的类模板
- 删减一些无用的静态变量
- 删减没有被调用到或者已经废弃的方法
- 将不必须在 +load 方法中做的事情延迟到 +initialize中,尽量不要用 C++ 虚函数(创建虚函数表有开销)
- 类和方法名不要太长:iOS每个类和方法名都在 __cstring 段里都存了相应的字符串值,所以类和方法名的长短也是对可执行文件大小是有影响的 因还是 Object-c 的动态特性,因为需要通过类/方法名反射找到这个类/方法进行调用,Object-c 对象模型会把类/方法名字符串都保存下来;
- 用 dispatch_once() 代替所有的 attribute((constructor)) 函数、C++ 静态对象初始化、ObjC 的 +load 函数;
- 在设计师可接受的范围内压缩图片的大小,会有意外收获。 压缩图片为什么能加快启动速度呢?因为启动的时候大大小小的图片加载个十来二十个是很正常的, 图片小了,IO操作量就小了,启动当然就会快了,比较靠谱的压缩算法是 TinyPNG。
2.5 main 阶段优化
- 减少启动初始化的流程。能懒加载就懒加载,能放后台初始化就放后台初始化,能延迟初始化的就延迟初始化,不要卡主线程的启动时间,已经下线的业务代码直接删除
- 优化代码逻辑。去除一些非必要的逻辑和代码,减小每个流程所消耗的时间
- 启动阶段使用多线程来进行初始化,把 CPU 性能发挥最大
- 使用纯代码而不是 xib 或者 storyboard 来描述 UI,尤其是主 UI 框架,比如 TabBarController。因为 xib 和 storyboard 还是需要解析成代码来渲染页面,多了一步。
三、 CPU 使用率监控
1. CPU 架构
CPU(Central Processing Unit)中央处理器,市场上主流的架构有 ARM(arm64)、Intel(x86)、AMD 等。其中 Intel 使用 CISC(Complex Instruction Set Computer),ARM 使用 RISC(Reduced Instruction Set Computer)。区别在于不同的 CPU 设计理念和方法。
早期 CPU 全部是 CISC 架构,设计目的是用最少的机器语言指令来完成所需的计算任务。比如对于乘法运算,在 CISC 架构的 CPU 上。一条指令 MUL ADDRA, ADDRB 就可以将内存 ADDRA 和内存 ADDRB 中的数香乘,并将结果存储在 ADDRA 中。做的事情就是:将 ADDRA、ADDRB 中的数据读入到寄存器,相乘的结果写入到内存的操作依赖于 CPU 设计,所以 CISC 架构会增加 CPU 的复杂性和对 CPU 工艺的要求。
RISC 架构要求软件来指定各个操作步骤。比如上面的乘法,指令实现为 MOVE A, ADDRA; MOVE B, ADDRB; MUL A, B; STR ADDRA, A;。这种架构可以降低 CPU 的复杂性以及允许在同样的工艺水平下生产出功能更加强大的 CPU,但是对于编译器的设计要求更高。
目前市场是大部分的 iPhone 都是基于 arm64 架构的。且 arm 架构能耗低。
2. 获取线程信息<a name="threadInfo"></a>
讲完了区别来讲下如何做 CPU 使用率的监控
- 开启定时器,按照设定的周期不断执行下面的逻辑
- 获取当前任务 task。从当前 task 中获取所有的线程信息(线程个数、线程数组)
- 遍历所有的线程信息,判断是否有线程的 CPU 使用率超过设置的阈值
- 假如有线程使用率超过阈值,则 dump 堆栈
- 组装数据,上报数据
线程信息结构体
struct thread_basic_info {
	time_value_t    user_time;      /* user run time(用户运行时长) */
	time_value_t    system_time;    /* system run time(系统运行时长) */
	integer_t       cpu_usage;      /* scaled cpu usage percentage(CPU使用率,上限1000) */
	policy_t        policy;         /* scheduling policy in effect(有效调度策略) */
	integer_t       run_state;      /* run state (运行状态,见下) */
	integer_t       flags;          /* various flags (各种各样的标记) */
	integer_t       suspend_count;  /* suspend count for thread(线程挂起次数) */
	integer_t       sleep_time;     /* number of seconds that thread
	                                 *  has been sleeping(休眠时间) */
};
代码在讲堆栈还原的时候讲过,忘记的看一下上面的分析
thread_act_array_t threads;
mach_msg_type_number_t threadCount = 0;
const task_t thisTask = mach_task_self();
kern_return_t kr = task_threads(thisTask, &threads, &threadCount);
if (kr != KERN_SUCCESS) {
    return ;
}
for (int i = 0; i < threadCount; i++) {
    thread_info_data_t threadInfo;
    thread_basic_info_t threadBaseInfo;
    mach_msg_type_number_t threadInfoCount;

    kern_return_t kr = thread_info((thread_inspect_t)threads[i], THREAD_BASIC_INFO, (thread_info_t)threadInfo, &threadInfoCount);

    if (kr == KERN_SUCCESS) {

        threadBaseInfo = (thread_basic_info_t)threadInfo;
        // todo:条件判断,看不明白
        if (!(threadBaseInfo->flags & TH_FLAGS_IDLE)) {
            integer_t cpuUsage = threadBaseInfo->cpu_usage / 10;
            if (cpuUsage > CPUMONITORRATE) {

                NSMutableDictionary *CPUMetaDictionary = [NSMutableDictionary dictionary];
                NSData *CPUPayloadData = [NSData data];

                NSString *backtraceOfAllThread = [BacktraceLogger backtraceOfAllThread];
                // 1. 组装卡顿的 Meta 信息
                CPUMetaDictionary[@"MONITOR_TYPE"] = CMMonitorCPUType;

                // 2. 组装卡顿的 Payload 信息(一个JSON对象,对象的 Key 为约定好的 STACK_TRACE, value 为 base64 后的堆栈信息)
                NSData *CPUData = [SAFE_STRING(backtraceOfAllThread) dataUsingEncoding:NSUTF8StringEncoding];
                NSString *CPUDataBase64String = [CPUData base64EncodedStringWithOptions:0];
                NSDictionary *CPUPayloadDictionary = @{@"STACK_TRACE": SAFE_STRING(CPUDataBase64String)};

                NSError *error;
                // NSJSONWritingOptions 参数一定要传0,因为服务端需要根据 \n 处理逻辑,传递 0 则生成的 json 串不带 \n
                NSData *parsedData = [NSJSONSerialization dataWithJSONObject:CPUPayloadDictionary options:0 error:&error];
                if (error) {
                    CMMLog(@"%@", error);
                    return;
                }
                CPUPayloadData = [parsedData copy];

                // 3. 数据上报会在 [打造功能强大、灵活可配置的数据上报组件](https://github.com/FantasticLBP/knowledge-kit/blob/master/Chapter1%20-%20iOS/1.80.md) 讲
                [[PrismClient sharedInstance] sendWithType:CMMonitorCPUType meta:CPUMetaDictionary payload:CPUPayloadData];
            }
        }
    }
}
四、 OOM 问题
1. 基础知识准备
硬盘:也叫做磁盘,用于存储数据。你存储的歌曲、图片、视频都是在硬盘里。
内存:由于硬盘读取速度较慢,如果 CPU 运行程序期间,所有的数据都直接从硬盘中读取,则非常影响效率。所以 CPU 会将程序运行所需要的数据从硬盘中读取到内存中。然后 CPU 与内存中的数据进行计算、交换。内存是易失性存储器(断电后,数据消失)。内存条区是计算机内部(在主板上)的一些存储器,用来保存 CPU 运算的中间数据和结果。内存是程序与 CPU 之间的桥梁。从硬盘读取出数据或者运行程序提供给 CPU。
虚拟内存 是计算机系统内存管理的一种技术。它使得程序认为它拥有连续的可用内存,而实际上,它通常被分割成多个物理内存碎片,可能部分暂时存储在外部磁盘(硬盘)存储器上(当需要使用时则用硬盘中数据交换到内存中)。Windows 系统中称为 “虚拟内存”,Linux/Unix 系统中称为 ”交换空间“。
iOS 不支持交换空间?不只是 iOS 不支持交换空间,大多数手机系统都不支持。因为移动设备的大量存储器是闪存,它的读写速度远远小电脑所使用的硬盘,也就是说手机即使使用了交换空间技术,也因为闪存慢的问题,不能提升性能,所以索性就没有交换空间技术。
2. iOS 内存知识
内存(RAM)与 CPU 一样都是系统中最稀少的资源,也很容易发生竞争,应用内存与性能直接相关。iOS 没有交换空间作为备选资源,所以内存资源尤为重要。
什么是 OOM?是 out-of-memory 的缩写,字面意思是超过了内存限制。分为 FOOM(foreground OOM)和 BOOM(background OOM)。它是由 iOS 的 Jetsam 机制造成的一种非主流 Crash,它不能通过 Signal 这种监控方案所捕获。
什么是 Jetsam 机制?Jetsam 机制可以理解为系统为了控制内存资源过度使用而采用的一种管理机制。Jetsam 机制是运行在一个独立的进程中,每个进程都有一个内存阈值,一旦超过这个内存阈值,Jetsam 会立即杀掉这个进程。
为什么设计 Jetsam 机制?因为设备的内存是有限的,所以内存资源非常重要。系统进程以及其他使用的 App 都会抢占这个资源。由于 iOS 不支持交换空间,一旦触发低内存事件,Jetsam 就会尽可能多的释放 App 所在内存,这样 iOS 系统上出现内存不足时,App 就会被系统杀掉,变现为 crash。
2种情况触发 OOM:系统由于整体内存使用过高,会基于优先级策略杀死优先级较低的 App;当前 App 达到了 "highg water mark" ,系统也会强杀当前 App(超过系统对当前单个 App 的内存限制值)。
读了源码(xnu/bsd/kern/kern_memorystatus.c)会发现内存被杀也有2种机制,如下
highwater 处理 -> 我们的 App 占用内存不能超过单个限制
- 从优先级列表里循环寻找线程
- 判断是否满足 p_memstat_memlimit 的限制条件
- DiagonoseActive、FREEZE 过滤
- 杀进程,成功则 exit,否则循环
memorystatus_act_aggressive 处理 -> 内存占用高,按照优先级杀死
- 根据 policy 家在 jld_bucket_count,用来判断是否被杀
- 从 JETSAM_PRIORITY_ELEVATED_INACTIVE 开始杀
- Old_bucket_count 和 memorystatus_jld_eval_period_msecs 判断是否开杀
- 根据优先级从低到高开始杀,直到 memorystatus_avail_pages_below_pressure
内存过大的几种情况
- App 内存消耗较低,同时其他 App 内存管理也很棒,那么即使切换到其他 App,我们自己的 App 依旧是“活着”的,保留了用户状态。体验好
- App 内存消耗较低,但其他 App 内存消耗太大(可能是内存管理糟糕,也可能是本身就耗费资源,比如游戏),那么除了在前台的线程,其他 App 都会被系统杀死,回收内存资源,用来给活跃的进程提供内存。
- App 内存消耗较大,切换到其他 App 后,即使其他 App 向系统申请的内存不大,系统也会因为内存资源紧张,优先把内存消耗大的 App 杀死。表现为用户将 App 退出到后台,过会儿再次打开会发现 App 重新加载启动。
- App 内存消耗非常大,在前台运行时就被系统杀死,造成闪退。
App 内存不足时,系统会按照一定策略来腾出更多的空间供使用。比较常见的做法是将一部分优先级低的数据挪到磁盘上,该操作为称为 page out。之后再次访问这块数据的时候,系统会负责将它重新搬回到内存中,该操作被称为 page in。
Memory page** 是内存管理中的最小单位,是系统分配的,可能一个 page 持有多个对象,也可能一个大的对象跨越多个 page。通常它是 16KB 大小,且有3种类型的 page。
![]()
-
Clean Memory Clean memory 包括3类:可以 page out 的内存、内存映射文件、App 使用到的 framework(每个 framework 都有 _DATA_CONST 段,通常都是 clean 状态,但使用 runtime swizling,那么变为 dirty)。
一开始分配的 page 都是干净的(堆里面的对象分配除外),我们 App 数据写入时候变为 dirty。从硬盘读进内存的文件,也是只读的、clean page。
![]()
-
Dirty Memory
Dirty memory 包括4类:被 App 写入过数据的内存、所有堆区分配的对象、图像解码缓冲区、framework(framework 都有 _DATA 段和 _DATA_DIRTY 段,它们的内存都是 dirty)。
在使用 framework 的过程中会产生 Dirty memory,使用单例或者全局初始化方法有助于帮助减少 Dirty memory(因为单例一旦创建就不销毁,一直在内存中,系统不认为是 Dirty memory)。
![]()
-
Compressed Memory
由于闪存容量和读写限制,iOS 没有交换空间机制,而是在 iOS7 引入了 memory compressor。它是在内存紧张时候能够将最近一段时间未使用过的内存对象,内存压缩器会把对象压缩,释放出更多的 page。在需要时内存压缩器对其解压复用。在节省内存的同时提高了响应速度。
比如 App 使用某 Framework,内部有个 NSDictionary 属性存储数据,使用了 3 pages 内存,在近期未被访问的时候 memory compressor 将其压缩为 1 page,再次使用的时候还原为 3 pages。
App 运行内存 = pageNumbers * pageSize。因为 Compressed Memory 属于 Dirty memory。所以 Memory footprint = dirtySize + CompressedSize
设备不同,内存占用上限不同,App 上限较高,extension 上限较低,超过上限 crash 到 EXC_RESOURCE_EXCEPTION。 ![]()
接下来谈一下如何获取内存上限,以及如何监控 App 因为占用内存过大而被强杀。
3. 获取内存信息
3.1 通过 JetsamEvent 日志计算内存限制值
当 App 被 Jetsam 机制杀死时,手机会生成系统日志。查看路径:Settings-Privacy-Analytics & Improvements- Analytics Data(设置-隐私- 分析与改进-分析数据),可以看到 JetsamEvent-2020-03-14-161828.ips 形式的日志,以 JetsamEvent 开头。这些 JetsamEvent 日志都是 iOS 系统内核强杀掉那些优先级不高(idle、frontmost、suspended)且占用内存超过系统内存限制的 App 留下的。
日志包含了 App 的内存信息。可以查看到 日志最顶部有 pageSize 字段,查找到 per-process-limit,该节点所在结构里的 rpages ,将 rpages * pageSize 即可得到 OOM 的阈值。
日志中 largestProcess 字段代表 App 名称;reason 字段代表内存原因;states 字段代表奔溃时 App 的状态( idle、suspended、frontmost...)。
为了测试数据的准确性,我将测试2台设备(iPhone 6s plus/13.3.1,iPhone 11 Pro/13.3.1)的所有 App 彻底退出,只跑了一个为了测试内存临界值的 Demo App。 循环申请内存,ViewController 代码如下
- (void)viewDidLoad {
    [super viewDidLoad];
    NSMutableArray *array = [NSMutableArray array];
    for (NSInteger index = 0; index < 10000000; index++) {
        UIImageView *imageView = [[UIImageView alloc] initWithFrame:CGRectMake(0, 0, 100, 100)];
        UIImage *image = [UIImage imageNamed:@"AppIcon"];
        imageView.image = image;
        [array addObject:imageView];
    }
}
iPhone 6s plus/13.3.1 数据如下:
{"bug_type":"298","timestamp":"2020-03-19 17:23:45.94 +0800","os_version":"iPhone OS 13.3.1 (17D50)","incident_id":"DA8AF66D-24E8-458C-8734-981866942168"}
{
  "crashReporterKey" : "fc9b659ce486df1ed1b8062d5c7c977a7eb8c851",
  "kernel" : "Darwin Kernel Version 19.3.0: Thu Jan  9 21:10:44 PST 2020; root:xnu-6153.82.3~1\/RELEASE_ARM64_S8000",
  "product" : "iPhone8,2",
  "incident" : "DA8AF66D-24E8-458C-8734-981866942168",
  "date" : "2020-03-19 17:23:45.93 +0800",
  "build" : "iPhone OS 13.3.1 (17D50)",
  "timeDelta" : 332,
  "memoryStatus" : {
  "compressorSize" : 48499,
  "compressions" : 7458651,
  "decompressions" : 5190200,
  "zoneMapCap" : 744407040,
  "largestZone" : "APFS_4K_OBJS",
  "largestZoneSize" : 41402368,
  "pageSize" : 16384,
  "uncompressed" : 104065,
  "zoneMapSize" : 141606912,
  "memoryPages" : {
    "active" : 26214,
    "throttled" : 0,
    "fileBacked" : 14903,
    "wired" : 20019,
    "anonymous" : 37140,
    "purgeable" : 142,
    "inactive" : 23669,
    "free" : 2967,
    "speculative" : 2160
  }
},
  "largestProcess" : "Test",
  "genCounter" : 0,
  "processes" : [
  {
    "uuid" : "39c5738b-b321-3865-a731-68064c4f7a6f",
    "states" : [
      "daemon",
      "idle"
    ],
    "lifetimeMax" : 188,
    "age" : 948223699030,
    "purgeable" : 0,
    "fds" : 25,
    "coalition" : 422,
    "rpages" : 177,
    "pid" : 282,
    "idleDelta" : 824711280,
    "name" : "com.apple.Safari.SafeBrowsing.Se",
    "cpuTime" : 10.275422000000001
  },
  // ...
  {
    "uuid" : "83dbf121-7c0c-3ab5-9b66-77ee926e1561",
    "states" : [
      "frontmost"
    ],
    "killDelta" : 2592,
    "genCount" : 0,
    "age" : 1531004794,
    "purgeable" : 0,
    "fds" : 50,
    "coalition" : 1047,
    "rpages" : 92806,
    "reason" : "per-process-limit",
    "pid" : 2384,
    "cpuTime" : 59.464373999999999,
    "name" : "Test",
    "lifetimeMax" : 92806
  },
  // ...
 ]
}
iPhone 6s plus/13.3.1 手机 OOM 临界值为:(16384*92806)/(1024*1024)=1450.09375M
iPhone 11 Pro/13.3.1 数据如下:
{"bug_type":"298","timestamp":"2020-03-19 17:30:28.39 +0800","os_version":"iPhone OS 13.3.1 (17D50)","incident_id":"7F111601-BC7A-4BD7-A468-CE3370053057"}
{
  "crashReporterKey" : "bc2445adc164c399b330f812a48248e029e26276",
  "kernel" : "Darwin Kernel Version 19.3.0: Thu Jan  9 21:11:10 PST 2020; root:xnu-6153.82.3~1\/RELEASE_ARM64_T8030",
  "product" : "iPhone12,3",
  "incident" : "7F111601-BC7A-4BD7-A468-CE3370053057",
  "date" : "2020-03-19 17:30:28.39 +0800",
  "build" : "iPhone OS 13.3.1 (17D50)",
  "timeDelta" : 189,
  "memoryStatus" : {
  "compressorSize" : 66443,
  "compressions" : 25498129,
  "decompressions" : 15532621,
  "zoneMapCap" : 1395015680,
  "largestZone" : "APFS_4K_OBJS",
  "largestZoneSize" : 41222144,
  "pageSize" : 16384,
  "uncompressed" : 127027,
  "zoneMapSize" : 169639936,
  "memoryPages" : {
    "active" : 58652,
    "throttled" : 0,
    "fileBacked" : 20291,
    "wired" : 45838,
    "anonymous" : 96445,
    "purgeable" : 4,
    "inactive" : 54368,
    "free" : 5461,
    "speculative" : 3716
  }
},
  "largestProcess" : "杭城小刘",
  "genCounter" : 0,
  "processes" : [
  {
    "uuid" : "2dd5eb1e-fd31-36c2-99d9-bcbff44efbb7",
    "states" : [
      "daemon",
      "idle"
    ],
    "lifetimeMax" : 171,
    "age" : 5151034269954,
    "purgeable" : 0,
    "fds" : 50,
    "coalition" : 66,
    "rpages" : 164,
    "pid" : 11276,
    "idleDelta" : 3801132318,
    "name" : "wcd",
    "cpuTime" : 3.430787
  },
  // ...
  {
    "uuid" : "63158edc-915f-3a2b-975c-0e0ac4ed44c0",
    "states" : [
      "frontmost"
    ],
    "killDelta" : 4345,
    "genCount" : 0,
    "age" : 654480778,
    "purgeable" : 0,
    "fds" : 50,
    "coalition" : 1718,
    "rpages" : 134278,
    "reason" : "per-process-limit",
    "pid" : 14206,
    "cpuTime" : 23.955463999999999,
    "name" : "杭城小刘",
    "lifetimeMax" : 134278
  },
  // ...
 ]
}
iPhone 11 Pro/13.3.1 手机 OOM 临界值为:(16384*134278)/(1024*1024)=2098.09375M
iOS 系统如何发现 Jetsam ?
MacOS/iOS 是一个 BSD 衍生而来的系统,其内核是 Mach,但是对于上层暴露的接口一般是基于 BSD 层对 Mach 的包装后的。Mach 是一个微内核的架构,真正的虚拟内存管理也是在其中进行的,BSD 对内存管理提供了上层接口。Jetsam 事件也是由 BSD 产生的。bsd_init 函数是入口,其中基本都是在初始化各个子系统,比如虚拟内存管理等。
// 1. Initialize the kernel memory allocator, 初始化 BSD 内存 Zone,这个 Zone 是基于 Mach 内核的zone 构建
kmeminit();

// 2. Initialise background freezing, iOS 上独有的特性,内存和进程的休眠的常驻监控线程
#if CONFIG_FREEZE
#ifndef CONFIG_MEMORYSTATUS
    #error "CONFIG_FREEZE defined without matching CONFIG_MEMORYSTATUS"
#endif
    /* Initialise background freezing */
    bsd_init_kprintf("calling memorystatus_freeze_init\n");
    memorystatus_freeze_init();
#endif>

// 3. iOS 独有,JetSAM(即低内存事件的常驻监控线程)
#if CONFIG_MEMORYSTATUS
    /* Initialize kernel memory status notifications */
    bsd_init_kprintf("calling memorystatus_init\n");
    memorystatus_init();
#endif /* CONFIG_MEMORYSTATUS */
主要作用就是开启了2个优先级最高的线程,来监控整个系统的内存情况。
CONFIG_FREEZE 开启时,内核对进程进行冷冻而不是杀死。冷冻功能是由内核中启动一个 memorystatus_freeze_thread 进行,这个进程在收到信号后调用 memorystatus_freeze_top_process 进行冷冻。
iOS 系统会开启优先级最高的线程 vm_pressure_monitor 来监控系统的内存压力情况,并通过一个堆栈来维护所有 App 进程。iOS 系统还会维护一个内存快照表,用于保存每个进程内存页的消耗情况。有关 Jetsam 也就是 memorystatus 相关的逻辑,可以在 XNU 项目中的 kern_memorystatus.h 和 **kern_memorystatus.c **源码中查看。
iOS 系统因内存占用过高会强杀 App 前,至少有 6秒钟可以用来做优先级判断,JetsamEvent 日志也是在这6秒内生成的。
上文提到了 iOS 系统没有交换空间,于是引入了 MemoryStatus 机制(也称为 Jetsam)。也就是说在 iOS 系统上释放尽可能多的内存供当前 App 使用。这个机制表现在优先级上,就是先强杀后台应用;如果内存还是不够多,就强杀掉当前应用。在 MacOS 中,MemoryStatus 只会强杀掉标记为空闲退出的进程。
MemoryStatus 机制会开启一个 memorystatus_jetsam_thread 的线程,它负责强杀 App 和记录日志,不会发送消息,所以内存压力检测线程无法获取到强杀 App 的消息。
当监控线程发现某 App 有内存压力时,就发出通知,此时有内存的 App 就去执行 didReceiveMemoryWarning 代理方法。在这个时机,我们还有机会做一些内存资源释放的逻辑,也许会避免 App 被系统杀死。
源码角度查看问题
iOS 系统内核有一个数组,专门维护线程的优先级。数组的每一项是一个包含进程链表的结构体。结构体如下:
#define MEMSTAT_BUCKET_COUNT (JETSAM_PRIORITY_MAX + 1)

typedef struct memstat_bucket {
    TAILQ_HEAD(, proc) list;
    int count;
} memstat_bucket_t;

memstat_bucket_t memstat_bucket[MEMSTAT_BUCKET_COUNT];
在 kern_memorystatus.h 中可以看到进行优先级信息
#define JETSAM_PRIORITY_IDLE_HEAD                -2
/* The value -1 is an alias to JETSAM_PRIORITY_DEFAULT */
#define JETSAM_PRIORITY_IDLE                      0
#define JETSAM_PRIORITY_IDLE_DEFERRED		  1 /* Keeping this around till all xnu_quick_tests can be moved away from it.*/
#define JETSAM_PRIORITY_AGING_BAND1		  JETSAM_PRIORITY_IDLE_DEFERRED
#define JETSAM_PRIORITY_BACKGROUND_OPPORTUNISTIC  2
#define JETSAM_PRIORITY_AGING_BAND2		  JETSAM_PRIORITY_BACKGROUND_OPPORTUNISTIC
#define JETSAM_PRIORITY_BACKGROUND                3
#define JETSAM_PRIORITY_ELEVATED_INACTIVE	  JETSAM_PRIORITY_BACKGROUND
#define JETSAM_PRIORITY_MAIL                      4
#define JETSAM_PRIORITY_PHONE                     5
#define JETSAM_PRIORITY_UI_SUPPORT                8
#define JETSAM_PRIORITY_FOREGROUND_SUPPORT        9
#define JETSAM_PRIORITY_FOREGROUND               10
#define JETSAM_PRIORITY_AUDIO_AND_ACCESSORY      12
#define JETSAM_PRIORITY_CONDUCTOR                13
#define JETSAM_PRIORITY_HOME                     16
#define JETSAM_PRIORITY_EXECUTIVE                17
#define JETSAM_PRIORITY_IMPORTANT                18
#define JETSAM_PRIORITY_CRITICAL                 19

#define JETSAM_PRIORITY_MAX                      21
可以明显的看到,后台 App 优先级 JETSAM_PRIORITY_BACKGROUND 为3,前台 App 优先级 JETSAM_PRIORITY_FOREGROUND 为10。
优先级规则是:内核线程优先级 > 操作系统优先级 > App 优先级。且前台 App 优先级高于后台运行的 App;当线程的优先级相同时, CPU 占用多的线程的优先级会被降低。
在 kern_memorystatus.c 中可以看到 OOM 可能的原因:
/* For logging clarity */
static const char *memorystatus_kill_cause_name[] = {
	""								,		/* kMemorystatusInvalid							*/
	"jettisoned"					,		/* kMemorystatusKilled							*/
	"highwater"						,		/* kMemorystatusKilledHiwat						*/
	"vnode-limit"					,		/* kMemorystatusKilledVnodes					*/
	"vm-pageshortage"				,		/* kMemorystatusKilledVMPageShortage			*/
	"proc-thrashing"				,		/* kMemorystatusKilledProcThrashing				*/
	"fc-thrashing"					,		/* kMemorystatusKilledFCThrashing				*/
	"per-process-limit"				,		/* kMemorystatusKilledPerProcessLimit			*/
	"disk-space-shortage"			,		/* kMemorystatusKilledDiskSpaceShortage			*/
	"idle-exit"						,		/* kMemorystatusKilledIdleExit					*/
	"zone-map-exhaustion"			,		/* kMemorystatusKilledZoneMapExhaustion			*/
	"vm-compressor-thrashing"		,		/* kMemorystatusKilledVMCompressorThrashing		*/
	"vm-compressor-space-shortage"	,		/* kMemorystatusKilledVMCompressorSpaceShortage	*/
};
查看 memorystatus_init 这个函数中初始化 Jetsam 线程的关键代码
__private_extern__ void
memorystatus_init(void)
{
	// ...
  /* Initialize the jetsam_threads state array */
	jetsam_threads = kalloc(sizeof(struct jetsam_thread_state) * max_jetsam_threads);

	/* Initialize all the jetsam threads */
	for (i = 0; i < max_jetsam_threads; i++) {

		result = kernel_thread_start_priority(memorystatus_thread, NULL, 95 /* MAXPRI_KERNEL */, &jetsam_threads[i].thread);
		if (result == KERN_SUCCESS) {
			jetsam_threads[i].inited = FALSE;
			jetsam_threads[i].index = i;
			thread_deallocate(jetsam_threads[i].thread);
		} else {
			panic("Could not create memorystatus_thread %d", i);
		}
	}
}
/*
 *	High-level priority assignments
 *
 *************************************************************************
 * 127		Reserved (real-time)
 *				A
 *				+
 *			(32 levels)
 *				+
 *				V
 * 96		Reserved (real-time)
 * 95		Kernel mode only
 *				A
 *				+
 *			(16 levels)
 *				+
 *				V
 * 80		Kernel mode only
 * 79		System high priority
 *				A
 *				+
 *			(16 levels)
 *				+
 *				V
 * 64		System high priority
 * 63		Elevated priorities
 *				A
 *				+
 *			(12 levels)
 *				+
 *				V
 * 52		Elevated priorities
 * 51		Elevated priorities (incl. BSD +nice)
 *				A
 *				+
 *			(20 levels)
 *				+
 *				V
 * 32		Elevated priorities (incl. BSD +nice)
 * 31		Default (default base for threads)
 * 30		Lowered priorities (incl. BSD -nice)
 *				A
 *				+
 *			(20 levels)
 *				+
 *				V
 * 11		Lowered priorities (incl. BSD -nice)
 * 10		Lowered priorities (aged pri's)
 *				A
 *				+
 *			(11 levels)
 *				+
 *				V
 * 0		Lowered priorities (aged pri's / idle)
 *************************************************************************
 */
可以看出:用户态的应用程序的线程不可能高于操作系统和内核。而且,用户态的应用程序间的线程优先级分配也有区别,比如处于前台的应用程序优先级高于处于后台的应用程序优先级。iOS 上应用程序优先级最高的是 SpringBoard;此外线程的优先级不是一成不变的。Mach 会根据线程的利用率和系统整体负载动态调整线程优先级。如果耗费 CPU 太多就降低线程优先级,如果线程过度挨饿,则会提升线程优先级。但是无论怎么变,程序都不能超过其所在线程的优先级区间范围。
可以看出,系统会根据内核启动参数和设备性能,开启 max_jetsam_threads 个(一般情况为1,特殊情况下可能为3)jetsam 线程,且这些线程的优先级为 95,也就是 MAXPRI_KERNEL(注意这里的 95 是线程的优先级,XNU 的线程优先级区间为:0~127。上文的宏定义是进程优先级,区间为:-2~19)。
紧接着,分析下 memorystatus_thread 函数,主要负责线程启动的初始化
static void
memorystatus_thread(void *param __unused, wait_result_t wr __unused)
{
  //...
  while (memorystatus_action_needed()) {
		boolean_t killed;
		int32_t priority;
		uint32_t cause;
		uint64_t jetsam_reason_code = JETSAM_REASON_INVALID;
		os_reason_t jetsam_reason = OS_REASON_NULL;

		cause = kill_under_pressure_cause;
		switch (cause) {
			case kMemorystatusKilledFCThrashing:
				jetsam_reason_code = JETSAM_REASON_MEMORY_FCTHRASHING;
				break;
			case kMemorystatusKilledVMCompressorThrashing:
				jetsam_reason_code = JETSAM_REASON_MEMORY_VMCOMPRESSOR_THRASHING;
				break;
			case kMemorystatusKilledVMCompressorSpaceShortage:
				jetsam_reason_code = JETSAM_REASON_MEMORY_VMCOMPRESSOR_SPACE_SHORTAGE;
				break;
			case kMemorystatusKilledZoneMapExhaustion:
				jetsam_reason_code = JETSAM_REASON_ZONE_MAP_EXHAUSTION;
				break;
			case kMemorystatusKilledVMPageShortage:
				/* falls through */
			default:
				jetsam_reason_code = JETSAM_REASON_MEMORY_VMPAGESHORTAGE;
				cause = kMemorystatusKilledVMPageShortage;
				break;
		}

		/* Highwater */
		boolean_t is_critical = TRUE;
		if (memorystatus_act_on_hiwat_processes(&errors, &hwm_kill, &post_snapshot, &is_critical)) {
			if (is_critical == FALSE) {
				/*
				 * For now, don't kill any other processes.
				 */
				break;
			} else {
				goto done;
			}
		}

		jetsam_reason = os_reason_create(OS_REASON_JETSAM, jetsam_reason_code);
		if (jetsam_reason == OS_REASON_NULL) {
			printf("memorystatus_thread: failed to allocate jetsam reason\n");
		}

		if (memorystatus_act_aggressive(cause, jetsam_reason, &jld_idle_kills, &corpse_list_purged, &post_snapshot)) {
			goto done;
		}

		/*
		 * memorystatus_kill_top_process() drops a reference,
		 * so take another one so we can continue to use this exit reason
		 * even after it returns
		 */
		os_reason_ref(jetsam_reason);

		/* LRU */
		killed = memorystatus_kill_top_process(TRUE, sort_flag, cause, jetsam_reason, &priority, &errors);
		sort_flag = FALSE;

		if (killed) {
			if (memorystatus_post_snapshot(priority, cause) == TRUE) {

        			post_snapshot = TRUE;
			}

			/* Jetsam Loop Detection */
			if (memorystatus_jld_enabled == TRUE) {
				if ((priority == JETSAM_PRIORITY_IDLE) || (priority == system_procs_aging_band) || (priority == applications_aging_band)) {
					jld_idle_kills++;
				} else {
					/*
					 * We've reached into bands beyond idle deferred.
					 * We make no attempt to monitor them
					 */
				}
			}

			if ((priority >= JETSAM_PRIORITY_UI_SUPPORT) && (total_corpses_count() > 0) && (corpse_list_purged == FALSE)) {
				/*
				 * If we have jetsammed a process in or above JETSAM_PRIORITY_UI_SUPPORT
				 * then we attempt to relieve pressure by purging corpse memory.
				 */
				task_purge_all_corpses();
				corpse_list_purged = TRUE;
			}
			goto done;
		}

		if (memorystatus_avail_pages_below_critical()) {
			/*
			 * Still under pressure and unable to kill a process - purge corpse memory
			 */
			if (total_corpses_count() > 0) {
				task_purge_all_corpses();
				corpse_list_purged = TRUE;
			}

			if (memorystatus_avail_pages_below_critical()) {
				/*
				 * Still under pressure and unable to kill a process - panic
				 */
				panic("memorystatus_jetsam_thread: no victim! available pages:%llu\n", (uint64_t)memorystatus_available_pages);
			}
		}

done:

}
可以看到它开启了一个 循环,memorystatus_action_needed() 来作为循环条件,持续释放内存。
static boolean_t
memorystatus_action_needed(void)
{
#if CONFIG_EMBEDDED
	return (is_reason_thrashing(kill_under_pressure_cause) ||
			is_reason_zone_map_exhaustion(kill_under_pressure_cause) ||
	       memorystatus_available_pages <= memorystatus_available_pages_pressure);
#else /* CONFIG_EMBEDDED */
	return (is_reason_thrashing(kill_under_pressure_cause) ||
			is_reason_zone_map_exhaustion(kill_under_pressure_cause));
#endif /* CONFIG_EMBEDDED */
}
它通过 vm_pagepout 发送的内存压力来判断当前内存资源是否紧张。几种情况:频繁的页面换出换进 is_reason_thrashing, Mach Zone 耗尽了 is_reason_zone_map_exhaustion、以及可用的页低于了 memory status_available_pages 这个门槛。
继续看 memorystatus_thread,会发现内存紧张时,将先触发 High-water 类型的 OOM,也就是说假如某个进程使用过程中超过了其使用内存的最高限制 hight water mark 时会发生 OOM。在 memorystatus_act_on_hiwat_processes() 中,通过 memorystatus_kill_hiwat_proc() 在优先级数组 memstat_bucket 中查找优先级最低的进程,如果进程的内存小于阈值(footprint_in_bytes <= memlimit_in_bytes)则继续寻找次优先级较低的进程,直到找到占用内存超过阈值的进程并杀死。
通常来说单个 App 很难触碰到 high water mark,如果不能结束任何进程,最终走到 memorystatus_act_aggressive,也就是大多数 OOM 发生的地方。
static boolean_t
memorystatus_act_aggressive(uint32_t cause, os_reason_t jetsam_reason, int *jld_idle_kills, boolean_t *corpse_list_purged, boolean_t *post_snapshot)
{
	// ...
  if ( (jld_bucket_count == 0) ||
		     (jld_now_msecs > (jld_timestamp_msecs + memorystatus_jld_eval_period_msecs))) {

			/*
			 * Refresh evaluation parameters
			 */
			jld_timestamp_msecs	 = jld_now_msecs;
			jld_idle_kill_candidates = jld_bucket_count;
			*jld_idle_kills		 = 0;
			jld_eval_aggressive_count = 0;
			jld_priority_band_max	= JETSAM_PRIORITY_UI_SUPPORT;
		}
  //...
}
上述代码看到,判断要不要真正执行 kill 是根据一定的时间间判断的,条件是 jld_now_msecs > (jld_timestamp_msecs + memorystatus_jld_eval_period_msecs。 也就是在 memorystatus_jld_eval_period_msecs 后才发生条件里面的 kill。
/* Jetsam Loop Detection */
if (max_mem <= (512 * 1024 * 1024)) {
	/* 512 MB devices */
memorystatus_jld_eval_period_msecs = 8000;	/* 8000 msecs == 8 second window */
} else {
	/* 1GB and larger devices */
memorystatus_jld_eval_period_msecs = 6000;	/* 6000 msecs == 6 second window */
}
其中 memorystatus_jld_eval_period_msecs 取值最小6秒。所以我们可以在6秒内做些处理。
3.2 开发者们整理所得
stackoverflow 上有一份数据,整理了各种设备的 OOM 临界值
| device |
crash amount:MB |
total amount:MB |
percentage of total |
| iPad1 |
127 |
256 |
49% |
| iPad2 |
275 |
512 |
53% |
| iPad3 |
645 |
1024 |
62% |
| iPad4(iOS 8.1) |
585 |
1024 |
57% |
| Pad Mini 1st Generation |
297 |
512 |
58% |
| iPad Mini retina(iOS 7.1) |
696 |
1024 |
68% |
| iPad Air |
697 |
1024 |
68% |
| iPad Air 2(iOS 10.2.1) |
1383 |
2048 |
68% |
| iPad Pro 9.7"(iOS 10.0.2 (14A456)) |
1395 |
1971 |
71% |
| iPad Pro 10.5”(iOS 11 beta4) |
3057 |
4000 |
76% |
| iPad Pro 12.9” (2015)(iOS 11.2.1) |
3058 |
3999 |
76% |
| iPad 10.2(iOS 13.2.3) |
1844 |
2998 |
62% |
| iPod touch 4th gen(iOS 6.1.1) |
130 |
256 |
51% |
| iPod touch 5th gen |
286 |
512 |
56% |
| iPhone4 |
325 |
512 |
63% |
| iPhone4s |
286 |
512 |
56% |
| iPhone5 |
645 |
1024 |
62% |
| iPhone5s |
646 |
1024 |
63% |
| iPhone6(iOS 8.x) |
645 |
1024 |
62% |
| iPhone6 Plus(iOS 8.x) |
645 |
1024 |
62% |
| iPhone6s(iOS 9.2) |
1396 |
2048 |
68% |
| iPhone6s Plus(iOS 10.2.1) |
1396 |
2048 |
68% |
| iPhoneSE(iOS 9.3) |
1395 |
2048 |
68% |
| iPhone7(iOS 10.2) |
1395 |
2048 |
68% |
| iPhone7 Plus(iOS 10.2.1) |
2040 |
3072 |
66% |
| iPhone8(iOS 12.1) |
1364 |
1990 |
70% |
| iPhoneX(iOS 11.2.1) |
1392 |
2785 |
50% |
| iPhoneXS(iOS 12.1) |
2040 |
3754 |
54% |
| iPhoneXS Max(iOS 12.1) |
2039 |
3735 |
55% |
| iPhoneXR(iOS 12.1) |
1792 |
2813 |
63% |
| iPhone11(iOS 13.1.3) |
2068 |
3844 |
54% |
| iPhone11 Pro Max(iOS 13.2.3) |
2067 |
3740 |
55% |
3.3 触发当前 App 的 high water mark
我们可以写定时器,不断的申请内存,之后再通过 phys_footprint 打印当前占用内存,按道理来说不断申请内存即可触发 Jetsam 机制,强杀 App,那么最后一次打印的内存占用也就是当前设备的内存上限值。
timer = [NSTimer scheduledTimerWithTimeInterval:0.01 target:self selector:@selector(allocateMemory) userInfo:nil repeats:YES];

- (void)allocateMemory {
    UIImageView *imageView = [[UIImageView alloc] initWithFrame:CGRectMake(0, 0, 100, 100)];
    UIImage *image = [UIImage imageNamed:@"AppIcon"];
    imageView.image = image;
    [array addObject:imageView];

    memoryLimitSizeMB = [self usedSizeOfMemory];
    if (memoryWarningSizeMB && memoryLimitSizeMB) {
        NSLog(@"----- memory warnning:%dMB, memory limit:%dMB", memoryWarningSizeMB, memoryLimitSizeMB);
    }
}

- (int)usedSizeOfMemory {
    task_vm_info_data_t taskInfo;
    mach_msg_type_number_t infoCount = TASK_VM_INFO_COUNT;
    kern_return_t kernReturn = task_info(mach_task_self(), TASK_VM_INFO, (task_info_t)&taskInfo, &infoCount);

    if (kernReturn != KERN_SUCCESS) {
        return 0;
    }
    return (int)(taskInfo.phys_footprint/1024.0/1024.0);
}
3.4 适用于 iOS13 系统的获取方式
iOS13 开始 <os/proc.h> 中 size_t os_proc_available_memory(void); 可以查看当前可用内存。
Return Value
The number of bytes that the app may allocate before it hits its memory limit. If the calling process isn't an app, or if the process has already exceeded its memory limit, this function returns 0.
Discussion
Call this function to determine the amount of memory available to your app. The returned value corresponds to the current memory limit minus the memory footprint of your app at the time of the function call. Your app's memory footprint consists of the data that you allocated in RAM, and that must stay in RAM (or the equivalent) at all times. Memory limits can change during the app life cycle and don't necessarily correspond to the amount of physical memory available on the device.
Use the returned value as advisory information only and don't cache it. The precise value changes when your app does any work that affects memory, which can happen frequently.
Although this function lets you determine the amount of memory your app may safely consume, don't use it to maximize your app's memory usage. Significant memory use, even when under the current memory limit, affects system performance. For example, when your app consumes all of its available memory, the system may need to terminate other apps and system processes to accommodate your app's requests. Instead, always consume the smallest amount of memory you need to be responsive to the user's needs.
If you need more detailed information about the available memory resources, you can call task_info. However, be aware that task_info is an expensive call, whereas this function is much more efficient.
if (@available(iOS 13.0, *)) {
	return os_proc_available_memory() / 1024.0 / 1024.0;
}
App 内存信息的 API 可以在 Mach 层找到,mach_task_basic_info 结构体存储了 Mach task 的内存使用信息,其中 phys_footprint 就是应用使用的物理内存大小,virtual_size 是虚拟内存大小。
#define MACH_TASK_BASIC_INFO     20         /* always 64-bit basic info */
struct mach_task_basic_info {
    mach_vm_size_t  virtual_size;       /* virtual memory size (bytes) */
    mach_vm_size_t  resident_size;      /* resident memory size (bytes) */
    mach_vm_size_t  resident_size_max;  /* maximum resident memory size (bytes) */
    time_value_t    user_time;          /* total user run time for
                                            terminated threads */
    time_value_t    system_time;        /* total system run time for
                                            terminated threads */
    policy_t        policy;             /* default policy for new threads */
    integer_t       suspend_count;      /* suspend count for task */
};
所以获取代码为
task_vm_info_data_t vmInfo;
mach_msg_type_number_t count = TASK_VM_INFO_COUNT;
kern_return_t kr = task_info(mach_task_self(), TASK_VM_INFO, (task_info_t)&vmInfo, &count);

if (kr != KERN_SUCCESS) {
    return ;
}
CGFloat memoryUsed = (CGFloat)(vmInfo.phys_footprint/1024.0/1024.0);
可能有人好奇不应该是 resident_size 这个字段获取内存的使用情况吗?一开始测试后发现 resident_size 和 Xcode 测量结果差距较大。而使用 phys_footprint 则接近于 Xcode 给出的结果。且可以从 WebKit 源码中得到印证。
所以在 iOS13 上,我们可以通过 os_proc_available_memory 获取到当前可以用内存,通过 phys_footprint 获取到当前 App 占用内存,2者的和也就是当前设备的内存上限,超过即触发 Jetsam 机制。
- (CGFloat)limitSizeOfMemory {
    if (@available(iOS 13.0, *)) {
        task_vm_info_data_t taskInfo;
        mach_msg_type_number_t infoCount = TASK_VM_INFO_COUNT;
        kern_return_t kernReturn = task_info(mach_task_self(), TASK_VM_INFO, (task_info_t)&taskInfo, &infoCount);

        if (kernReturn != KERN_SUCCESS) {
            return 0;
        }
        return (CGFloat)((taskInfo.phys_footprint + os_proc_available_memory()) / (1024.0 * 1024.0);
    }
    return 0;
}
当前可以使用内存:1435.936752MB;当前 App 已占用内存:14.5MB,临界值:1435.936752MB + 14.5MB= 1450.436MB, 和 3.1 方法中获取到的内存临界值一样「iPhone 6s plus/13.3.1 手机 OOM 临界值为:(16384*92806)/(1024*1024)=1450.09375M」。
3.5 通过 XNU 获取内存限制值
在 XNU 中,有专门用于获取内存上限值的函数和宏,可以通过 memorystatus_priority_entry 这个结构体得到所有进程的优先级和内存限制值。
typedef struct memorystatus_priority_entry {
  pid_t pid;
  int32_t priority;
  uint64_t user_data;
  int32_t limit;
  uint32_t state;
} memorystatus_priority_entry_t;
其中,priority 代表进程优先级,limit 代表进程的内存限制值。但是这种方式需要 root 权限,由于没有越狱设备,我没有尝试过。
相关代码可查阅 kern_memorystatus.h 文件。需要用到函数 int memorystatus_control(uint32_t command, int32_t pid, uint32_t flags, void *buffer, size_t buffersize);
/* Commands */
#define MEMORYSTATUS_CMD_GET_PRIORITY_LIST            1
#define MEMORYSTATUS_CMD_SET_PRIORITY_PROPERTIES      2
#define MEMORYSTATUS_CMD_GET_JETSAM_SNAPSHOT          3
#define MEMORYSTATUS_CMD_GET_PRESSURE_STATUS          4
#define MEMORYSTATUS_CMD_SET_JETSAM_HIGH_WATER_MARK   5    /* Set active memory limit = inactive memory limit, both non-fatal	*/
#define MEMORYSTATUS_CMD_SET_JETSAM_TASK_LIMIT	      6    /* Set active memory limit = inactive memory limit, both fatal	*/
#define MEMORYSTATUS_CMD_SET_MEMLIMIT_PROPERTIES      7    /* Set memory limits plus attributes independently			*/
#define MEMORYSTATUS_CMD_GET_MEMLIMIT_PROPERTIES      8    /* Get memory limits plus attributes					*/
#define MEMORYSTATUS_CMD_PRIVILEGED_LISTENER_ENABLE   9    /* Set the task's status as a privileged listener w.r.t memory notifications  */
#define MEMORYSTATUS_CMD_PRIVILEGED_LISTENER_DISABLE  10   /* Reset the task's status as a privileged listener w.r.t memory notifications  */
#define MEMORYSTATUS_CMD_AGGRESSIVE_JETSAM_LENIENT_MODE_ENABLE  11   /* Enable the 'lenient' mode for aggressive jetsam. See comments in kern_memorystatus.c near the top. */
#define MEMORYSTATUS_CMD_AGGRESSIVE_JETSAM_LENIENT_MODE_DISABLE 12   /* Disable the 'lenient' mode for aggressive jetsam. */
#define MEMORYSTATUS_CMD_GET_MEMLIMIT_EXCESS          13   /* Compute how much a process's phys_footprint exceeds inactive memory limit */
#define MEMORYSTATUS_CMD_ELEVATED_INACTIVEJETSAMPRIORITY_ENABLE 	14 /* Set the inactive jetsam band for a process to JETSAM_PRIORITY_ELEVATED_INACTIVE */
#define MEMORYSTATUS_CMD_ELEVATED_INACTIVEJETSAMPRIORITY_DISABLE 	15 /* Reset the inactive jetsam band for a process to the default band (0)*/
#define MEMORYSTATUS_CMD_SET_PROCESS_IS_MANAGED       16   /* (Re-)Set state on a process that marks it as (un-)managed by a system entity e.g. assertiond */
#define MEMORYSTATUS_CMD_GET_PROCESS_IS_MANAGED       17   /* Return the 'managed' status of a process */
#define MEMORYSTATUS_CMD_SET_PROCESS_IS_FREEZABLE     18   /* Is the process eligible for freezing? Apps and extensions can pass in FALSE to opt out of freezing, i.e.,
伪代码
struct memorystatus_priority_entry memStatus[NUM_ENTRIES];
size_t count = sizeof(struct memorystatus_priority_entry) * NUM_ENTRIES;
int kernResult = memorystatus_control(MEMORYSTATUS_CMD_GET_PRIORITY_LIST, 0, 0, memStatus, count);
if (rc < 0) {
  NSLog(@"memorystatus_control");
	return ;
}

int entry = 0;
for (; rc > 0; rc -= sizeof(struct memorystatus_priority_entry)){
  printf ("PID: %5d\tPriority:%2d\tUser Data: %llx\tLimit:%2d\tState:%s\n",
          memstatus[entry].pid,
          memstatus[entry].priority,
          memstatus[entry].user_data,
          memstatus[entry].limit,
          state_to_text(memstatus[entry].state));
  entry++;
}
for 循环打印出每个进程(也就是 App)的 pid、Priority、User Data、Limit、State 信息。从 log 中找出优先级为10的进程,即我们前台运行的 App。为什么是10? 因为 #define JETSAM_PRIORITY_FOREGROUND 10 我们的目的就是获取前台 App 的内存上限值。
4. 如何判定发生了 OOM
OOM 导致 crash 前,app 一定会收到低内存警告吗?
做2组对比实验:
// 实验1
NSMutableArray *array = [NSMutableArray array];
for (NSInteger index = 0; index < 10000000; index++) {
  NSString *filePath = [[NSBundle mainBundle] pathForResource:@"Info" ofType:@"plist"];
  NSData *data = [NSData dataWithContentsOfFile:filePath];
  [array addObject:data];
}
// 实验2
// ViewController.m
- (void)viewDidLoad {
    [super viewDidLoad];
    dispatch_async(dispatch_get_global_queue(0, 0), ^{
        NSMutableArray *array = [NSMutableArray array];
        for (NSInteger index = 0; index < 10000000; index++) {
            NSString *filePath = [[NSBundle mainBundle] pathForResource:@"Info" ofType:@"plist"];
            NSData *data = [NSData dataWithContentsOfFile:filePath];
            [array addObject:data];
        }
    });
}
- (void)didReceiveMemoryWarning
{
    NSLog(@"2");
}

// AppDelegate.m
- (void)applicationDidReceiveMemoryWarning:(UIApplication *)application
{
    NSLog(@"1");
}
现象:
- 在 viewDidLoad 也就是主线程中内存消耗过大,系统并不会发出低内存警告,直接 Crash。因为内存增长过快,主线程很忙。
- 多线程的情况下,App 因内存增长过快,会收到低内存警告,AppDelegate 中的
applicationDidReceiveMemoryWarning 先执行,随后是当前 VC 的 didReceiveMemoryWarning。
结论:
收到低内存警告不一定会 Crash,因为有6秒钟的系统判断时间,6秒内内存下降了则不会 crash。发生 OOM 也不一定会收到低内存警告。
5. 内存信息收集
要想精确的定位问题,就需要 dump 所有对象及其内存信息。当内存接近系统内存上限的时候,收集并记录所需信息,结合一定的数据上报机制,上传到服务器,分析并修复。
还需要知道每个对象具体是在哪个函数里创建出来的,以便还原“案发现场”。
源代码(libmalloc/malloc),内存分配函数 malloc 和 calloc 等默认使用 nano_zone,nano_zone 是小于 256B 以下的内存分配,大于 256B 则使用 scalable_zone 来分配。
主要针对大内存的分配监控。malloc 函数用的是 malloc_zone_malloc, calloc 用的是 malloc_zone_calloc。
使用 scalable_zone 分配内存的函数都会调用 malloc_logger 函数,因为系统为了有个地方专门统计并管理内存分配情况。这样的设计也满足「收口原则」。
void *
malloc(size_t size)
{
	void *retval;
	retval = malloc_zone_malloc(default_zone, size);
	if (retval == NULL) {
		errno = ENOMEM;
	}
	return retval;
}

void *
calloc(size_t num_items, size_t size)
{
	void *retval;
	retval = malloc_zone_calloc(default_zone, num_items, size);
	if (retval == NULL) {
		errno = ENOMEM;
	}
	return retval;
}
首先来看看这个 default_zone 是什么东西, 代码如下
typedef struct {
	malloc_zone_t malloc_zone;
	uint8_t pad[PAGE_MAX_SIZE - sizeof(malloc_zone_t)];
} virtual_default_zone_t;

static virtual_default_zone_t virtual_default_zone
__attribute__((section("__DATA,__v_zone")))
__attribute__((aligned(PAGE_MAX_SIZE))) = {
	NULL,
	NULL,
	default_zone_size,
	default_zone_malloc,
	default_zone_calloc,
	default_zone_valloc,
	default_zone_free,
	default_zone_realloc,
	default_zone_destroy,
	DEFAULT_MALLOC_ZONE_STRING,
	default_zone_batch_malloc,
	default_zone_batch_free,
	&default_zone_introspect,
	10,
	default_zone_memalign,
	default_zone_free_definite_size,
	default_zone_pressure_relief,
	default_zone_malloc_claimed_address,
};

static malloc_zone_t *default_zone = &virtual_default_zone.malloc_zone;

static void *
default_zone_malloc(malloc_zone_t *zone, size_t size)
{
	zone = runtime_default_zone();

	return zone->malloc(zone, size);
}


MALLOC_ALWAYS_INLINE
static inline malloc_zone_t *
runtime_default_zone() {
	return (lite_zone) ? lite_zone : inline_malloc_default_zone();
}
可以看到 default_zone 通过这种方式来初始化
static inline malloc_zone_t *
inline_malloc_default_zone(void)
{
	_malloc_initialize_once();
	// malloc_report(ASL_LEVEL_INFO, "In inline_malloc_default_zone with %d %d\n", malloc_num_zones, malloc_has_debug_zone);
	return malloc_zones[0];
}
随后的调用如下 _malloc_initialize -> create_scalable_zone -> create_scalable_szone 最终我们创建了 szone_t 类型的对象,通过类型转换,得到了我们的 default_zone。
malloc_zone_t *
create_scalable_zone(size_t initial_size, unsigned debug_flags) {
	return (malloc_zone_t *) create_scalable_szone(initial_size, debug_flags);
}
void *malloc_zone_malloc(malloc_zone_t *zone, size_t size)
{
  MALLOC_TRACE(TRACE_malloc | DBG_FUNC_START, (uintptr_t)zone, size, 0, 0);
  void *ptr;
  if (malloc_check_start && (malloc_check_counter++ >= malloc_check_start)) {
    internal_check();
  }
  if (size > MALLOC_ABSOLUTE_MAX_SIZE) {
    return NULL;
  }
  ptr = zone->malloc(zone, size);
  // 在 zone 分配完内存后就开始使用 malloc_logger 进行进行记录
  if (malloc_logger) {
    malloc_logger(MALLOC_LOG_TYPE_ALLOCATE | MALLOC_LOG_TYPE_HAS_ZONE, (uintptr_t)zone, (uintptr_t)size, 0, (uintptr_t)ptr, 0);
  }
  MALLOC_TRACE(TRACE_malloc | DBG_FUNC_END, (uintptr_t)zone, size, (uintptr_t)ptr, 0);
  return ptr;
}
其分配实现是 zone->malloc 根据之前的分析,就是szone_t结构体对象中对应的malloc实现。
在创建szone之后,做了一系列如下的初始化操作。
// Initialize the security token.
szone->cookie = (uintptr_t)malloc_entropy[0];

szone->basic_zone.version = 12;
szone->basic_zone.size = (void *)szone_size;
szone->basic_zone.malloc = (void *)szone_malloc;
szone->basic_zone.calloc = (void *)szone_calloc;
szone->basic_zone.valloc = (void *)szone_valloc;
szone->basic_zone.free = (void *)szone_free;
szone->basic_zone.realloc = (void *)szone_realloc;
szone->basic_zone.destroy = (void *)szone_destroy;
szone->basic_zone.batch_malloc = (void *)szone_batch_malloc;
szone->basic_zone.batch_free = (void *)szone_batch_free;
szone->basic_zone.introspect = (struct malloc_introspection_t *)&szone_introspect;
szone->basic_zone.memalign = (void *)szone_memalign;
szone->basic_zone.free_definite_size = (void *)szone_free_definite_size;
szone->basic_zone.pressure_relief = (void *)szone_pressure_relief;
szone->basic_zone.claimed_address = (void *)szone_claimed_address;
其他使用 scalable_zone 分配内存的函数的方法也类似,所以大内存的分配,不管外部函数如何封装,最终都会调用到 malloc_logger 函数。所以我们可以用 fishhook 去 hook 这个函数,然后记录内存分配情况,结合一定的数据上报机制,上传到服务器,分析并修复。
// For logging VM allocation and deallocation, arg1 here
// is the mach_port_name_t of the target task in which the
// alloc or dealloc is occurring. For example, for mmap()
// that would be mach_task_self(), but for a cross-task-capable
// call such as mach_vm_map(), it is the target task.

typedef void (malloc_logger_t)(uint32_t type, uintptr_t arg1, uintptr_t arg2, uintptr_t arg3, uintptr_t result, uint32_t num_hot_frames_to_skip);

extern malloc_logger_t *__syscall_logger;
当 malloc_logger 和 __syscall_logger 函数指针不为空时,malloc/free、vm_allocate/vm_deallocate 等内存分配/释放通过这两个指针通知上层,这也是内存调试工具 malloc stack 的实现原理。有了这两个函数指针,我们很容易记录当前存活对象的内存分配信息(包括分配大小和分配堆栈)。分配堆栈可以用 backtrace 函数捕获,但捕获到的地址是虚拟内存地址,不能从符号表 dsym 解析符号。所以还要记录每个 image 加载时的偏移 slide,这样 符号表地址 = 堆栈地址 - slide。
小 tips:
ASLR(Address space layout randomization):常见称呼为位址空间随机载入、位址空间配置随机化、位址空间布局随机化,是一种防止内存损坏漏洞被利用的计算机安全技术,通过随机放置进程关键数据区域的定址空间来放置攻击者能可靠地跳转到内存的特定位置来操作函数。现代作业系统一般都具备该机制。
函数地址 add: 函数真实的实现地址;
函数虚拟地址:vm_add;
ASLR: slide 函数虚拟地址加载到进程内存的随机偏移量,每个 mach-o 的 slide 各不相同。vm_add + slide = add。也就是:*(base +offset)= imp。
由于腾讯也开源了自己的 OOM 定位方案- OOMDetector ,有了现成的轮子,那么用好就可以了,所以对于内存的监控思路就是找到系统给 App 的内存上限,然后当接近内存上限值的时候,dump 内存情况,组装基础数据信息成一个合格的上报数据,经过一定的数据上报策略到服务端,服务端消费数据,分析产生报表,客户端工程师根据报表分析问题。不同工程的数据以邮件、短信、企业微信等形式通知到该项目的 owner、开发者。(情况严重的会直接电话给开发者,并给主管跟进每一步的处理结果)。 问题分析处理后要么发布新版本,要么 hot fix。
6. 开发阶段针对内存我们能做些什么
-
图片缩放
WWDC 2018 Session 416 - iOS Memory Deep Dive,处理图片缩放的时候直接使用 UIImage 会在解码时读取文件而占用一部分内存,还会生成中间位图 bitmap 消耗大量内存。而 ImageIO 不存在上述2种弊端,只会占用最终图片大小的内存
做了2组对比实验:给 App 显示一张图片
// 方法1: 19.6M
UIImage *imageResult = [self scaleImage:[UIImage imageNamed:@"test"]                                                  newSize:CGSizeMake(self.view.frame.size.width, self.view.frame.size.height)];
self.imageView.image = imageResult;

// 方法2: 14M
NSData *data = UIImagePNGRepresentation([UIImage imageNamed:@"test"]);
UIImage *imageResult = [self scaledImageWithData:data 				    withSize:CGSizeMake(self.view.frame.size.width, self.view.frame.size.height) scale:3 orientation:UIImageOrientationUp];
self.imageView.image = imageResult;

- (UIImage *)scaleImage:(UIImage *)image newSize:(CGSize)newSize
{
    UIGraphicsBeginImageContextWithOptions(newSize, NO, 0);
    [image drawInRect:CGRectMake(0, 0, newSize.width, newSize.height)];
    UIImage *newImage = UIGraphicsGetImageFromCurrentImageContext();
    UIGraphicsEndImageContext();
    return newImage;
}

- (UIImage *)scaledImageWithData:(NSData *)data withSize:(CGSize)size scale:(CGFloat)scale orientation:(UIImageOrientation)orientation
{
    CGFloat maxPixelSize = MAX(size.width, size.height);
    CGImageSourceRef sourceRef = CGImageSourceCreateWithData((__bridge CFDataRef)data, nil);
    NSDictionary *options = @{(__bridge id)kCGImageSourceCreateThumbnailFromImageAlways : (__bridge id)kCFBooleanTrue,
                              (__bridge id)kCGImageSourceThumbnailMaxPixelSize : [NSNumber numberWithFloat:maxPixelSize]};
    CGImageRef imageRef = CGImageSourceCreateThumbnailAtIndex(sourceRef, 0, (__bridge CFDictionaryRef)options);
    UIImage *resultImage = [UIImage imageWithCGImage:imageRef scale:scale orientation:orientation];
    CGImageRelease(imageRef);
    CFRelease(sourceRef);
    return resultImage;
}
可以看出使用 ImageIO 比使用 UIImage 直接缩放占用内存更低。
-
合理使用 autoreleasepool
我们知道 autoreleasepool 对象是在 RunLoop 结束时才释放。在 ARC 下,我们如果在不断申请内存,比如各种循环,那么我们就需要手动添加 autoreleasepool,避免短时间内内存猛涨发生 OOM。
对比实验
// 实验1
NSMutableArray *array = [NSMutableArray array];
for (NSInteger index = 0; index < 10000000; index++) {
  NSString *indexStrng = [NSString stringWithFormat:@"%zd", index];
  NSString *resultString = [NSString stringWithFormat:@"%zd-%@", index, indexStrng];
  [array addObject:resultString];
}

// 实验2
NSMutableArray *array = [NSMutableArray array];
for (NSInteger index = 0; index < 10000000; index++) {
  @autoreleasepool {
    NSString *indexStrng = [NSString stringWithFormat:@"%zd", index];
    NSString *resultString = [NSString stringWithFormat:@"%zd-%@", index, indexStrng];
    [array addObject:resultString];
  }
}
实验1消耗内存 739.6M,实验2消耗内存 587M。
-
UIGraphicsBeginImageContext 和 UIGraphicsEndImageContext 必须成双出现,不然会造成 context 泄漏。另外 XCode 的 Analyze 也能扫出这类问题。
-
不管是打开网页,还是执行 js,都应该使用 WKWebView。UIWebView 会占用大量内存,从而导致 App 发生 OOM 的几率增加,而 WKWebView 是一个多进程组件,Network Loading 以及 UI Rendering 在其它进程中执行,比 UIWebView 占用更低的内存开销。
-
在做 SDK 或者 App,如果场景是缓存相关,尽量使用 NSCache 而不是 NSMutableDictionary。它是系统提供的专门处理缓存的类,NSCache 分配的内存是 Purgeable Memory,可以由系统自动释放。NSCache 与 NSPureableData 的结合使用可以让系统根据情况回收内存,也可以在内存清理时移除对象。
其他的开发习惯就不一一描述了,良好的开发习惯和代码意识是需要平时注意修炼的。
五、 App 网络监控
移动网络环境一直很复杂,WIFI、2G、3G、4G、5G 等,用户使用 App 的过程中可能在这几种类型之间切换,这也是移动网络和传统网络间的一个区别,被称为「Connection Migration」。此外还存在 DNS 解析缓慢、失败率高、运营商劫持等问题。用户在使用 App 时因为某些原因导致体验很差,要想针对网络情况进行改善,必须有清晰的监控手段。
1. App 网络请求过程
![]()
App 发送一次网络请求一般会经历下面几个关键步骤:
-
DNS 解析
Domain Name system,网络域名名称系统,本质上就是将域名和IP 地址 相互映射的一个分布式数据库,使人们更方便的访问互联网。首先会查询本地的 DNS 缓存,查找失败就去 DNS 服务器查询,这其中可能会经过非常多的节点,涉及到递归查询和迭代查询的过程。运营商可能不干人事:一种情况就是出现运营商劫持的现象,表现为你在 App 内访问某个网页的时候会看到和内容不相关的广告;另一种可能的情况就是把你的请求丢给非常远的基站去做 DNS 解析,导致我们 App 的 DNS 解析时间较长,App 网络效率低。一般做 HTTPDNS 方案去自行解决 DNS 的问题。
-
TCP 3次握手
关于 TCP 握手过程中为什么是3次握手而不是2次、4次,可以查看这篇文章。
-
TLS 握手
对于 HTTPS 请求还需要做 TLS 握手,也就是密钥协商的过程。
-
发送请求
连接建立好之后就可以发送 request,此时可以记录下 request start 时间
-
等待回应
等待服务器返回响应。这个时间主要取决于资源大小,也是网络请求过程中最为耗时的一个阶段。
-
返回响应
服务端返回响应给客户端,根据 HTTP header 信息中的状态码判断本次请求是否成功、是否走缓存、是否需要重定向。
2. 监控原理
| 名称 |
说明 |
| NSURLConnection |
已经被废弃。用法简单 |
| NSURLSession |
iOS7.0 推出,功能更强大 |
| CFNetwork |
NSURL 的底层,纯 C 实现 |
iOS 网络框架层级关系如下:
![]()
iOS 网络现状是由4层组成的:最底层的 BSD Sockets、SecureTransport;次级底层是 CFNetwork、NSURLSession、NSURLConnection、WebView 是用 Objective-C 实现的,且调用 CFNetwork;应用层框架 AFNetworking 基于 NSURLSession、NSURLConnection 实现。
目前业界对于网络监控主要有2种:一种是通过 NSURLProtocol 监控、一种是通过 Hook 来监控。下面介绍几种办法来监控网络请求,各有优缺点。
2.1 方案一:NSURLProtocol 监控 App 网络请求<a name="network-2.1"></a>
NSURLProtocol 作为上层接口,使用较为简单,但 NSURLProtocol 属于 URL Loading System 体系中。应用协议的支持程度有限,支持 FTP、HTTP、HTTPS 等几个应用层协议,对于其他的协议则无法监控,存在一定的局限性。如果监控底层网络库 CFNetwork 则没有这个限制。
对于 NSURLProtocol 的具体做法在这篇文章中讲过,继承抽象类并实现相应的方法,自定义去发起网络请求来实现监控的目的。
iOS 10 之后,NSURLSessionTaskDelegate 中增加了一个新的代理方法:
/*
 * Sent when complete statistics information has been collected for the task.
 */
- (void)URLSession:(NSURLSession *)session task:(NSURLSessionTask *)task didFinishCollectingMetrics:(NSURLSessionTaskMetrics *)metrics API_AVAILABLE(macosx(10.12), ios(10.0), watchos(3.0), tvos(10.0));
可以从 NSURLSessionTaskMetrics 中获取到网络情况的各项指标。各项参数如下
@interface NSURLSessionTaskMetrics : NSObject

/*
 * transactionMetrics array contains the metrics collected for every request/response transaction created during the task execution.
 */
@property (copy, readonly) NSArray<NSURLSessionTaskTransactionMetrics *> *transactionMetrics;

/*
 * Interval from the task creation time to the task completion time.
 * Task creation time is the time when the task was instantiated.
 * Task completion time is the time when the task is about to change its internal state to completed.
 */
@property (copy, readonly) NSDateInterval *taskInterval;

/*
 * redirectCount is the number of redirects that were recorded.
 */
@property (assign, readonly) NSUInteger redirectCount;

- (instancetype)init API_DEPRECATED("Not supported", macos(10.12,10.15), ios(10.0,13.0), watchos(3.0,6.0), tvos(10.0,13.0));
+ (instancetype)new API_DEPRECATED("Not supported", macos(10.12,10.15), ios(10.0,13.0), watchos(3.0,6.0), tvos(10.0,13.0));

@end
其中:taskInterval 表示任务从创建到完成话费的总时间,任务的创建时间是任务被实例化时的时间,任务完成时间是任务的内部状态将要变为完成的时间;redirectCount 表示被重定向的次数;transactionMetrics 数组包含了任务执行过程中每个请求/响应事务中收集的指标,各项参数如下:
/*
 * This class defines the performance metrics collected for a request/response transaction during the task execution.
 */
API_AVAILABLE(macosx(10.12), ios(10.0), watchos(3.0), tvos(10.0))
@interface NSURLSessionTaskTransactionMetrics : NSObject

/*
 * Represents the transaction request. 请求事务
 */
@property (copy, readonly) NSURLRequest *request;

/*
 * Represents the transaction response. Can be nil if error occurred and no response was generated. 响应事务
 */
@property (nullable, copy, readonly) NSURLResponse *response;

/*
 * For all NSDate metrics below, if that aspect of the task could not be completed, then the corresponding “EndDate” metric will be nil.
 * For example, if a name lookup was started but the name lookup timed out, failed, or the client canceled the task before the name could be resolved -- then while domainLookupStartDate may be set, domainLookupEndDate will be nil along with all later metrics.
 */

/*
 * 客户端开始请求的时间,无论是从服务器还是从本地缓存中获取
 * fetchStartDate returns the time when the user agent started fetching the resource, whether or not the resource was retrieved from the server or local resources.
 *
 * The following metrics will be set to nil, if a persistent connection was used or the resource was retrieved from local resources:
 *
 *   domainLookupStartDate
 *   domainLookupEndDate
 *   connectStartDate
 *   connectEndDate
 *   secureConnectionStartDate
 *   secureConnectionEndDate
 */
@property (nullable, copy, readonly) NSDate *fetchStartDate;

/*
 * domainLookupStartDate returns the time immediately before the user agent started the name lookup for the resource. DNS 开始解析的时间
 */
@property (nullable, copy, readonly) NSDate *domainLookupStartDate;

/*
 * domainLookupEndDate returns the time after the name lookup was completed. DNS 解析完成的时间
 */
@property (nullable, copy, readonly) NSDate *domainLookupEndDate;

/*
 * connectStartDate is the time immediately before the user agent started establishing the connection to the server.
 *
 * For example, this would correspond to the time immediately before the user agent started trying to establish the TCP connection. 客户端与服务端开始建立 TCP 连接的时间
 */
@property (nullable, copy, readonly) NSDate *connectStartDate;

/*
 * If an encrypted connection was used, secureConnectionStartDate is the time immediately before the user agent started the security handshake to secure the current connection. HTTPS 的 TLS 握手开始的时间
 *
 * For example, this would correspond to the time immediately before the user agent started the TLS handshake.
 *
 * If an encrypted connection was not used, this attribute is set to nil.
 */
@property (nullable, copy, readonly) NSDate *secureConnectionStartDate;

/*
 * If an encrypted connection was used, secureConnectionEndDate is the time immediately after the security handshake completed. HTTPS 的 TLS 握手结束的时间
 *
 * If an encrypted connection was not used, this attribute is set to nil.
 */
@property (nullable, copy, readonly) NSDate *secureConnectionEndDate;

/*
 * connectEndDate is the time immediately after the user agent finished establishing the connection to the server, including completion of security-related and other handshakes. 客户端与服务器建立 TCP 连接完成的时间,包括 TLS 握手时间
 */
@property (nullable, copy, readonly) NSDate *connectEndDate;

/*
 * requestStartDate is the time immediately before the user agent started requesting the source, regardless of whether the resource was retrieved from the server or local resources.
 客户端请求开始的时间,可以理解为开始传输 HTTP 请求的 header 的第一个字节时间
 *
 * For example, this would correspond to the time immediately before the user agent sent an HTTP GET request.
 */
@property (nullable, copy, readonly) NSDate *requestStartDate;

/*
 * requestEndDate is the time immediately after the user agent finished requesting the source, regardless of whether the resource was retrieved from the server or local resources.
 客户端请求结束的时间,可以理解为 HTTP 请求的最后一个字节传输完成的时间
 *
 * For example, this would correspond to the time immediately after the user agent finished sending the last byte of the request.
 */
@property (nullable, copy, readonly) NSDate *requestEndDate;

/*
 * responseStartDate is the time immediately after the user agent received the first byte of the response from the server or from local resources.
 客户端从服务端接收响应的第一个字节的时间
 *
 * For example, this would correspond to the time immediately after the user agent received the first byte of an HTTP response.
 */
@property (nullable, copy, readonly) NSDate *responseStartDate;

/*
 * responseEndDate is the time immediately after the user agent received the last byte of the resource. 客户端从服务端接收到最后一个请求的时间
 */
@property (nullable, copy, readonly) NSDate *responseEndDate;

/*
 * The network protocol used to fetch the resource, as identified by the ALPN Protocol ID Identification Sequence [RFC7301].
 * E.g., h2, http/1.1, spdy/3.1.
 网络协议名,比如 http/1.1, spdy/3.1
 *
 * When a proxy is configured AND a tunnel connection is established, then this attribute returns the value for the tunneled protocol.
 *
 * For example:
 * If no proxy were used, and HTTP/2 was negotiated, then h2 would be returned.
 * If HTTP/1.1 were used to the proxy, and the tunneled connection was HTTP/2, then h2 would be returned.
 * If HTTP/1.1 were used to the proxy, and there were no tunnel, then http/1.1 would be returned.
 *
 */
@property (nullable, copy, readonly) NSString *networkProtocolName;

/*
 * This property is set to YES if a proxy connection was used to fetch the resource.
	该连接是否使用了代理
 */
@property (assign, readonly, getter=isProxyConnection) BOOL proxyConnection;

/*
 * This property is set to YES if a persistent connection was used to fetch the resource.
 是否复用了现有连接
 */
@property (assign, readonly, getter=isReusedConnection) BOOL reusedConnection;

/*
 * Indicates whether the resource was loaded, pushed or retrieved from the local cache.
 获取资源来源
 */
@property (assign, readonly) NSURLSessionTaskMetricsResourceFetchType resourceFetchType;

/*
 * countOfRequestHeaderBytesSent is the number of bytes transferred for request header.
 请求头的字节数
 */
@property (readonly) int64_t countOfRequestHeaderBytesSent API_AVAILABLE(macos(10.15), ios(13.0), watchos(6.0), tvos(13.0));

/*
 * countOfRequestBodyBytesSent is the number of bytes transferred for request body.
 请求体的字节数
 * It includes protocol-specific framing, transfer encoding, and content encoding.
 */
@property (readonly) int64_t countOfRequestBodyBytesSent API_AVAILABLE(macos(10.15), ios(13.0), watchos(6.0), tvos(13.0));

/*
 * countOfRequestBodyBytesBeforeEncoding is the size of upload body data, file, or stream.
 上传体数据、文件、流的大小
 */
@property (readonly) int64_t countOfRequestBodyBytesBeforeEncoding API_AVAILABLE(macos(10.15), ios(13.0), watchos(6.0), tvos(13.0));

/*
 * countOfResponseHeaderBytesReceived is the number of bytes transferred for response header.
 响应头的字节数
 */
@property (readonly) int64_t countOfResponseHeaderBytesReceived API_AVAILABLE(macos(10.15), ios(13.0), watchos(6.0), tvos(13.0));

/*
 * countOfResponseBodyBytesReceived is the number of bytes transferred for response body.
 响应体的字节数
 * It includes protocol-specific framing, transfer encoding, and content encoding.
 */
@property (readonly) int64_t countOfResponseBodyBytesReceived API_AVAILABLE(macos(10.15), ios(13.0), watchos(6.0), tvos(13.0));

/*
 * countOfResponseBodyBytesAfterDecoding is the size of data delivered to your delegate or completion handler.
给代理方法或者完成后处理的回调的数据大小

 */
@property (readonly) int64_t countOfResponseBodyBytesAfterDecoding API_AVAILABLE(macos(10.15), ios(13.0), watchos(6.0), tvos(13.0));

/*
 * localAddress is the IP address string of the local interface for the connection.
  当前连接下的本地接口 IP 地址
 *
 * For multipath protocols, this is the local address of the initial flow.
 *
 * If a connection was not used, this attribute is set to nil.
 */
@property (nullable, copy, readonly) NSString *localAddress API_AVAILABLE(macos(10.15), ios(13.0), watchos(6.0), tvos(13.0));

/*
 * localPort is the port number of the local interface for the connection.
 当前连接下的本地端口号

 *
 * For multipath protocols, this is the local port of the initial flow.
 *
 * If a connection was not used, this attribute is set to nil.
 */
@property (nullable, copy, readonly) NSNumber *localPort API_AVAILABLE(macos(10.15), ios(13.0), watchos(6.0), tvos(13.0));

/*
 * remoteAddress is the IP address string of the remote interface for the connection.
 当前连接下的远端 IP 地址
 *
 * For multipath protocols, this is the remote address of the initial flow.
 *
 * If a connection was not used, this attribute is set to nil.
 */
@property (nullable, copy, readonly) NSString *remoteAddress API_AVAILABLE(macos(10.15), ios(13.0), watchos(6.0), tvos(13.0));

/*
 * remotePort is the port number of the remote interface for the connection.
  当前连接下的远端端口号
 *
 * For multipath protocols, this is the remote port of the initial flow.
 *
 * If a connection was not used, this attribute is set to nil.
 */
@property (nullable, copy, readonly) NSNumber *remotePort API_AVAILABLE(macos(10.15), ios(13.0), watchos(6.0), tvos(13.0));

/*
 * negotiatedTLSProtocolVersion is the TLS protocol version negotiated for the connection.
  连接协商用的 TLS 协议版本号
 * It is a 2-byte sequence in host byte order.
 *
 * Please refer to tls_protocol_version_t enum in Security/SecProtocolTypes.h
 *
 * If an encrypted connection was not used, this attribute is set to nil.
 */
@property (nullable, copy, readonly) NSNumber *negotiatedTLSProtocolVersion API_AVAILABLE(macos(10.15), ios(13.0), watchos(6.0), tvos(13.0));

/*
 * negotiatedTLSCipherSuite is the TLS cipher suite negotiated for the connection.
 连接协商用的 TLS 密码套件
 * It is a 2-byte sequence in host byte order.
 *
 * Please refer to tls_ciphersuite_t enum in Security/SecProtocolTypes.h
 *
 * If an encrypted connection was not used, this attribute is set to nil.
 */
@property (nullable, copy, readonly) NSNumber *negotiatedTLSCipherSuite API_AVAILABLE(macos(10.15), ios(13.0), watchos(6.0), tvos(13.0));

/*
 * Whether the connection is established over a cellular interface.
 是否是通过蜂窝网络建立的连接
 */
@property (readonly, getter=isCellular) BOOL cellular API_AVAILABLE(macos(10.15), ios(13.0), watchos(6.0), tvos(13.0));

/*
 * Whether the connection is established over an expensive interface.
 是否通过昂贵的接口建立的连接
 */
@property (readonly, getter=isExpensive) BOOL expensive API_AVAILABLE(macos(10.15), ios(13.0), watchos(6.0), tvos(13.0));

/*
 * Whether the connection is established over a constrained interface.
 是否通过受限接口建立的连接
 */
@property (readonly, getter=isConstrained) BOOL constrained API_AVAILABLE(macos(10.15), ios(13.0), watchos(6.0), tvos(13.0));

/*
 * Whether a multipath protocol is successfully negotiated for the connection.
 是否为了连接成功协商了多路径协议
 */
@property (readonly, getter=isMultipath) BOOL multipath API_AVAILABLE(macos(10.15), ios(13.0), watchos(6.0), tvos(13.0));


- (instancetype)init API_DEPRECATED("Not supported", macos(10.12,10.15), ios(10.0,13.0), watchos(3.0,6.0), tvos(10.0,13.0));
+ (instancetype)new API_DEPRECATED("Not supported", macos(10.12,10.15), ios(10.0,13.0), watchos(3.0,6.0), tvos(10.0,13.0));

@end
网络监控简单代码
// 监控基础信息
@interface  NetworkMonitorBaseDataModel : NSObject
// 请求的 URL 地址
@property (nonatomic, strong) NSString *requestUrl;
//请求头
@property (nonatomic, strong) NSArray *requestHeaders;
//响应头
@property (nonatomic, strong) NSArray *responseHeaders;
//GET方法 的请求参数
@property (nonatomic, strong) NSString *getRequestParams;
//HTTP 方法, 比如 POST
@property (nonatomic, strong) NSString *httpMethod;
//协议名,如http1.0 / http1.1 / http2.0
@property (nonatomic, strong) NSString *httpProtocol;
//是否使用代理
@property (nonatomic, assign) BOOL useProxy;
//DNS解析后的 IP 地址
@property (nonatomic, strong) NSString *ip;
@end

// 监控信息模型
@interface  NetworkMonitorDataModel : NetworkMonitorBaseDataModel
//客户端发起请求的时间
@property (nonatomic, assign) UInt64 requestDate;
//客户端开始请求到开始dns解析的等待时间,单位ms
@property (nonatomic, assign) int waitDNSTime;
//DNS 解析耗时
@property (nonatomic, assign) int dnsLookupTime;
//tcp 三次握手耗时,单位ms
@property (nonatomic, assign) int tcpTime;
//ssl 握手耗时
@property (nonatomic, assign) int sslTime;
//一个完整请求的耗时,单位ms
@property (nonatomic, assign) int requestTime;
//http 响应码
@property (nonatomic, assign) NSUInteger httpCode;
//发送的字节数
@property (nonatomic, assign) UInt64 sendBytes;
//接收的字节数
@property (nonatomic, assign) UInt64 receiveBytes;


// 错误信息模型
@interface  NetworkMonitorErrorModel : NetworkMonitorBaseDataModel
//错误码
@property (nonatomic, assign) NSInteger errorCode;
//错误次数
@property (nonatomic, assign) NSUInteger errCount;
//异常名
@property (nonatomic, strong) NSString *exceptionName;
//异常详情
@property (nonatomic, strong) NSString *exceptionDetail;
//异常堆栈
@property (nonatomic, strong) NSString *stackTrace;
@end


// 继承自 NSURLProtocol 抽象类,实现响应方法,代理网络请求
@interface CustomURLProtocol () <NSURLSessionTaskDelegate>

@property (nonatomic, strong) NSURLSessionDataTask *dataTask;
@property (nonatomic, strong) NSOperationQueue *sessionDelegateQueue;
@property (nonatomic, strong) NetworkMonitorDataModel *dataModel;
@property (nonatomic, strong) NetworkMonitorErrorModel *errModel;

@end

//使用NSURLSessionDataTask请求网络
- (void)startLoading {
    NSURLSessionConfiguration *configuration = [NSURLSessionConfiguration defaultSessionConfiguration];
  	NSURLSession *session = [NSURLSession sessionWithConfiguration:configuration
                                                          delegate:self
                                                     delegateQueue:nil];
    NSURLSession *session = [NSURLSession sessionWithConfiguration:configuration delegate:self delegateQueue:nil];
  	self.sessionDelegateQueue = [[NSOperationQueue alloc] init];
    self.sessionDelegateQueue.maxConcurrentOperationCount = 1;
    self.sessionDelegateQueue.name = @"com.networkMonitor.session.queue";
    self.dataTask = [session dataTaskWithRequest:self.request];
    [self.dataTask resume];
}

#pragma mark - NSURLSessionTaskDelegate
- (void)URLSession:(NSURLSession *)session task:(NSURLSessionTask *)task didCompleteWithError:(NSError *)error {
    if (error) {
        [self.client URLProtocol:self didFailWithError:error];
    } else {
        [self.client URLProtocolDidFinishLoading:self];
    }
    if (error) {
        NSURLRequest *request = task.currentRequest;
        if (request) {
            self.errModel.requestUrl  = request.URL.absoluteString;
            self.errModel.httpMethod = request.HTTPMethod;
            self.errModel.requestParams = request.URL.query;
        }
        self.errModel.errorCode = error.code;
        self.errModel.exceptionName = error.domain;
        self.errModel.exceptionDetail = error.description;
      // 上传 Network 数据到数据上报组件,数据上报会在 [打造功能强大、灵活可配置的数据上报组件](https://github.com/FantasticLBP/knowledge-kit/blob/master/Chapter1%20-%20iOS/1.80.md) 讲
    }
    self.dataTask = nil;
}


- (void)URLSession:(NSURLSession *)session task:(NSURLSessionTask *)task didFinishCollectingMetrics:(NSURLSessionTaskMetrics *)metrics {
       if (@available(iOS 10.0, *) && [metrics.transactionMetrics count] > 0) {
        [metrics.transactionMetrics enumerateObjectsUsingBlock:^(NSURLSessionTaskTransactionMetrics *_Nonnull obj, NSUInteger idx, BOOL *_Nonnull stop) {
            if (obj.resourceFetchType == NSURLSessionTaskMetricsResourceFetchTypeNetworkLoad) {
                if (obj.fetchStartDate) {
                    self.dataModel.requestDate = [obj.fetchStartDate timeIntervalSince1970] * 1000;
                }
                if (obj.domainLookupStartDate && obj.domainLookupEndDate) {
                    self.dataModel. waitDNSTime = ceil([obj.domainLookupStartDate timeIntervalSinceDate:obj.fetchStartDate] * 1000);
                    self.dataModel. dnsLookupTime = ceil([obj.domainLookupEndDate timeIntervalSinceDate:obj.domainLookupStartDate] * 1000);
                }
                if (obj.connectStartDate) {
                    if (obj.secureConnectionStartDate) {
                        self.dataModel. waitDNSTime = ceil([obj.secureConnectionStartDate timeIntervalSinceDate:obj.connectStartDate] * 1000);
                    } else if (obj.connectEndDate) {
                        self.dataModel.tcpTime = ceil([obj.connectEndDate timeIntervalSinceDate:obj.connectStartDate] * 1000);
                    }
                }
                if (obj.secureConnectionEndDate && obj.secureConnectionStartDate) {
                    self.dataModel.sslTime = ceil([obj.secureConnectionEndDate timeIntervalSinceDate:obj.secureConnectionStartDate] * 1000);
                }

                if (obj.fetchStartDate && obj.responseEndDate) {
                    self.dataModel.requestTime = ceil([obj.responseEndDate timeIntervalSinceDate:obj.fetchStartDate] * 1000);
                }

                self.dataModel.httpProtocol = obj.networkProtocolName;

                NSHTTPURLResponse *response = (NSHTTPURLResponse *)obj.response;
                if ([response isKindOfClass:NSHTTPURLResponse.class]) {
                    self.dataModel.receiveBytes = response.expectedContentLength;
                }

                if ([obj respondsToSelector:@selector(_remoteAddressAndPort)]) {
                    self.dataModel.ip = [obj valueForKey:@"_remoteAddressAndPort"];
                }

                if ([obj respondsToSelector:@selector(_requestHeaderBytesSent)]) {
                    self.dataModel.sendBytes = [[obj valueForKey:@"_requestHeaderBytesSent"] unsignedIntegerValue];
                }
                if ([obj respondsToSelector:@selector(_responseHeaderBytesReceived)]) {
                    self.dataModel.receiveBytes = [[obj valueForKey:@"_responseHeaderBytesReceived"] unsignedIntegerValue];
                }

               self.dataModel.requestUrl = [obj.request.URL absoluteString];
                self.dataModel.httpMethod = obj.request.HTTPMethod;
                self.dataModel.useProxy = obj.isProxyConnection;
            }
        }];
				// 上传 Network 数据到数据上报组件,数据上报会在 [打造功能强大、灵活可配置的数据上报组件](https://github.com/FantasticLBP/knowledge-kit/blob/master/Chapter1%20-%20iOS/1.80.md) 讲
    }
}
2.2 方案二:NSURLProtocol 监控 App 网络请求之黑魔法篇 <a name="network-2.2"></a>
文章上面 2.1 分析到了 NSURLSessionTaskMetrics 由于兼容性问题,对于网络监控来说似乎不太完美,但是自后在搜资料的时候看到了一篇文章。文章在分析 WebView 的网络监控的时候分析 Webkit 源码的时候发现了下面代码
#if !HAVE(TIMINGDATAOPTIONS)
void setCollectsTimingData()
{
    static dispatch_once_t onceToken;
    dispatch_once(&onceToken, ^{
        [NSURLConnection _setCollectsTimingData:YES];
        ...
    });
}
#endif
也就是说明 NSURLConnection 本身有一套 TimingData 的收集 API,只是没有暴露给开发者,苹果自己在用而已。在 runtime header 中找到了 NSURLConnection 的 _setCollectsTimingData: 、_timingData 2个 api(iOS8 以后可以使用)。
NSURLSession 在 iOS9 之前使用 _setCollectsTimingData: 就可以使用 TimingData 了。
注意:
- 因为是私有 API,所以在使用的时候注意混淆。比如
[[@"_setC" stringByAppendingString:@"ollectsT"] stringByAppendingString:@"imingData:"]。
- 不推荐私有 API,一般做 APM 的属于公共团队,你想想看虽然你做的 SDK 达到网络监控的目的了,但是万一给业务线的 App 上架造成了问题,那就得不偿失了。一般这种投机取巧,不是百分百确定的事情可以在玩具阶段使用。
@interface _NSURLConnectionProxy : DelegateProxy

@end

@implementation _NSURLConnectionProxy

- (BOOL)respondsToSelector:(SEL)aSelector
{
    if ([NSStringFromSelector(aSelector) isEqualToString:@"connectionDidFinishLoading:"]) {
        return YES;
    }
    return [self.target respondsToSelector:aSelector];
}

- (void)forwardInvocation:(NSInvocation *)invocation
{
    [super forwardInvocation:invocation];
    if ([NSStringFromSelector(invocation.selector) isEqualToString:@"connectionDidFinishLoading:"]) {
        __unsafe_unretained NSURLConnection *conn;
        [invocation getArgument:&conn atIndex:2];
        SEL selector = NSSelectorFromString([@"_timin" stringByAppendingString:@"gData"]);
        NSDictionary *timingData = [conn performSelector:selector];
        [[NTDataKeeper shareInstance] trackTimingData:timingData request:conn.currentRequest];
    }
}

@end

@implementation NSURLConnection(tracker)

+ (void)load
{
    static dispatch_once_t onceToken;
    dispatch_once(&onceToken, ^{
        Class class = [self class];

        SEL originalSelector = @selector(initWithRequest:delegate:);
        SEL swizzledSelector = @selector(swizzledInitWithRequest:delegate:);

        Method originalMethod = class_getInstanceMethod(class, originalSelector);
        Method swizzledMethod = class_getInstanceMethod(class, swizzledSelector);
        method_exchangeImplementations(originalMethod, swizzledMethod);

        NSString *selectorName = [[@"_setC" stringByAppendingString:@"ollectsT"] stringByAppendingString:@"imingData:"];
        SEL selector = NSSelectorFromString(selectorName);
        [NSURLConnection performSelector:selector withObject:@(YES)];
    });
}

- (instancetype)swizzledInitWithRequest:(NSURLRequest *)request delegate:(id<NSURLConnectionDelegate>)delegate
{
    if (delegate) {
        _NSURLConnectionProxy *proxy = [[_NSURLConnectionProxy alloc] initWithTarget:delegate];
        objc_setAssociatedObject(delegate ,@"_NSURLConnectionProxy" ,proxy, OBJC_ASSOCIATION_RETAIN_NONATOMIC);
        return [self swizzledInitWithRequest:request delegate:(id<NSURLConnectionDelegate>)proxy];
    }else{
        return [self swizzledInitWithRequest:request delegate:delegate];
    }
}

@end
2.3 方案三:Hook
iOS 中 hook 技术有2类,一种是 NSProxy,一种是 method swizzling(isa swizzling)
2.3.1 方法一
写 SDK 肯定不可能手动侵入业务代码(你没那个权限提交到线上代码 😂),所以不管是 APM 还是无痕埋点都是通过 Hook 的方式。
面向切面程序设计(Aspect-oriented Programming,AOP)是计算机科学中的一种程序设计范型,将横切关注点与业务主体进一步分离,以提高程序代码的模块化程度。在不修改源代码的情况下给程序动态增加功能。其核心思想是将业务逻辑(核心关注点,系统主要功能)与公共功能(横切关注点,比如日志系统)进行分离,降低复杂性,保持系统模块化程度、可维护性、可重用性。常被用在日志系统、性能统计、安全控制、事务处理、异常处理等场景下。
在 iOS 中 AOP 的实现是基于 Runtime 机制,目前由3种方式:Method Swizzling、NSProxy、FishHook(主要用用于 hook c 代码)。
文章上面 2.1 讨论了满足大多数的需求的场景,NSURLProtocol 监控了 NSURLConnection、NSURLSession 的网络请求,自身代理后可以发起网络请求并得到诸如请求开始时间、请求结束时间、header 信息等,但是无法得到非常详细的网络性能数据,比如 DNS 开始解析时间、DNS 解析用了多久、reponse 开始返回的时间、返回了多久等。 iOS10 之后 NSURLSessionTaskDelegate 增加了一个代理方法 - (void)URLSession:(NSURLSession *)session task:(NSURLSessionTask *)task didFinishCollectingMetrics:(NSURLSessionTaskMetrics *)metrics API_AVAILABLE(macosx(10.12), ios(10.0), watchos(3.0), tvos(10.0));,可以获取到精确的各项网络数据。但是具有兼容性。文章上面 2.2 讨论了从 Webkit 源码中得到的信息,通过私有方法 _setCollectsTimingData: 、_timingData 可以获取到 TimingData。
但是如果需要监全部的网络请求就不能满足需求了,查阅资料后发现了阿里百川有 APM 的解决方案,于是有了方案3,对于网络监控需要做如下的处理 ![]()
可能对于 CFNetwork 比较陌生,可以看一下 CFNetwork 的层级和简单用法 ![]()
CFNetwork 的基础是 CFSocket 和 CFStream。
CFSocket:Socket 是网络通信的底层基础,可以让2个 socket 端口互发数据,iOS 中最常用的 socket 抽象是 BSD socket。而 CFSocket 是 BSD socket 的 OC 包装,几乎实现了所有的 BSD 功能,此外加入了 RunLoop。
CFStream:提供了与设备无关的读写数据方法,使用它可以为内存、文件、网络(使用 socket)的数据建立流,使用 stream 可以不必将所有数据写入到内存中。CFStream 提供 API 对2种 CFType 对象提供抽象:CFReadStream、CFWriteStream。同时也是 CFHTTP、CFFTP 的基础。
简单 Demo
- (void)testCFNetwork
{
    CFURLRef urlRef = CFURLCreateWithString(kCFAllocatorDefault, CFSTR("https://httpbin.org/get"), NULL);
    CFHTTPMessageRef httpMessageRef = CFHTTPMessageCreateRequest(kCFAllocatorDefault, CFSTR("GET"), urlRef, kCFHTTPVersion1_1);
    CFRelease(urlRef);

    CFReadStreamRef readStream = CFReadStreamCreateForHTTPRequest(kCFAllocatorDefault, httpMessageRef);
    CFRelease(httpMessageRef);

    CFReadStreamScheduleWithRunLoop(readStream, CFRunLoopGetCurrent(), kCFRunLoopCommonModes);

    CFOptionFlags eventFlags = (kCFStreamEventHasBytesAvailable | kCFStreamEventErrorOccurred | kCFStreamEventEndEncountered);
    CFStreamClientContext context = {
        0,
        NULL,
        NULL,
        NULL,
       NULL
    } ;
    // Assigns a client to a stream, which receives callbacks when certain events occur.
    CFReadStreamSetClient(readStream, eventFlags, CFNetworkRequestCallback, &context);
    // Opens a stream for reading.
    CFReadStreamOpen(readStream);
}
// callback
void CFNetworkRequestCallback (CFReadStreamRef _Null_unspecified stream, CFStreamEventType type, void * _Null_unspecified clientCallBackInfo) {
    CFMutableDataRef responseBytes = CFDataCreateMutable(kCFAllocatorDefault, 0);
    CFIndex numberOfBytesRead = 0;
    do {
        UInt8 buffer[2014];
        numberOfBytesRead = CFReadStreamRead(stream, buffer, sizeof(buffer));
        if (numberOfBytesRead > 0) {
            CFDataAppendBytes(responseBytes, buffer, numberOfBytesRead);
        }
    } while (numberOfBytesRead > 0);


    CFHTTPMessageRef response = (CFHTTPMessageRef)CFReadStreamCopyProperty(stream, kCFStreamPropertyHTTPResponseHeader);
    if (responseBytes) {
        if (response) {
            CFHTTPMessageSetBody(response, responseBytes);
        }
        CFRelease(responseBytes);
    }

    // close and cleanup
    CFReadStreamClose(stream);
    CFReadStreamUnscheduleFromRunLoop(stream, CFRunLoopGetCurrent(), kCFRunLoopCommonModes);
    CFRelease(stream);

    // print response
    if (response) {
        CFDataRef reponseBodyData = CFHTTPMessageCopyBody(response);
        CFRelease(response);

        printResponseData(reponseBodyData);
        CFRelease(reponseBodyData);
    }
}

void printResponseData (CFDataRef responseData) {
    CFIndex dataLength = CFDataGetLength(responseData);
    UInt8 *bytes = (UInt8 *)malloc(dataLength);
    CFDataGetBytes(responseData, CFRangeMake(0, CFDataGetLength(responseData)), bytes);
    CFStringRef responseString = CFStringCreateWithBytes(kCFAllocatorDefault, bytes, dataLength, kCFStringEncodingUTF8, TRUE);
    CFShow(responseString);
    CFRelease(responseString);
    free(bytes);
}
// console
{
  "args": {},
  "headers": {
    "Host": "httpbin.org",
    "User-Agent": "Test/1 CFNetwork/1125.2 Darwin/19.3.0",
    "X-Amzn-Trace-Id": "Root=1-5e8980d0-581f3f44724c7140614c2564"
  },
  "origin": "183.159.122.102",
  "url": "https://httpbin.org/get"
}
我们知道 NSURLSession、NSURLConnection、CFNetwork 的使用都需要调用一堆方法进行设置然后需要设置代理对象,实现代理方法。所以针对这种情况进行监控首先想到的是使用 runtime hook 掉方法层级。但是针对设置的代理对象的代理方法没办法 hook,因为不知道代理对象是哪个类。所以想办法可以 hook 设置代理对象这个步骤,将代理对象替换成我们设计好的某个类,然后让这个类去实现 NSURLConnection、NSURLSession、CFNetwork 相关的代理方法。然后在这些方法的内部都去调用一下原代理对象的方法实现。所以我们的需求得以满足,我们在相应的方法里面可以拿到监控数据,比如请求开始时间、结束时间、状态码、内容大小等。
NSURLSession、NSURLConnection hook 如下。 ![]()
![]()
业界有 APM 针对 CFNetwork 的方案,整理描述下:
CFNetwork 是 c 语言实现的,要对 c 代码进行 hook 需要使用 Dynamic Loader Hook 库 - fishhook。
Dynamic Loader(dyld)通过更新 Mach-O 文件中保存的指针的方法来绑定符号。借用它可以在 Runtime 修改 C 函数调用的函数指针。fishhook 的实现原理:遍历 __DATA segment 里面 __nl_symbol_ptr 、__la_symbol_ptr 两个 section 里面的符号,通过 Indirect Symbol Table、Symbol Table 和 String Table 的配合,找到自己要替换的函数,达到 hook 的目的。
/* Returns the number of bytes read, or -1 if an error occurs preventing any
bytes from being read, or 0 if the stream's end was encountered.
It is an error to try and read from a stream that hasn't been opened first.
This call will block until at least one byte is available; it will NOT block
until the entire buffer can be filled. To avoid blocking, either poll using
CFReadStreamHasBytesAvailable() or use the run loop and listen for the
kCFStreamEventHasBytesAvailable event for notification of data available. */
CF_EXPORT
CFIndex CFReadStreamRead(CFReadStreamRef _Null_unspecified stream, UInt8 * _Null_unspecified buffer, CFIndex bufferLength);
CFNetwork 使用 CFReadStreamRef 来传递数据,使用回调函数的形式来接受服务器的响应。当回调函数受到
具体步骤及其关键代码如下,以 NSURLConnection 举例
-
因为要 Hook 挺多地方,所以写一个 method swizzling 的工具类
#import <Foundation/Foundation.h>

NS_ASSUME_NONNULL_BEGIN

@interface NSObject (hook)

/**
 hook对象方法

 @param originalSelector 需要hook的原始对象方法
 @param swizzledSelector 需要替换的对象方法
 */
+ (void)apm_swizzleMethod:(SEL)originalSelector swizzledSelector:(SEL)swizzledSelector;

/**
 hook类方法

 @param originalSelector 需要hook的原始类方法
 @param swizzledSelector 需要替换的类方法
 */
+ (void)apm_swizzleClassMethod:(SEL)originalSelector swizzledSelector:(SEL)swizzledSelector;

@end

NS_ASSUME_NONNULL_END

+ (void)apm_swizzleMethod:(SEL)originalSelector swizzledSelector:(SEL)swizzledSelector
{
    class_swizzleInstanceMethod(self, originalSelector, swizzledSelector);
}

+ (void)apm_swizzleClassMethod:(SEL)originalSelector swizzledSelector:(SEL)swizzledSelector
{
    //类方法实际上是储存在类对象的类(即元类)中,即类方法相当于元类的实例方法,所以只需要把元类传入,其他逻辑和交互实例方法一样。
    Class class2 = object_getClass(self);
    class_swizzleInstanceMethod(class2, originalSelector, swizzledSelector);
}

void class_swizzleInstanceMethod(Class class, SEL originalSEL, SEL replacementSEL)
{
    Method originMethod = class_getInstanceMethod(class, originalSEL);
    Method replaceMethod = class_getInstanceMethod(class, replacementSEL);

    if(class_addMethod(class, originalSEL, method_getImplementation(replaceMethod),method_getTypeEncoding(replaceMethod)))
    {
        class_replaceMethod(class,replacementSEL, method_getImplementation(originMethod), method_getTypeEncoding(originMethod));
    }else {
        method_exchangeImplementations(originMethod, replaceMethod);
    }
}
-
建立一个继承自 NSProxy 抽象类的类,实现相应方法。
#import <Foundation/Foundation.h>

NS_ASSUME_NONNULL_BEGIN

// 为 NSURLConnection、NSURLSession、CFNetwork 代理设置代理转发
@interface NetworkDelegateProxy : NSProxy

+ (instancetype)setProxyForObject:(id)originalTarget withNewDelegate:(id)newDelegate;

@end

NS_ASSUME_NONNULL_END

// .m
@interface NetworkDelegateProxy () {
    id _originalTarget;
    id _NewDelegate;
}

@end


@implementation NetworkDelegateProxy

#pragma mark - life cycle

+ (instancetype)sharedInstance {
    static NetworkDelegateProxy *_sharedInstance = nil;

    static dispatch_once_t onceToken;

    dispatch_once(&onceToken, ^{
        _sharedInstance = [NetworkDelegateProxy alloc];
    });

    return _sharedInstance;
}


#pragma mark - public Method

+ (instancetype)setProxyForObject:(id)originalTarget withNewDelegate:(id)newDelegate
{
    NetworkDelegateProxy *instance = [NetworkDelegateProxy sharedInstance];
    instance->_originalTarget = originalTarget;
    instance->_NewDelegate = newDelegate;
    return instance;
}

- (void)forwardInvocation:(NSInvocation *)invocation
{
    if ([_originalTarget respondsToSelector:invocation.selector]) {
        [invocation invokeWithTarget:_originalTarget];
        [((NSURLSessionAndConnectionImplementor *)_NewDelegate) invoke:invocation];
    }
}

- (nullable NSMethodSignature *)methodSignatureForSelector:(SEL)sel
{
    return [_originalTarget methodSignatureForSelector:sel];
}

@end
-
创建一个对象,实现 NSURLConnection、NSURLSession、NSIuputStream 代理方法
// NetworkImplementor.m

#pragma mark-NSURLConnectionDelegate
- (void)connection:(NSURLConnection *)connection didFailWithError:(NSError *)error {
    NSLog(@"%s", __func__);
}

- (nullable NSURLRequest *)connection:(NSURLConnection *)connection willSendRequest:(NSURLRequest *)request redirectResponse:(nullable NSURLResponse *)response {
    NSLog(@"%s", __func__);
    return request;
}

#pragma mark-NSURLConnectionDataDelegate
- (void)connection:(NSURLConnection *)connection didReceiveResponse:(NSURLResponse *)response {
    NSLog(@"%s", __func__);
}

- (void)connection:(NSURLConnection *)connection didReceiveData:(NSData *)data {
   NSLog(@"%s", __func__);
}

- (void)connection:(NSURLConnection *)connection   didSendBodyData:(NSInteger)bytesWritten
 totalBytesWritten:(NSInteger)totalBytesWritten
totalBytesExpectedToWrite:(NSInteger)totalBytesExpectedToWrite {
    NSLog(@"%s", __func__);
}

- (void)connectionDidFinishLoading:(NSURLConnection *)connection {
    NSLog(@"%s", __func__);
}

#pragma mark-NSURLConnectionDownloadDelegate
- (void)connection:(NSURLConnection *)connection didWriteData:(long long)bytesWritten totalBytesWritten:(long long)totalBytesWritten expectedTotalBytes:(long long) expectedTotalBytes {
    NSLog(@"%s", __func__);
}

- (void)connectionDidResumeDownloading:(NSURLConnection *)connection totalBytesWritten:(long long)totalBytesWritten expectedTotalBytes:(long long) expectedTotalBytes {
    NSLog(@"%s", __func__);
}

- (void)connectionDidFinishDownloading:(NSURLConnection *)connection destinationURL:(NSURL *) destinationURL {
    NSLog(@"%s", __func__);
}
// 根据需求自己去写需要监控的数据项
-
给 NSURLConnection 添加 Category,专门设置 hook 代理对象、hook NSURLConnection 对象方法
// NSURLConnection+Monitor.m
@implementation NSURLConnection (Monitor)

+ (void)load
{
    static dispatch_once_t onceToken;
    dispatch_once(&onceToken, ^{
        @autoreleasepool {
            [[self class] apm_swizzleMethod:@selector(apm_initWithRequest:delegate:) swizzledSelector:@selector(initWithRequest: delegate:)];
        }
    });
}

- (_Nonnull instancetype)apm_initWithRequest:(NSURLRequest *)request delegate:(nullable id)delegate
{
    /*
     1. 在设置 Delegate 的时候替换 delegate。
     2. 因为要在每个代理方法里面,监控数据,所以需要将代理方法都 hook 下
     3. 在原代理方法执行的时候,让新的代理对象里面,去执行方法的转发,
     */
    NSString *traceId = @"traceId";
    NSMutableURLRequest *rq = [request mutableCopy];
    NSString *preTraceId = [request.allHTTPHeaderFields valueForKey:@"head_key_traceid"];
    if (preTraceId) {
        // 调用 hook 之前的初始化方法,返回 NSURLConnection
        return [self apm_initWithRequest:rq delegate:delegate];
    } else {
        [rq setValue:traceId forHTTPHeaderField:@"head_key_traceid"];

        NSURLSessionAndConnectionImplementor *mockDelegate = [NSURLSessionAndConnectionImplementor new];
        [self registerDelegateMethod:@"connection:didFailWithError:" originalDelegate:delegate newDelegate:mockDelegate flag:"v@:@@"];

        [self registerDelegateMethod:@"connection:didReceiveResponse:" originalDelegate:delegate newDelegate:mockDelegate flag:"v@:@@"];
        [self registerDelegateMethod:@"connection:didReceiveData:" originalDelegate:delegate newDelegate:mockDelegate flag:"v@:@@"];
        [self registerDelegateMethod:@"connection:didFailWithError:" originalDelegate:delegate newDelegate:mockDelegate flag:"v@:@@"];

        [self registerDelegateMethod:@"connectionDidFinishLoading:" originalDelegate:delegate newDelegate:mockDelegate flag:"v@:@"];
        [self registerDelegateMethod:@"connection:willSendRequest:redirectResponse:" originalDelegate:delegate newDelegate:mockDelegate flag:"@@:@@"];
        delegate = [NetworkDelegateProxy setProxyForObject:delegate withNewDelegate:mockDelegate];

        // 调用 hook 之前的初始化方法,返回 NSURLConnection
        return [self apm_initWithRequest:rq delegate:delegate];
    }
}

- (void)registerDelegateMethod:(NSString *)methodName originalDelegate:(id<NSURLConnectionDelegate>)originalDelegate newDelegate:(NSURLSessionAndConnectionImplementor *)newDelegate flag:(const char *)flag
{
    if ([originalDelegate respondsToSelector:NSSelectorFromString(methodName)]) {
        IMP originalMethodImp = class_getMethodImplementation([originalDelegate class], NSSelectorFromString(methodName));
        IMP newMethodImp = class_getMethodImplementation([newDelegate class], NSSelectorFromString(methodName));
        if (originalMethodImp != newMethodImp) {
            [newDelegate registerSelector: methodName];
            NSLog(@"");
        }
    } else {
        class_addMethod([originalDelegate class], NSSelectorFromString(methodName), class_getMethodImplementation([newDelegate class], NSSelectorFromString(methodName)), flag);
    }
}

@end
这样下来就是可以监控到网络信息了,然后将数据交给数据上报 SDK,按照下发的数据上报策略去上报数据。
2.3.2 方法二
其实,针对上述的需求还有另一种方法一样可以达到目的,那就是 isa swizzling。
顺道说一句,上面针对 NSURLConnection、NSURLSession、NSInputStream 代理对象的 hook 之后,利用 NSProxy 实现代理对象方法的转发,有另一种方法可以实现,那就是 isa swizzling。
![]()
method swizzling 改进版如下
Method originalMethod = class_getInstanceMethod(aClass, aSEL);
IMP originalIMP = method_getImplementation(originalMethod);
char *cd = method_getTypeEncoding(originalMethod);
IMP newIMP = imp_implementationWithBlock(^(id self) {
  void (*tmp)(id self, SEL _cmd) = originalIMP;
  tmp(self, aSEL);
});
class_replaceMethod(aClass, aSEL, newIMP, cd);
![]()
我们来分析一下为什么修改 isa 可以实现目的呢?
- 写 APM 监控的人没办法确定业务代码
- 不可能为了方便监控 APM,写某些类,让业务线开发者别使用系统 NSURLSession、NSURLConnection 类
想想 KVO 的实现原理?结合上面的图
- 创建监控对象子类
- 重写子类中属性的 getter、seeter
- 将监控对象的 isa 指针指向新创建的子类
- 在子类的 getter、setter 中拦截值的变化,通知监控对象值的变化
- 监控完之后将监控对象的 isa 还原回去
按照这个思路,我们也可以对 NSURLConnection、NSURLSession 的 load 方法中动态创建子类,在子类中重写方法,比如 - (**nullable** **instancetype**)initWithRequest:(NSURLRequest *)request delegate:(**nullable** **id**)delegate startImmediately:(**BOOL**)startImmediately; ,然后将 NSURLSession、NSURLConnection 的 isa 指向动态创建的子类。在这些方法处理完之后还原本身的 isa 指针。
不过 isa swizzling 针对的还是 method swizzling,代理对象不确定,还是需要 NSProxy 进行动态处理。
至于如何修改 isa,我写一个简单的 Demo 来模拟 KVO
- (void)lbpKVO_addObserver:(NSObject *)observer forKeyPath:(NSString *)keyPath options:(NSKeyValueObservingOptions)options context:(nullable void *)context {
    //生成自定义的名称
    NSString *className = NSStringFromClass(self.class);
    NSString *currentClassName = [@"LBPKVONotifying_" stringByAppendingString:className];
    //1. runtime 生成类
    Class myclass = objc_allocateClassPair(self.class, [currentClassName UTF8String], 0);
    // 生成后不能马上使用,必须先注册
    objc_registerClassPair(myclass);

    //2. 重写 setter 方法
    class_addMethod(myclass,@selector(say) , (IMP)say, "v@:@");

//    class_addMethod(myclass,@selector(setName:) , (IMP)setName, "v@:@");
    //3. 修改 isa
    object_setClass(self, myclass);

    //4. 将观察者保存到当前对象里面
    objc_setAssociatedObject(self, "observer", observer, OBJC_ASSOCIATION_ASSIGN);

    //5. 将传递的上下文绑定到当前对象里面
    objc_setAssociatedObject(self, "context", (__bridge id _Nullable)(context), OBJC_ASSOCIATION_RETAIN);
}


void say(id self, SEL _cmd)
{
   // 调用父类方法一
    struct objc_super superclass = {self, [self superclass]};
    ((void(*)(struct objc_super *,SEL))objc_msgSendSuper)(&superclass,@selector(say));
    NSLog(@"%s", __func__);
// 调用父类方法二
//    Class class = [self class];
//    object_setClass(self, class_getSuperclass(class));
//    objc_msgSend(self, @selector(say));
}

void setName (id self, SEL _cmd, NSString *name) {
    NSLog(@"come here");
    //先切换到当前类的父类,然后发送消息 setName,然后切换当前子类
    //1. 切换到父类
    Class class = [self class];
    object_setClass(self, class_getSuperclass(class));
    //2. 调用父类的 setName 方法
    objc_msgSend(self, @selector(setName:), name);

    //3. 调用观察
    id observer = objc_getAssociatedObject(self, "observer");
    id context = objc_getAssociatedObject(self, "context");
    if (observer) {
        objc_msgSend(observer, @selector(observeValueForKeyPath:ofObject:change:context:), @"name", self, @{@"new": name, @"kind": @1 } , context);
    }
    //4. 改回子类
    object_setClass(self, class);
}

@end
2.4 方案四:监控 App 常见网络请求
本着成本的原因,由于现在大多数的项目的网络能力都是通过 AFNetworking 完成的,所以本文的网络监控可以快速完成。
AFNetworking 在发起网络的时候会有相应的通知。AFNetworkingTaskDidResumeNotification 和 AFNetworkingTaskDidCompleteNotification。通过监听通知携带的参数获取网络情况信息。
 self.didResumeObserver = [[NSNotificationCenter defaultCenter] addObserverForName:AFNetworkingTaskDidResumeNotification object:nil queue:self.queue usingBlock:^(NSNotification * _Nonnull note) {
    // 开始
    __strong __typeof(weakSelf)strongSelf = weakSelf;
    NSURLSessionTask *task = note.object;
    NSString *requestId = [[NSUUID UUID] UUIDString];
    task.apm_requestId = requestId;
    [strongSelf.networkRecoder recordStartRequestWithRequestID:requestId task:task];
}];

self.didCompleteObserver = [[NSNotificationCenter defaultCenter] addObserverForName:AFNetworkingTaskDidCompleteNotification object:nil queue:self.queue usingBlock:^(NSNotification * _Nonnull note) {

    __strong __typeof(weakSelf)strongSelf = weakSelf;

    NSError *error = note.userInfo[AFNetworkingTaskDidCompleteErrorKey];
    NSURLSessionTask *task = note.object;
    if (!error) {
        // 成功
        [strongSelf.networkRecoder recordFinishRequestWithRequestID:task.cmn_requestId task:task];
    } else {
        // 失败
        [strongSelf.networkRecoder recordResponseErrorWithRequestID:task.cmn_requestId task:task error:error];
    }
}];
在 networkRecoder 的方法里面去组装数据,交给数据上报组件,等到合适的时机策略去上报。
因为网络是一个异步的过程,所以当网络请求开始的时候需要为每个网络设置唯一标识,等到网络请求完成后再根据每个请求的标识,判断该网络耗时多久、是否成功等。所以措施是为 NSURLSessionTask 添加分类,通过 runtime 增加一个属性,也就是唯一标识。
这里插一嘴,为 Category 命名、以及内部的属性和方法命名的时候需要注意下。假如不注意会怎么样呢?假如你要为 NSString 类增加身份证号码中间位数隐藏的功能,那么写代码久了的老司机 A,为 NSString 增加了一个方法名,叫做 getMaskedIdCardNumber,但是他的需求是从 [9, 12] 这4位字符串隐藏掉。过了几天同事 B 也遇到了类似的需求,他也是一位老司机,为 NSString 增加了一个也叫 getMaskedIdCardNumber 的方法,但是他的需求是从 [8, 11] 这4位字符串隐藏,但是他引入工程后发现输出并不符合预期,为该方法写的单测没通过,他以为自己写错了截取方法,检查了几遍才发现工程引入了另一个 NSString 分类,里面的方法同名 😂 真坑。
下面的例子是 SDK,但是日常开发也是一样。
- Category 类名:建议按照当前 SDK 名称的简写作为前缀,再加下划线,再加当前分类的功能,也就是
类名+SDK名称简写_功能名称。比如当前 SDK 叫 JuhuaSuanAPM,那么该 NSURLSessionTask Category 名称就叫做 NSURLSessionTask+JuHuaSuanAPM_NetworkMonitor.h
- Category 属性名:建议按照当前 SDK 名称的简写作为前缀,再加下划线,再加属性名,也就是
SDK名称简写_属性名称。比如 JuhuaSuanAPM_requestId`
- Category 方法名:建议按照当前 SDK 名称的简写作为前缀,再加下划线,再加方法名,也就是
SDK名称简写_方法名称。比如 -(BOOL)JuhuaSuanAPM__isGzippedData
例子如下:
#import <Foundation/Foundation.h>

@interface NSURLSessionTask (JuhuaSuanAPM_NetworkMonitor)

@property (nonatomic, copy) NSString* JuhuaSuanAPM_requestId;

@end

#import "NSURLSessionTask+JuHuaSuanAPM_NetworkMonitor.h"
#import <objc/runtime.h>

@implementation NSURLSessionTask (JuHuaSuanAPM_NetworkMonitor)

- (NSString*)JuhuaSuanAPM_requestId
{
    return objc_getAssociatedObject(self, _cmd);
}

- (void)setJuhuaSuanAPM_requestId:(NSString*)requestId
{
    objc_setAssociatedObject(self, @selector(JuhuaSuanAPM_requestId), requestId, OBJC_ASSOCIATION_COPY_NONATOMIC);
}
@end
2.5 iOS 流量监控
2.5.1 HTTP 请求、响应数据结构
HTTP 请求报文结构
![]()
响应报文的结构
![]()
- HTTP 报文是格式化的数据块,每条报文由三部分组成:对报文进行描述的起始行、包含属性的首部块、以及可选的包含数据的主体部分。
- 起始行和手部就是由行分隔符的 ASCII 文本,每行都以一个由2个字符组成的行终止序列作为结束(包括一个回车符、一个换行符)
- 实体的主体或者报文的主体是一个可选的数据块。与起始行和首部不同的是,主体中可以包含文本或者二进制数据,也可以为空。
- HTTP 首部(也就是 Headers)总是应该以一个空行结束,即使没有实体部分。浏览器发送了一个空白行来通知服务器,它已经结束了该头信息的发送。
请求报文的格式
<method> <request-URI> <version>
<headers>

<entity-body>
响应报文的格式
<version> <status> <reason-phrase>
<headers>

<entity-body>
下图是打开 Chrome 查看极课时间网页的请求信息。包括响应行、响应头、响应体等信息。
![]()
下图是在终端使用 curl 查看一个完整的请求和响应数据
![]()
我们都知道在 HTTP 通信中,响应数据会使用 gzip 或其他压缩方式压缩,用 NSURLProtocol 等方案监听,用 NSData 类型去计算分析流量等会造成数据的不精确,因为正常一个 HTTP 响应体的内容是使用 gzip 或其他压缩方式压缩的,所以使用 NSData 会偏大。
2.5.2 问题
-
Request 和 Response 不一定成对存在
比如网络断开、App 突然 Crash 等,所以 Request 和 Response 监控后不应该记录在一条记录里
-
请求流量计算方式不精确
主要原因有:
- 监控技术方案忽略了请求头和请求行部分的数据大小
- 监控技术方案忽略了 Cookie 部分的数据大小
- 监控技术方案在对请求体大小计算的时候直接使用
HTTPBody.length,导致不够精确
-
响应流量计算方式不精确
主要原因有:
- 监控技术方案忽略了响应头和响应行部分的数据大小
- 监控技术方案在对 body 部分的字节大小计算,因采用
exceptedContentLength 导致不够准确
- 监控技术方案忽略了响应体使用 gzip 压缩。真正的网络通信过程中,客户端在发起请求的请求头中
Accept-Encoding 字段代表客户端支持的数据压缩方式(表明客户端可以正常使用数据时支持的压缩方法),同样服务端根据客户端想要的压缩方式、服务端当前支持的压缩方式,最后处理数据,在响应头中Content-Encoding 字段表示当前服务器采用了什么压缩方式。
2.5.3 技术实现
第五部分讲了网络拦截的各种原理和技术方案,这里拿 NSURLProtocol 来说实现流量监控(Hook 的方式)。从上述知道了我们需要什么样的,那么就逐步实现吧。
2.5.3.1 Request 部分
-
先利用网络监控方案将 NSURLProtocol 管理 App 的各种网络请求
-
在各个方法内部记录各项所需参数(NSURLProtocol 不能分析请求握手、挥手等数据大小和时间消耗,不过对于正常情况的接口流量分析足够了,最底层需要 Socket 层)
@property(nonatomic, strong) NSURLConnection *internalConnection;
@property(nonatomic, strong) NSURLResponse *internalResponse;
@property(nonatomic, strong) NSMutableData *responseData;
@property (nonatomic, strong) NSURLRequest *internalRequest;
- (void)startLoading
{
    NSMutableURLRequest *mutableRequest = [[self request] mutableCopy];
    self.internalConnection = [[NSURLConnection alloc] initWithRequest:mutableRequest delegate:self];
    self.internalRequest = self.request;
}

- (void)connection:(NSURLConnection *)connection didReceiveResponse:(NSURLResponse *)response
{
    [self.client URLProtocol:self didReceiveResponse:response cacheStoragePolicy:NSURLCacheStorageNotAllowed];
    self.internalResponse = response;
}

- (void)connection:(NSURLConnection *)connection didReceiveData:(NSData *)data
{
    [self.responseData appendData:data];
    [self.client URLProtocol:self didLoadData:data];
}
-
Status Line 部分
NSURLResponse 没有 Status Line 等属性或者接口,HTTP Version 信息也没有,所以要想获取 Status Line 想办法转换到 CFNetwork 层试试看。发现有私有 API 可以实现。
思路:将 NSURLResponse 通过 _CFURLResponse 转换为 CFTypeRef,然后再将 CFTypeRef 转换为 CFHTTPMessageRef,再通过 CFHTTPMessageCopyResponseStatusLine 获取 CFHTTPMessageRef 的 Status Line 信息。
将读取 Status Line 的功能添加一个 NSURLResponse 的分类。
// NSURLResponse+cm_FetchStatusLineFromCFNetwork.h
#import <Foundation/Foundation.h>

NS_ASSUME_NONNULL_BEGIN

@interface NSURLResponse (cm_FetchStatusLineFromCFNetwork)

- (NSString *)cm_fetchStatusLineFromCFNetwork;

@end

NS_ASSUME_NONNULL_END

// NSURLResponse+cm_FetchStatusLineFromCFNetwork.m
#import "NSURLResponse+cm_FetchStatusLineFromCFNetwork.h"
#import <dlfcn.h>


#define SuppressPerformSelectorLeakWarning(Stuff) \
do { \
    _Pragma("clang diagnostic push") \
    _Pragma("clang diagnostic ignored \"-Warc-performSelector-leaks\"") \
    Stuff; \
    _Pragma("clang diagnostic pop") \
} while (0)

typedef CFHTTPMessageRef (*CMURLResponseFetchHTTPResponse)(CFURLRef response);

@implementation NSURLResponse (cm_FetchStatusLineFromCFNetwork)

- (NSString *)cm_fetchStatusLineFromCFNetwork
{
    NSString *statusLine = @"";
    NSString *funcName = @"CFURLResponseGetHTTPResponse";
    CMURLResponseFetchHTTPResponse originalURLResponseFetchHTTPResponse = dlsym(RTLD_DEFAULT, [funcName UTF8String]);

    SEL getSelector = NSSelectorFromString(@"_CFURLResponse");
    if ([self respondsToSelector:getSelector] && NULL != originalURLResponseFetchHTTPResponse) {
        CFTypeRef cfResponse;
        SuppressPerformSelectorLeakWarning(
            cfResponse = CFBridgingRetain([self performSelector:getSelector]);
        );
        if (NULL != cfResponse) {
            CFHTTPMessageRef messageRef = originalURLResponseFetchHTTPResponse(cfResponse);
            statusLine = (__bridge_transfer NSString *)CFHTTPMessageCopyResponseStatusLine(messageRef);
            CFRelease(cfResponse);
        }
    }
    return statusLine;
}

@end
-
将获取到的 Status Line 转换为 NSData,再计算大小
- (NSUInteger)cm_getLineLength {
    NSString *statusLineString = @"";
    if ([self isKindOfClass:[NSHTTPURLResponse class]]) {
        NSHTTPURLResponse *httpResponse = (NSHTTPURLResponse *)self;
        statusLineString = [self cm_fetchStatusLineFromCFNetwork];
    }
    NSData *lineData = [statusLineString dataUsingEncoding:NSUTF8StringEncoding];
    return lineData.length;
}
-
Header 部分
allHeaderFields 获取到 NSDictionary,然后按照 key: value 拼接成字符串,然后转换成 NSData 计算大小
注意:key: value key 后是有空格的,curl 或者 chrome Network 面板可以查看印证下。
- (NSUInteger)cm_getHeadersLength
{
    NSUInteger headersLength = 0;
    if ([self isKindOfClass:[NSHTTPURLResponse class]]) {
        NSHTTPURLResponse *httpResponse = (NSHTTPURLResponse *)self;
        NSDictionary *headerFields = httpResponse.allHeaderFields;
        NSString *headerString = @"";
        for (NSString *key in headerFields.allKeys) {
            headerString = [headerStr stringByAppendingString:key];
            headheaderStringerStr = [headerString stringByAppendingString:@": "];
            if ([headerFields objectForKey:key]) {
                headerString = [headerString stringByAppendingString:headerFields[key]];
            }
            headerString = [headerString stringByAppendingString:@"\n"];
        }
        NSData *headerData = [headerString dataUsingEncoding:NSUTF8StringEncoding];
        headersLength = headerData.length;
    }
    return headersLength;
}
-
Body 部分
Body 大小的计算不能直接使用 excepectedContentLength,官方文档说明了其不准确性,只可以作为参考。或者 allHeaderFields 中的 Content-Length 值也是不够准确的。
/*!
@abstract Returns the expected content length of the receiver.
@discussion Some protocol implementations report a content length
as part of delivering load metadata, but not all protocols
guarantee the amount of data that will be delivered in actuality.
Hence, this method returns an expected amount. Clients should use
this value as an advisory, and should be prepared to deal with
either more or less data.
@result The expected content length of the receiver, or -1 if
there is no expectation that can be arrived at regarding expected
content length.
*/
@property (readonly) long long expectedContentLength;
- HTTP 1.1 版本规定,如果存在
Transfer-Encoding: chunked,则在 header 中不能有 Content-Length,有也会被忽视。
- 在 HTTP 1.0及之前版本中,
content-length 字段可有可无
- 在 HTTP 1.1及之后版本。如果是
keep alive,则 Content-Length 和 chunked 必然是二选一。若是非keep alive,则和 HTTP 1.0一样。Content-Length 可有可无。
什么是 Transfer-Encoding: chunked
数据以一系列分块的形式进行发送 Content-Length 首部在这种情况下不被发送. 在每一个分块的开头需要添加当前分块的长度, 以十六进制的形式表示,后面紧跟着 \r\n , 之后是分块本身, 后面也是 \r\n ,终止块是一个常规的分块, 不同之处在于其长度为0.
我们之前拿 NSMutableData 记录了数据,所以我们可以在 stopLoading 方法中计算出 Body 大小。步骤如下:
-
在 didReceiveData 中不断添加 data
- (void)connection:(NSURLConnection *)connection didReceiveData:(NSData *)data
{
    [self.responseData appendData:data];
    [self.client URLProtocol:self didLoadData:data];
}
-
在 stopLoading 方法中拿到 allHeaderFields 字典,获取 Content-Encoding key 的值,如果是 gzip,则在 stopLoading 中将 NSData 处理为 gzip 压缩后的数据,再计算大小。(gzip 相关功能可以使用这个工具)
需要额外计算一个空白行的长度
- (void)stopLoadi
{
    [self.internalConnection cancel];

    PCTNetworkTrafficModel *model = [[PCTNetworkTrafficModel alloc] init];
    model.path = self.request.URL.path;
    model.host = self.request.URL.host;
    model.type = DMNetworkTrafficDataTypeResponse;
    model.lineLength = [self.internalResponse cm_getStatusLineLength];
    model.headerLength = [self.internalResponse cm_getHeadersLength];
    model.emptyLineLength = [self.internalResponse cm_getEmptyLineLength];
    if ([self.dm_response isKindOfClass:[NSHTTPURLResponse class]]) {
        NSHTTPURLResponse *httpResponse = (NSHTTPURLResponse *)self.dm_response;
        NSData *data = self.dm_data;
        if ([[httpResponse.allHeaderFields objectForKey:@"Content-Encoding"] isEqualToString:@"gzip"]) {
            data = [self.dm_data gzippedData];
        }
        model.bodyLength = data.length;
    }
    model.length = model.lineLength + model.headerLength + model.bodyLength + model.emptyLineLength;
    NSDictionary *networkTrafficDictionary = [model convertToDictionary];
    [[PrismClient sharedInstance] sendWithType:CMMonitorNetworkTrafficType meta:networkTrafficDictionary payload:nil];
}
2.5.3.2 Resquest 部分
-
先利用网络监控方案将 NSURLProtocol 管理 App 的各种网络请求
-
在各个方法内部记录各项所需参数(NSURLProtocol 不能分析请求握手、挥手等数据大小和时间消耗,不过对于正常情况的接口流量分析足够了,最底层需要 Socket 层)
@property(nonatomic, strong) NSURLConnection *internalConnection;
@property(nonatomic, strong) NSURLResponse *internalResponse;
@property(nonatomic, strong) NSMutableData *responseData;
@property (nonatomic, strong) NSURLRequest *internalRequest;
- (void)startLoading
{
    NSMutableURLRequest *mutableRequest = [[self request] mutableCopy];
    self.internalConnection = [[NSURLConnection alloc] initWithRequest:mutableRequest delegate:self];
    self.internalRequest = self.request;
}

- (void)connection:(NSURLConnection *)connection didReceiveResponse:(NSURLResponse *)response
{
    [self.client URLProtocol:self didReceiveResponse:response cacheStoragePolicy:NSURLCacheStorageNotAllowed];
    self.internalResponse = response;
}

- (void)connection:(NSURLConnection *)connection didReceiveData:(NSData *)data
{
    [self.responseData appendData:data];
    [self.client URLProtocol:self didLoadData:data];
}
-
Status Line 部分
对于 NSURLRequest 没有像 NSURLResponse 一样的方法找到 StatusLine。所以兜底方案是自己根据 Status Line 的结构,自己手动构造一个。结构为:协议版本号+空格+状态码+空格+状态文本+换行
为 NSURLRequest 添加一个专门获取 Status Line 的分类。
// NSURLResquest+cm_FetchStatusLineFromCFNetwork.m
- (NSUInteger)cm_fetchStatusLineLength
{
  NSString *statusLineString = [NSString stringWithFormat:@"%@ %@ %@\n", self.HTTPMethod, self.URL.path, @"HTTP/1.1"];
  NSData *statusLineData = [statusLineString dataUsingEncoding:NSUTF8StringEncoding];
  return statusLineData.length;
}
-
Header 部分
一个 HTTP 请求会先构建判断是否存在缓存,然后进行 DNS 域名解析以获取请求域名的服务器 IP 地址。如果请求协议是 HTTPS,那么还需要建立 TLS 连接。接下来就是利用 IP 地址和服务器建立 TCP 连接。连接建立之后,浏览器端会构建请求行、请求头等信息,并把和该域名相关的 Cookie 等数据附加到请求头中,然后向服务器发送构建的请求信息。
所以一个网络监控不考虑 cookie 😂,借用王多鱼的一句话「那不完犊子了吗」。
看过一些文章说 NSURLRequest 不能完整获取到请求头信息。其实问题不大, 几个信息获取不完全也没办法。衡量监控方案本身就是看接口在不同版本或者某些情况下数据消耗是否异常,WebView 资源请求是否过大,类似于控制变量法的思想。
所以获取到 NSURLRequest 的 allHeaderFields 后,加上 cookie 信息,计算完整的 Header 大小
// NSURLResquest+cm_FetchHeaderWithCookies.m
- (NSUInteger)cm_fetchHeaderLengthWithCookie
{
    NSDictionary *headerFields = self.allHTTPHeaderFields;
    NSDictionary *cookiesHeader = [self cm_fetchCookies];

    if (cookiesHeader.count) {
        NSMutableDictionary *headerDictionaryWithCookies = [NSMutableDictionary dictionaryWithDictionary:headerFields];
        [headerDictionaryWithCookies addEntriesFromDictionary:cookiesHeader];
        headerFields = [headerDictionaryWithCookies copy];
    }

    NSString *headerString = @"";

    for (NSString *key in headerFields.allKeys) {
        headerString = [headerString stringByAppendingString:key];
        headerString = [headerString stringByAppendingString:@": "];
        if ([headerFields objectForKey:key]) {
            headerString = [headerString stringByAppendingString:headerFields[key]];
        }
        headerString = [headerString stringByAppendingString:@"\n"];
    }
    NSData *headerData = [headerString dataUsingEncoding:NSUTF8StringEncoding];
    headersLength = headerData.length;
    return headerString;
}

- (NSDictionary *)cm_fetchCookies
{
    NSDictionary *cookiesHeaderDictionary;
    NSHTTPCookieStorage *cookieStorage = [NSHTTPCookieStorage sharedHTTPCookieStorage];
    NSArray<NSHTTPCookie *> *cookies = [cookieStorage cookiesForURL:self.URL];
    if (cookies.count) {
        cookiesHeaderDictionary = [NSHTTPCookie requestHeaderFieldsWithCookies:cookies];
    }
    return cookiesHeaderDictionary;
}
-
Body 部分
NSURLConnection 的 HTTPBody 有可能获取不到,问题类似于 WebView 上 ajax 等情况。所以可以通过 HTTPBodyStream 读取 stream 来计算 body 大小.
- (NSUInteger)cm_fetchRequestBody
{
    NSDictionary *headerFields = self.allHTTPHeaderFields;
    NSUInteger bodyLength = [self.HTTPBody length];

    if ([headerFields objectForKey:@"Content-Encoding"]) {
        NSData *bodyData;
        if (self.HTTPBody == nil) {
            uint8_t d[1024] = {0};
            NSInputStream *stream = self.HTTPBodyStream;
            NSMutableData *data = [[NSMutableData alloc] init];
            [stream open];
            while ([stream hasBytesAvailable]) {
                NSInteger len = [stream read:d maxLength:1024];
                if (len > 0 && stream.streamError == nil) {
                    [data appendBytes:(void *)d length:len];
                }
            }
            bodyData = [data copy];
            [stream close];
        } else {
            bodyData = self.HTTPBody;
        }
        bodyLength = [[bodyData gzippedData] length];
    }
    return bodyLength;
}
-
在 - (NSURLRequest *)connection:(NSURLConnection *)connection willSendRequest:(NSURLRequest *)request redirectResponse:(NSURLResponse *)response 方法中将数据上报会在 打造功能强大、灵活可配置的数据上报组件 讲
-(NSURLRequest *)connection:(NSURLConnection *)connection willSendRequest:(NSURLRequest *)request redirectResponse:(NSURLResponse *)response
{
    if (response != nil) {
        self.internalResponse = response;
        [self.client URLProtocol:self wasRedirectedToRequest:request redirectResponse:response];
    }

    PCTNetworkTrafficModel *model = [[PCTNetworkTrafficModel alloc] init];
    model.path = request.URL.path;
    model.host = request.URL.host;
    model.type = DMNetworkTrafficDataTypeRequest;
    model.lineLength = [connection.currentRequest dgm_getLineLength];
    model.headerLength = [connection.currentRequest dgm_getHeadersLengthWithCookie];
    model.bodyLength = [connection.currentRequest dgm_getBodyLength];
    model.emptyLineLength = [self.internalResponse cm_getEmptyLineLength];
    model.length = model.lineLength + model.headerLength + model.bodyLength + model.emptyLineLength;

    NSDictionary *networkTrafficDictionary = [model convertToDictionary];
    [[PrismClient sharedInstance] sendWithType:CMMonitorNetworkTrafficType meta:networkTrafficDictionary payload:nil];
    return request;
}
六、 电量消耗
移动设备上电量一直是比较敏感的问题,如果用户在某款 App 的时候发现耗电量严重、手机发热严重,那么用户很大可能会马上卸载这款 App。所以需要在开发阶段关心耗电量问题。
一般来说遇到耗电量较大,我们立马会想到是不是使用了定位、是不是使用了频繁网络请求、是不是不断循环做某件事情?
开发阶段基本没啥问题,我们可以结合 Instrucments 里的 Energy Log 工具来定位问题。但是线上问题就需要代码去监控耗电量,可以作为 APM 的能力之一。
1. 如何获取电量
在 iOS 中,IOKit 是一个私有框架,用来获取硬件和设备的详细信息,也是硬件和内核服务通信的底层框架。所以我们可以通过 IOKit 来获取硬件信息,从而获取到电量信息。步骤如下:
- 首先在苹果开放源代码 opensource 中找到 IOPowerSources.h、IOPSKeys.h。在 Xcode 的
Package Contents 里面找到 IOKit.framework。 路径为 /Applications/Xcode.app/Contents/Developer/Platforms/iPhoneOS.platform/Developer/SDKs/iPhoneOS.sdk/System/Library/Frameworks/IOKit.framework
- 然后将 IOPowerSources.h、IOPSKeys.h、IOKit.framework 导入项目工程
- 设置 UIDevice 的 batteryMonitoringEnabled 为 true
- 获取到的耗电量精确度为 1%
2. 定位问题
通常我们通过 Instrucments 里的 Energy Log 解决了很多问题后,App 上线了,线上的耗电量解决就需要使用 APM 来解决了。耗电地方可能是二方库、三方库,也可能是某个同事的代码。
思路是:在检测到耗电后,先找到有问题的线程,然后堆栈 dump,还原案发现场。
在上面部分我们知道了线程信息的结构, thread_basic_info 中有个记录 CPU 使用率百分比的字段 cpu_usage。所以我们可以通过遍历当前线程,判断哪个线程的 CPU 使用率较高,从而找出有问题的线程。然后再 dump 堆栈,从而定位到发生耗电量的代码。详细请看 3.2 部分。
- (double)fetchBatteryCostUsage
{
  // returns a blob of power source information in an opaque CFTypeRef
    CFTypeRef blob = IOPSCopyPowerSourcesInfo();
    // returns a CFArray of power source handles, each of type CFTypeRef
    CFArrayRef sources = IOPSCopyPowerSourcesList(blob);
    CFDictionaryRef pSource = NULL;
    const void *psValue;
    // returns the number of values currently in an array
    int numOfSources = CFArrayGetCount(sources);
    // error in CFArrayGetCount
    if (numOfSources == 0) {
        NSLog(@"Error in CFArrayGetCount");
        return -1.0f;
    }

    // calculating the remaining energy
    for (int i=0; i<numOfSources; i++) {
        // returns a CFDictionary with readable information about the specific power source
        pSource = IOPSGetPowerSourceDescription(blob, CFArrayGetValueAtIndex(sources, i));
        if (!pSource) {
            NSLog(@"Error in IOPSGetPowerSourceDescription");
            return -1.0f;
        }
        psValue = (CFStringRef) CFDictionaryGetValue(pSource, CFSTR(kIOPSNameKey));

        int curCapacity = 0;
        int maxCapacity = 0;
        double percentage;

        psValue = CFDictionaryGetValue(pSource, CFSTR(kIOPSCurrentCapacityKey));
        CFNumberGetValue((CFNumberRef)psValue, kCFNumberSInt32Type, &curCapacity);

        psValue = CFDictionaryGetValue(pSource, CFSTR(kIOPSMaxCapacityKey));
        CFNumberGetValue((CFNumberRef)psValue, kCFNumberSInt32Type, &maxCapacity);

        percentage = ((double) curCapacity / (double) maxCapacity * 100.0f);
        NSLog(@"curCapacity : %d / maxCapacity: %d , percentage: %.1f ", curCapacity, maxCapacity, percentage);
        return percentage;
    }
    return -1.0f;
}
3. 开发阶段针对电量消耗我们能做什么
CPU 密集运算是耗电量主要原因。所以我们对 CPU 的使用需要精打细算。尽量避免让 CPU 做无用功。对于大量数据的复杂运算,可以借助服务器的能力、GPU 的能力。如果方案设计必须是在 CPU 上完成数据的运算,则可以利用 GCD 技术,使用 dispatch_block_create_with_qos_class(<#dispatch_block_flags_t flags#>, dispatch_qos_class_t qos_class, <#int relative_priority#>, <#^(void)block#>)() 并指定 队列的 qos 为 QOS_CLASS_UTILITY。将任务提交到这个队列的 block 中,在 QOS_CLASS_UTILITY 模式下,系统针对大量数据的计算,做了电量优化
除了 CPU 大量运算,I/O 操作也是耗电主要原因。业界常见方案都是将「碎片化的数据写入磁盘存储」这个操作延后,先在内存中聚合吗,然后再进行磁盘存储。碎片化数据先聚合,在内存中进行存储的机制,iOS 提供 NSCache 这个对象。
NSCache 是线程安全的,NSCache 会在达到达预设的缓存空间的条件时清理缓存,此时会触发 - (**void**)cache:(NSCache *)cache willEvictObject:(**id**)obj; 方法回调,在该方法内部对数据进行 I/O 操作,达到将聚合的数据 I/O 延后的目的。I/O 次数少了,对电量的消耗也就减少了。
NSCache 的使用可以查看 SDWebImage 这个图片加载框架。在图片读取缓存处理时,没直接读取硬盘文件(I/O),而是使用系统的 NSCache。
- (nullable UIImage *)imageFromMemoryCacheForKey:(nullable NSString *)key {
    return [self.memoryCache objectForKey:key];
}

- (nullable UIImage *)imageFromDiskCacheForKey:(nullable NSString *)key {
    UIImage *diskImage = [self diskImageForKey:key];
    if (diskImage && self.config.shouldCacheImagesInMemory) {
        NSUInteger cost = diskImage.sd_memoryCost;
        [self.memoryCache setObject:diskImage forKey:key cost:cost];
    }

    return diskImage;
}
可以看到主要逻辑是先从磁盘中读取图片,如果配置允许开启内存缓存,则将图片保存到 NSCache 中,使用的时候也是从 NSCache 中读取图片。NSCache 的 totalCostLimit、countLimit 属性,
- (void)setObject:(ObjectType)obj forKey:(KeyType)key cost:(NSUInteger)g; 方法用来设置缓存条件。所以我们写磁盘、内存的文件操作时可以借鉴该策略,以优化耗电量。
七、 Crash 监控
1. 异常相关知识回顾
1.1 Mach 层对异常的处理
Mach 在消息传递基础上实现了一套独特的异常处理方法。Mach 异常处理在设计时考虑到:
- 带有一致的语义的单一异常处理设施:Mach 只提供一个异常处理机制用于处理所有类型的异常(包括用户定义的异常、平台无关的异常以及平台特定的异常)。根据异常类型进行分组,具体的平台可以定义具体的子类型。
- 清晰和简洁:异常处理的接口依赖于 Mach 已有的具有良好定义的消息和端口架构,因此非常优雅(不会影响效率)。这就允许调试器和外部处理程序的拓展-甚至在理论上还支持拓展基于网络的异常处理。
在 Mach 中,异常是通过内核中的基础设施-消息传递机制处理的。一个异常并不比一条消息复杂多少,异常由出错的线程或者任务(通过 msg_send()) 抛出,然后由一个处理程序通过 msg_recv())捕捉。处理程序可以处理异常,也可以清楚异常(将异常标记为已完成并继续),还可以决定终止线程。
Mach 的异常处理模型和其他的异常处理模型不同,其他模型的异常处理程序运行在出错的线程上下文中,而 Mach 的异常处理程序在不同的上下文中运行异常处理程序,出错的线程向预先指定好的异常端口发送消息,然后等待应答。每一个任务都可以注册一个异常处理端口,这个异常处理端口会对该任务中的所有线程生效。此外,每个线程都可以通过 thread_set_exception_ports(<#thread_act_t thread#>, <#exception_mask_t exception_mask#>, <#mach_port_t new_port#>, <#exception_behavior_t behavior#>, <#thread_state_flavor_t new_flavor#>) 注册自己的异常处理端口。通常情况下,任务和线程的异常端口都是 NULL,也就是异常不会被处理,而一旦创建异常端口,这些端口就像系统中的其他端口一样,可以转交给其他任务或者其他主机。(有了端口,就可以使用 UDP 协议,通过网络能力让其他的主机上应用程序处理异常)。
发生异常时,首先尝试将异常抛给线程的异常端口,然后尝试抛给任务的异常端口,最后再抛给主机的异常端口(即主机注册的默认端口)。如果没有一个端口返回 KERN_SUCCESS,那么整个任务将被终止。也就是 Mach 不提供异常处理逻辑,只提供传递异常通知的框架。
异常首先是由处理器陷阱引发的。为了处理陷阱,每一个现代的内核都会安插陷阱处理程序。这些底层函数是由内核的汇编部分安插的。
1.2 BSD 层对异常的处理
BSD 层是用户态主要使用的 XUN 接口,这一层展示了一个符合 POSIX 标准的接口。开发者可以使用 UNIX 系统的一切功能,但不需要了解 Mach 层的细节实现。
Mach 已经通过异常机制提供了底层的陷进处理,而 BSD 则在异常机制之上构建了信号处理机制。硬件产生的信号被 Mach 层捕捉,然后转换为对应的 UNIX 信号,为了维护一个统一的机制,操作系统和用户产生的信号首先被转换为 Mach 异常,然后再转换为信号。
Mach 异常都在 host 层被 ux_exception 转换为相应的 unix 信号,并通过 threadsignal 将信号投递到出错的线程。
![]()
2. Crash 收集方式
iOS 系统自带的 Apples`s Crash Reporter 在设置中记录 Crash 日志,我们先观察下 Crash 日志
Incident Identifier: 7FA6736D-09E8-47A1-95EC-76C4522BDE1A
CrashReporter Key:   4e2d36419259f14413c3229e8b7235bcc74847f3
Hardware Model:      iPhone7,1
Process:         CMMonitorExample [3608]
Path:            /var/containers/Bundle/Application/9518A4F4-59B7-44E9-BDDA-9FBEE8CA18E5/CMMonitorExample.app/CMMonitorExample
Identifier:      com.Wacai.CMMonitorExample
Version:         1.0 (1)
Code Type:       ARM-64
Parent Process:  ? [1]

Date/Time:       2017-01-03 11:43:03.000 +0800
OS Version:      iOS 10.2 (14C92)
Report Version:  104

Exception Type:  EXC_CRASH (SIGABRT)
Exception Codes: 0x00000000 at 0x0000000000000000
Crashed Thread:  0

Application Specific Information:
*** Terminating app due to uncaught exception 'NSInvalidArgumentException', reason: '-[__NSSingleObjectArrayI objectForKey:]: unrecognized selector sent to instance 0x174015060'

Thread 0 Crashed:
0   CoreFoundation                  0x0000000188f291b8 0x188df9000 + 1245624 (<redacted> + 124)
1   libobjc.A.dylib                 0x000000018796055c 0x187958000 + 34140 (objc_exception_throw + 56)
2   CoreFoundation                  0x0000000188f30268 0x188df9000 + 1274472 (<redacted> + 140)
3   CoreFoundation                  0x0000000188f2d270 0x188df9000 + 1262192 (<redacted> + 916)
4   CoreFoundation                  0x0000000188e2680c 0x188df9000 + 186380 (_CF_forwarding_prep_0 + 92)
5   CMMonitorExample                0x000000010004c618 0x100044000 + 34328 (-[MakeCrashHandler throwUncaughtNSException] + 80)
会发现,Crash 日志中 Exception Type 项由2部分组成:Mach 异常 + Unix 信号。
所以 Exception Type: EXC_CRASH (SIGABRT) 表示:Mach 层发生了 EXC_CRASH 异常,在 host 层被转换为 SIGABRT 信号投递到出错的线程。
问题: 捕获 Mach 层异常、注册 Unix 信号处理都可以捕获 Crash,这两种方式如何选择?
答: 优选 Mach 层异常拦截。根据上面 1.2 中的描述我们知道 Mach 层异常处理时机更早些,假如 Mach 层异常处理程序让进程退出,这样 Unix 信号永远不会发生了。
业界关于崩溃日志的收集开源项目很多,著名的有: KSCrash、plcrashreporter,提供一条龙服务的 Bugly、友盟等。我们一般使用开源项目在此基础上开发成符合公司内部需求的 bug 收集工具。一番对比后选择 KSCrash。为什么选择 KSCrash 不在本文重点。
KSCrash 功能齐全,可以捕获如下类型的 Crash
- Mach kernel exceptions
- Fatal signals
- C++ exceptions
- Objective-C exceptions
- Main thread deadlock (experimental)
- Custom crashes (e.g. from scripting languages)
所以分析 iOS 端的 Crash 收集方案也就是分析 KSCrash 的 Crash 监控实现原理。
2.1. Mach 层异常处理
大体思路是:先创建一个异常处理端口,为该端口申请权限,再设置异常端口、新建一个内核线程,在该线程内循环等待异常。但是为了防止自己注册的 Mach 层异常处理抢占了其他 SDK、或者业务线开发者设置的逻辑,我们需要在最开始保存其他的异常处理端口,等逻辑执行完后将异常处理交给其他的端口内的逻辑处理。收集到 Crash 信息后组装数据,写入 json 文件。
流程图如下: ![]()
对于 Mach 异常捕获,可以注册一个异常端口,该端口负责对当前任务的所有线程进行监听。
下面来看看关键代码:
注册 Mach 层异常监听代码
static bool installExceptionHandler()
{
    KSLOG_DEBUG("Installing mach exception handler.");

    bool attributes_created = false;
    pthread_attr_t attr;

    kern_return_t kr;
    int error;
    // 拿到当前进程
    const task_t thisTask = mach_task_self();
    exception_mask_t mask = EXC_MASK_BAD_ACCESS |
    EXC_MASK_BAD_INSTRUCTION |
    EXC_MASK_ARITHMETIC |
    EXC_MASK_SOFTWARE |
    EXC_MASK_BREAKPOINT;

    KSLOG_DEBUG("Backing up original exception ports.");
    // 获取该 Task 上的注册好的异常端口
    kr = task_get_exception_ports(thisTask,
                                  mask,
                                  g_previousExceptionPorts.masks,
                                  &g_previousExceptionPorts.count,
                                  g_previousExceptionPorts.ports,
                                  g_previousExceptionPorts.behaviors,
                                  g_previousExceptionPorts.flavors);
    // 获取失败走 failed 逻辑
    if(kr != KERN_SUCCESS)
    {
        KSLOG_ERROR("task_get_exception_ports: %s", mach_error_string(kr));
        goto failed;
    }
    // KSCrash 的异常为空则走执行逻辑
    if(g_exceptionPort == MACH_PORT_NULL)
    {
        KSLOG_DEBUG("Allocating new port with receive rights.");
        // 申请异常处理端口
        kr = mach_port_allocate(thisTask,
                                MACH_PORT_RIGHT_RECEIVE,
                                &g_exceptionPort);
        if(kr != KERN_SUCCESS)
        {
            KSLOG_ERROR("mach_port_allocate: %s", mach_error_string(kr));
            goto failed;
        }

        KSLOG_DEBUG("Adding send rights to port.");
        // 为异常处理端口申请权限:MACH_MSG_TYPE_MAKE_SEND
        kr = mach_port_insert_right(thisTask,
                                    g_exceptionPort,
                                    g_exceptionPort,
                                    MACH_MSG_TYPE_MAKE_SEND);
        if(kr != KERN_SUCCESS)
        {
            KSLOG_ERROR("mach_port_insert_right: %s", mach_error_string(kr));
            goto failed;
        }
    }

    KSLOG_DEBUG("Installing port as exception handler.");
    // 为该 Task 设置异常处理端口
    kr = task_set_exception_ports(thisTask,
                                  mask,
                                  g_exceptionPort,
                                  EXCEPTION_DEFAULT,
                                  THREAD_STATE_NONE);
    if(kr != KERN_SUCCESS)
    {
        KSLOG_ERROR("task_set_exception_ports: %s", mach_error_string(kr));
        goto failed;
    }

    KSLOG_DEBUG("Creating secondary exception thread (suspended).");
    pthread_attr_init(&attr);
    attributes_created = true;
    pthread_attr_setdetachstate(&attr, PTHREAD_CREATE_DETACHED);
    // 设置监控线程
    error = pthread_create(&g_secondaryPThread,
                           &attr,
                           &handleExceptions,
                           kThreadSecondary);
    if(error != 0)
    {
        KSLOG_ERROR("pthread_create_suspended_np: %s", strerror(error));
        goto failed;
    }
    // 转换为 Mach 内核线程
    g_secondaryMachThread = pthread_mach_thread_np(g_secondaryPThread);
    ksmc_addReservedThread(g_secondaryMachThread);

    KSLOG_DEBUG("Creating primary exception thread.");
    error = pthread_create(&g_primaryPThread,
                           &attr,
                           &handleExceptions,
                           kThreadPrimary);
    if(error != 0)
    {
        KSLOG_ERROR("pthread_create: %s", strerror(error));
        goto failed;
    }
    pthread_attr_destroy(&attr);
    g_primaryMachThread = pthread_mach_thread_np(g_primaryPThread);
    ksmc_addReservedThread(g_primaryMachThread);

    KSLOG_DEBUG("Mach exception handler installed.");
    return true;


failed:
    KSLOG_DEBUG("Failed to install mach exception handler.");
    if(attributes_created)
    {
        pthread_attr_destroy(&attr);
    }
    // 还原之前的异常注册端口,将控制权还原
    uninstallExceptionHandler();
    return false;
}
处理异常的逻辑、组装崩溃信息
/** Our exception handler thread routine.
 * Wait for an exception message, uninstall our exception port, record the
 * exception information, and write a report.
 */
static void* handleExceptions(void* const userData)
{
    MachExceptionMessage exceptionMessage = {{0}};
    MachReplyMessage replyMessage = {{0}};
    char* eventID = g_primaryEventID;

    const char* threadName = (const char*) userData;
    pthread_setname_np(threadName);
    if(threadName == kThreadSecondary)
    {
        KSLOG_DEBUG("This is the secondary thread. Suspending.");
        thread_suspend((thread_t)ksthread_self());
        eventID = g_secondaryEventID;
    }
    // 循环读取注册好的异常端口信息
    for(;;)
    {
        KSLOG_DEBUG("Waiting for mach exception");

        // Wait for a message.
        kern_return_t kr = mach_msg(&exceptionMessage.header,
                                    MACH_RCV_MSG,
                                    0,
                                    sizeof(exceptionMessage),
                                    g_exceptionPort,
                                    MACH_MSG_TIMEOUT_NONE,
                                    MACH_PORT_NULL);
        // 获取到信息后则代表发生了 Mach 层异常,跳出 for 循环,组装数据
        if(kr == KERN_SUCCESS)
        {
            break;
        }

        // Loop and try again on failure.
        KSLOG_ERROR("mach_msg: %s", mach_error_string(kr));
    }

    KSLOG_DEBUG("Trapped mach exception code 0x%x, subcode 0x%x",
                exceptionMessage.code[0], exceptionMessage.code[1]);
    if(g_isEnabled)
    {
        // 挂起所有线程
        ksmc_suspendEnvironment();
        g_isHandlingCrash = true;
        // 通知发生了异常
        kscm_notifyFatalExceptionCaptured(true);

        KSLOG_DEBUG("Exception handler is installed. Continuing exception handling.");


        // Switch to the secondary thread if necessary, or uninstall the handler
        // to avoid a death loop.
        if(ksthread_self() == g_primaryMachThread)
        {
            KSLOG_DEBUG("This is the primary exception thread. Activating secondary thread.");
// TODO: This was put here to avoid a freeze. Does secondary thread ever fire?
            restoreExceptionPorts();
            if(thread_resume(g_secondaryMachThread) != KERN_SUCCESS)
            {
                KSLOG_DEBUG("Could not activate secondary thread. Restoring original exception ports.");
            }
        }
        else
        {
            KSLOG_DEBUG("This is the secondary exception thread. Restoring original exception ports.");
//            restoreExceptionPorts();
        }

        // Fill out crash information
        // 组装异常所需要的方案现场信息
        KSLOG_DEBUG("Fetching machine state.");
        KSMC_NEW_CONTEXT(machineContext);
        KSCrash_MonitorContext* crashContext = &g_monitorContext;
        crashContext->offendingMachineContext = machineContext;
        kssc_initCursor(&g_stackCursor, NULL, NULL);
        if(ksmc_getContextForThread(exceptionMessage.thread.name, machineContext, true))
        {
            kssc_initWithMachineContext(&g_stackCursor, 100, machineContext);
            KSLOG_TRACE("Fault address 0x%x, instruction address 0x%x", kscpu_faultAddress(machineContext), kscpu_instructionAddress(machineContext));
            if(exceptionMessage.exception == EXC_BAD_ACCESS)
            {
                crashContext->faultAddress = kscpu_faultAddress(machineContext);
            }
            else
            {
                crashContext->faultAddress = kscpu_instructionAddress(machineContext);
            }
        }

        KSLOG_DEBUG("Filling out context.");
        crashContext->crashType = KSCrashMonitorTypeMachException;
        crashContext->eventID = eventID;
        crashContext->registersAreValid = true;
        crashContext->mach.type = exceptionMessage.exception;
        crashContext->mach.code = exceptionMessage.code[0];
        crashContext->mach.subcode = exceptionMessage.code[1];
        if(crashContext->mach.code == KERN_PROTECTION_FAILURE && crashContext->isStackOverflow)
        {
            // A stack overflow should return KERN_INVALID_ADDRESS, but
            // when a stack blasts through the guard pages at the top of the stack,
            // it generates KERN_PROTECTION_FAILURE. Correct for this.
            crashContext->mach.code = KERN_INVALID_ADDRESS;
        }
        crashContext->signal.signum = signalForMachException(crashContext->mach.type, crashContext->mach.code);
        crashContext->stackCursor = &g_stackCursor;

        kscm_handleException(crashContext);

        KSLOG_DEBUG("Crash handling complete. Restoring original handlers.");
        g_isHandlingCrash = false;
        ksmc_resumeEnvironment();
    }

    KSLOG_DEBUG("Replying to mach exception message.");
    // Send a reply saying "I didn't handle this exception".
    replyMessage.header = exceptionMessage.header;
    replyMessage.NDR = exceptionMessage.NDR;
    replyMessage.returnCode = KERN_FAILURE;

    mach_msg(&replyMessage.header,
             MACH_SEND_MSG,
             sizeof(replyMessage),
             0,
             MACH_PORT_NULL,
             MACH_MSG_TIMEOUT_NONE,
             MACH_PORT_NULL);

    return NULL;
}
还原异常处理端口,转移控制权
/** Restore the original mach exception ports.
 */
static void restoreExceptionPorts(void)
{
    KSLOG_DEBUG("Restoring original exception ports.");
    if(g_previousExceptionPorts.count == 0)
    {
        KSLOG_DEBUG("Original exception ports were already restored.");
        return;
    }

    const task_t thisTask = mach_task_self();
    kern_return_t kr;

    // Reinstall old exception ports.
    // for 循环去除保存好的在 KSCrash 之前注册好的异常端口,将每个端口注册回去
    for(mach_msg_type_number_t i = 0; i < g_previousExceptionPorts.count; i++)
    {
        KSLOG_TRACE("Restoring port index %d", i);
        kr = task_set_exception_ports(thisTask,
                                      g_previousExceptionPorts.masks[i],
                                      g_previousExceptionPorts.ports[i],
                                      g_previousExceptionPorts.behaviors[i],
                                      g_previousExceptionPorts.flavors[i]);
        if(kr != KERN_SUCCESS)
        {
            KSLOG_ERROR("task_set_exception_ports: %s",
                        mach_error_string(kr));
        }
    }
    KSLOG_DEBUG("Exception ports restored.");
    g_previousExceptionPorts.count = 0;
}
2.2. Signal 异常处理
对于 Mach 异常,操作系统会将其转换为对应的 Unix 信号,所以开发者可以通过注册 signanHandler 的方式来处理。
KSCrash 在这里的处理逻辑如下图: ![]()
看一下关键代码:
设置信号处理函数
static bool installSignalHandler()
{
    KSLOG_DEBUG("Installing signal handler.");

#if KSCRASH_HAS_SIGNAL_STACK
    // 在堆上分配一块内存,
    if(g_signalStack.ss_size == 0)
    {
        KSLOG_DEBUG("Allocating signal stack area.");
        g_signalStack.ss_size = SIGSTKSZ;
        g_signalStack.ss_sp = malloc(g_signalStack.ss_size);
    }
    // 信号处理函数的栈挪到堆中,而不和进程共用一块栈区
    // sigaltstack() 函数,该函数的第 1 个参数 sigstack 是一个 stack_t 结构的指针,该结构存储了一个“可替换信号栈” 的位置及属性信息。第 2 个参数 old_sigstack 也是一个 stack_t 类型指针,它用来返回上一次建立的“可替换信号栈”的信息(如果有的话)
    KSLOG_DEBUG("Setting signal stack area.");
    // sigaltstack 第一个参数为创建的新的可替换信号栈,第二个参数可以设置为NULL,如果不为NULL的话,将会将旧的可替换信号栈的信息保存在里面。函数成功返回0,失败返回-1.
    if(sigaltstack(&g_signalStack, NULL) != 0)
    {
        KSLOG_ERROR("signalstack: %s", strerror(errno));
        goto failed;
    }
#endif

    const int* fatalSignals = kssignal_fatalSignals();
    int fatalSignalsCount = kssignal_numFatalSignals();

    if(g_previousSignalHandlers == NULL)
    {
        KSLOG_DEBUG("Allocating memory to store previous signal handlers.");
        g_previousSignalHandlers = malloc(sizeof(*g_previousSignalHandlers)
                                          * (unsigned)fatalSignalsCount);
    }

    // 设置信号处理函数 sigaction 的第二个参数,类型为 sigaction 结构体
    struct sigaction action = {{0}};
    // sa_flags 成员设立 SA_ONSTACK 标志,该标志告诉内核信号处理函数的栈帧就在“可替换信号栈”上建立。
    action.sa_flags = SA_SIGINFO | SA_ONSTACK;
#if KSCRASH_HOST_APPLE && defined(__LP64__)
    action.sa_flags |= SA_64REGSET;
#endif
    sigemptyset(&action.sa_mask);
    action.sa_sigaction = &handleSignal;

    // 遍历需要处理的信号数组
    for(int i = 0; i < fatalSignalsCount; i++)
    {
        // 将每个信号的处理函数绑定到上面声明的 action 去,另外用 g_previousSignalHandlers 保存当前信号的处理函数
        KSLOG_DEBUG("Assigning handler for signal %d", fatalSignals[i]);
        if(sigaction(fatalSignals[i], &action, &g_previousSignalHandlers[i]) != 0)
        {
            char sigNameBuff[30];
            const char* sigName = kssignal_signalName(fatalSignals[i]);
            if(sigName == NULL)
            {
                snprintf(sigNameBuff, sizeof(sigNameBuff), "%d", fatalSignals[i]);
                sigName = sigNameBuff;
            }
            KSLOG_ERROR("sigaction (%s): %s", sigName, strerror(errno));
            // Try to reverse the damage
            for(i--;i >= 0; i--)
            {
                sigaction(fatalSignals[i], &g_previousSignalHandlers[i], NULL);
            }
            goto failed;
        }
    }
    KSLOG_DEBUG("Signal handlers installed.");
    return true;

failed:
    KSLOG_DEBUG("Failed to install signal handlers.");
    return false;
}
信号处理时记录线程等上下文信息
static void handleSignal(int sigNum, siginfo_t* signalInfo, void* userContext)
{
    KSLOG_DEBUG("Trapped signal %d", sigNum);
    if(g_isEnabled)
    {
        ksmc_suspendEnvironment();
        kscm_notifyFatalExceptionCaptured(false);

        KSLOG_DEBUG("Filling out context.");
        KSMC_NEW_CONTEXT(machineContext);
        ksmc_getContextForSignal(userContext, machineContext);
        kssc_initWithMachineContext(&g_stackCursor, 100, machineContext);
        // 记录信号处理时的上下文信息
        KSCrash_MonitorContext* crashContext = &g_monitorContext;
        memset(crashContext, 0, sizeof(*crashContext));
        crashContext->crashType = KSCrashMonitorTypeSignal;
        crashContext->eventID = g_eventID;
        crashContext->offendingMachineContext = machineContext;
        crashContext->registersAreValid = true;
        crashContext->faultAddress = (uintptr_t)signalInfo->si_addr;
        crashContext->signal.userContext = userContext;
        crashContext->signal.signum = signalInfo->si_signo;
        crashContext->signal.sigcode = signalInfo->si_code;
        crashContext->stackCursor = &g_stackCursor;

        kscm_handleException(crashContext);
        ksmc_resumeEnvironment();
    }

    KSLOG_DEBUG("Re-raising signal for regular handlers to catch.");
    // This is technically not allowed, but it works in OSX and iOS.
    raise(sigNum);
}
KSCrash 信号处理后还原之前的信号处理权限
static void uninstallSignalHandler(void)
{
    KSLOG_DEBUG("Uninstalling signal handlers.");

    const int* fatalSignals = kssignal_fatalSignals();
    int fatalSignalsCount = kssignal_numFatalSignals();
    // 遍历需要处理信号数组,将之前的信号处理函数还原
    for(int i = 0; i < fatalSignalsCount; i++)
    {
        KSLOG_DEBUG("Restoring original handler for signal %d", fatalSignals[i]);
        sigaction(fatalSignals[i], &g_previousSignalHandlers[i], NULL);
    }

    KSLOG_DEBUG("Signal handlers uninstalled.");
}
说明:
-
先从堆上分配一块内存区域,被称为“可替换信号栈”,目的是将信号处理函数的栈干掉,用堆上的内存区域代替,而不和进程共用一块栈区。
为什么这么做?一个进程可能有 n 个线程,每个线程都有自己的任务,假如某个线程执行出错,这样就会导致整个进程的崩溃。所以为了信号处理函数正常运行,需要为信号处理函数设置单独的运行空间。另一种情况是递归函数将系统默认的栈空间用尽了,但是信号处理函数使用的栈是它实现在堆中分配的空间,而不是系统默认的栈,所以它仍旧可以正常工作。
-
int sigaltstack(const stack_t * __restrict, stack_t * __restrict) 函数的二个参数都是 stack_t 结构的指针,存储了可替换信号栈的信息(栈的起始地址、栈的长度、状态)。第1个参数该结构存储了一个“可替换信号栈” 的位置及属性信息。第 2 个参数用来返回上一次建立的“可替换信号栈”的信息(如果有的话)。
_STRUCT_SIGALTSTACK
{
	void            *ss_sp;         /* signal stack base */
	__darwin_size_t ss_size;        /* signal stack length */
	int             ss_flags;       /* SA_DISABLE and/or SA_ONSTACK */
};
typedef _STRUCT_SIGALTSTACK     stack_t; /* [???] signal stack */
新创建的可替换信号栈,ss_flags 必须设置为 0。系统定义了 SIGSTKSZ 常量,可满足绝大多可替换信号栈的需求。
/*
 * Structure used in sigaltstack call.
 */

#define SS_ONSTACK      0x0001  /* take signal on signal stack */
#define SS_DISABLE      0x0004  /* disable taking signals on alternate stack */
#define MINSIGSTKSZ     32768   /* (32K)minimum allowable stack */
#define SIGSTKSZ        131072  /* (128K)recommended stack size */
sigaltstack 系统调用通知内核“可替换信号栈”已经建立。
ss_flags 为 SS_ONSTACK 时,表示进程当前正在“可替换信号栈”中执行,如果此时试图去建立一个新的“可替换信号栈”,那么会遇到 EPERM (禁止该动作) 的错误;为 SS_DISABLE 说明当前没有已建立的“可替换信号栈”,禁止建立“可替换信号栈”。
-
int sigaction(int, const struct sigaction * __restrict, struct sigaction * __restrict);
第一个函数表示需要处理的信号值,但不能是 SIGKILL 和 SIGSTOP ,这两个信号的处理函数不允许用户重写,因为它们给超级用户提供了终止程序的方法( SIGKILL and SIGSTOP cannot be caught, blocked, or ignored);
第二个和第三个参数是一个 sigaction 结构体。如果第二个参数不为空则代表将其指向信号处理函数,第三个参数不为空,则将之前的信号处理函数保存到该指针中。如果第二个参数为空,第三个参数不为空,则可以获取当前的信号处理函数。
/*
 * Signal vector "template" used in sigaction call.
 */
struct  sigaction {
	union __sigaction_u __sigaction_u;  /* signal handler */
	sigset_t sa_mask;               /* signal mask to apply */
	int     sa_flags;               /* see signal options below */
};
sigaction 函数的 sa_flags 参数需要设置 SA_ONSTACK 标志,告诉内核信号处理函数的栈帧就在“可替换信号栈”上建立。
2.3. C++ 异常处理
c++ 异常处理的实现是依靠了标准库的 std::set_terminate(CPPExceptionTerminate) 函数。
iOS 工程中某些功能的实现可能使用了C、C++等。假如抛出 C++ 异常,如果该异常可以被转换为 NSException,则走 OC 异常捕获机制,如果不能转换,则继续走 C++ 异常流程,也就是 default_terminate_handler。这个 C++ 异常的默认 terminate 函数内部调用 abort_message 函数,最后触发了一个 abort 调用,系统产生一个 SIGABRT 信号。
在系统抛出 C++ 异常后,加一层 try...catch... 来判断该异常是否可以转换为 NSException,再重新抛出的C++异常。此时异常的现场堆栈已经消失,所以上层通过捕获 SIGABRT 信号是无法还原发生异常时的场景,即异常堆栈缺失。
为什么?try...catch... 语句内部会调用 __cxa_rethrow() 抛出异常,__cxa_rethrow() 内部又会调用 unwind,unwind 可以简单理解为函数调用的逆调用,主要用来清理函数调用过程中每个函数生成的局部变量,一直到最外层的 catch 语句所在的函数,并把控制移交给 catch 语句,这就是C++异常的堆栈消失原因。
static void setEnabled(bool isEnabled)
{
    if(isEnabled != g_isEnabled)
    {
        g_isEnabled = isEnabled;
        if(isEnabled)
        {
            initialize();

            ksid_generate(g_eventID);
            g_originalTerminateHandler = std::set_terminate(CPPExceptionTerminate);
        }
        else
        {
            std::set_terminate(g_originalTerminateHandler);
        }
        g_captureNextStackTrace = isEnabled;
    }
}

static void initialize()
{
    static bool isInitialized = false;
    if(!isInitialized)
    {
        isInitialized = true;
        kssc_initCursor(&g_stackCursor, NULL, NULL);
    }
}

void kssc_initCursor(KSStackCursor *cursor,
                     void (*resetCursor)(KSStackCursor*),
                     bool (*advanceCursor)(KSStackCursor*))
{
    cursor->symbolicate = kssymbolicator_symbolicate;
    cursor->advanceCursor = advanceCursor != NULL ? advanceCursor : g_advanceCursor;
    cursor->resetCursor = resetCursor != NULL ? resetCursor : kssc_resetCursor;
    cursor->resetCursor(cursor);
}
static void CPPExceptionTerminate(void)
{
    ksmc_suspendEnvironment();
    KSLOG_DEBUG("Trapped c++ exception");
    const char* name = NULL;
    std::type_info* tinfo = __cxxabiv1::__cxa_current_exception_type();
    if(tinfo != NULL)
    {
        name = tinfo->name();
    }

    if(name == NULL || strcmp(name, "NSException") != 0)
    {
        kscm_notifyFatalExceptionCaptured(false);
        KSCrash_MonitorContext* crashContext = &g_monitorContext;
        memset(crashContext, 0, sizeof(*crashContext));

        char descriptionBuff[DESCRIPTION_BUFFER_LENGTH];
        const char* description = descriptionBuff;
        descriptionBuff[0] = 0;

        KSLOG_DEBUG("Discovering what kind of exception was thrown.");
        g_captureNextStackTrace = false;
        try
        {
            throw;
        }
        catch(std::exception& exc)
        {
            strncpy(descriptionBuff, exc.what(), sizeof(descriptionBuff));
        }
#define CATCH_VALUE(TYPE, PRINTFTYPE) \
catch(TYPE value)\
{ \
    snprintf(descriptionBuff, sizeof(descriptionBuff), "%" #PRINTFTYPE, value); \
}
        CATCH_VALUE(char,                 d)
        CATCH_VALUE(short,                d)
        CATCH_VALUE(int,                  d)
        CATCH_VALUE(long,                ld)
        CATCH_VALUE(long long,          lld)
        CATCH_VALUE(unsigned char,        u)
        CATCH_VALUE(unsigned short,       u)
        CATCH_VALUE(unsigned int,         u)
        CATCH_VALUE(unsigned long,       lu)
        CATCH_VALUE(unsigned long long, llu)
        CATCH_VALUE(float,                f)
        CATCH_VALUE(double,               f)
        CATCH_VALUE(long double,         Lf)
        CATCH_VALUE(char*,                s)
        catch(...)
        {
            description = NULL;
        }
        g_captureNextStackTrace = g_isEnabled;

        // TODO: Should this be done here? Maybe better in the exception handler?
        KSMC_NEW_CONTEXT(machineContext);
        ksmc_getContextForThread(ksthread_self(), machineContext, true);

        KSLOG_DEBUG("Filling out context.");
        crashContext->crashType = KSCrashMonitorTypeCPPException;
        crashContext->eventID = g_eventID;
        crashContext->registersAreValid = false;
        crashContext->stackCursor = &g_stackCursor;
        crashContext->CPPException.name = name;
        crashContext->exceptionName = name;
        crashContext->crashReason = description;
        crashContext->offendingMachineContext = machineContext;

        kscm_handleException(crashContext);
    }
    else
    {
        KSLOG_DEBUG("Detected NSException. Letting the current NSException handler deal with it.");
    }
    ksmc_resumeEnvironment();

    KSLOG_DEBUG("Calling original terminate handler.");
    g_originalTerminateHandler();
}
2.4. Objective-C 异常处理
对于 OC 层面的 NSException 异常处理较为容易,可以通过注册 NSUncaughtExceptionHandler 来捕获异常信息,通过 NSException 参数来做 Crash 信息的收集,交给数据上报组件。
static void setEnabled(bool isEnabled)
{
    if(isEnabled != g_isEnabled)
    {
        g_isEnabled = isEnabled;
        if(isEnabled)
        {
            KSLOG_DEBUG(@"Backing up original handler.");
            // 记录之前的 OC 异常处理函数
            g_previousUncaughtExceptionHandler = NSGetUncaughtExceptionHandler();

            KSLOG_DEBUG(@"Setting new handler.");
            // 设置新的 OC 异常处理函数
            NSSetUncaughtExceptionHandler(&handleException);
            KSCrash.sharedInstance.uncaughtExceptionHandler = &handleException;
        }
        else
        {
            KSLOG_DEBUG(@"Restoring original handler.");
            NSSetUncaughtExceptionHandler(g_previousUncaughtExceptionHandler);
        }
    }
}
2.5. 主线程死锁
主线程死锁的检测和 ANR 的检测有些类似
-
创建一个线程,在线程运行方法中用 do...while... 循环处理逻辑,加了 autorelease 避免内存过高
-
有一个 awaitingResponse 属性和 watchdogPulse 方法。watchdogPulse 主要逻辑为设置 awaitingResponse 为 YES,切换到主线程中,设置 awaitingResponse 为 NO,
- (void) watchdogPulse
{
    __block id blockSelf = self;
    self.awaitingResponse = YES;
    dispatch_async(dispatch_get_main_queue(), ^
                   {
                       [blockSelf watchdogAnswer];
                   });
}
-
线程的执行方法里面不断循环,等待设置的 g_watchdogInterval 后判断 awaitingResponse 的属性值是不是初始状态的值,否则判断为死锁
- (void) runMonitor
{
    BOOL cancelled = NO;
    do
    {
        // Only do a watchdog check if the watchdog interval is > 0.
        // If the interval is <= 0, just idle until the user changes it.
        @autoreleasepool {
            NSTimeInterval sleepInterval = g_watchdogInterval;
            BOOL runWatchdogCheck = sleepInterval > 0;
            if(!runWatchdogCheck)
            {
                sleepInterval = kIdleInterval;
            }
            [NSThread sleepForTimeInterval:sleepInterval];
            cancelled = self.monitorThread.isCancelled;
            if(!cancelled && runWatchdogCheck)
            {
                if(self.awaitingResponse)
                {
                    [self handleDeadlock];
                }
                else
                {
                    [self watchdogPulse];
                }
            }
        }
    } while (!cancelled);
}
2.6 Crash 的生成与保存
2.6.1 Crash 日志的生成逻辑
上面的部分讲过了 iOS 应用开发中的各种 crash 监控逻辑,接下来就应该分析下 crash 捕获后如何将 crash 信息记录下来,也就是保存到应用沙盒中。
拿主线程死锁这种 crash 举例子,看看 KSCrash 是如何记录 crash 信息的。
// KSCrashMonitor_Deadlock.m
- (void) handleDeadlock
{
    ksmc_suspendEnvironment();
    kscm_notifyFatalExceptionCaptured(false);

    KSMC_NEW_CONTEXT(machineContext);
    ksmc_getContextForThread(g_mainQueueThread, machineContext, false);
    KSStackCursor stackCursor;
    kssc_initWithMachineContext(&stackCursor, 100, machineContext);
    char eventID[37];
    ksid_generate(eventID);

    KSLOG_DEBUG(@"Filling out context.");
    KSCrash_MonitorContext* crashContext = &g_monitorContext;
    memset(crashContext, 0, sizeof(*crashContext));
    crashContext->crashType = KSCrashMonitorTypeMainThreadDeadlock;
    crashContext->eventID = eventID;
    crashContext->registersAreValid = false;
    crashContext->offendingMachineContext = machineContext;
    crashContext->stackCursor = &stackCursor;

    kscm_handleException(crashContext);
    ksmc_resumeEnvironment();

    KSLOG_DEBUG(@"Calling abort()");
    abort();
}
其他几个 crash 也是一样,异常信息经过包装交给 kscm_handleException() 函数处理。可以看到这个函数被其他几种 crash 捕获后所调用。 ![]()
/** Start general exception processing.
 *
 * @oaram context Contextual information about the exception.
 */
void kscm_handleException(struct KSCrash_MonitorContext* context)
{
    context->requiresAsyncSafety = g_requiresAsyncSafety;
    if(g_crashedDuringExceptionHandling)
    {
        context->crashedDuringCrashHandling = true;
    }
    for(int i = 0; i < g_monitorsCount; i++)
    {
        Monitor* monitor = &g_monitors[i];
        // 判断当前的 crash 监控是开启状态
        if(isMonitorEnabled(monitor))
        {
            // 针对每种 crash 类型做一些额外的补充信息
            addContextualInfoToEvent(monitor, context);
        }
    }
    // 真正处理 crash 信息,保存 json 格式的 crash 信息
    g_onExceptionEvent(context);


    if(g_handlingFatalException && !g_crashedDuringExceptionHandling)
    {
        KSLOG_DEBUG("Exception is fatal. Restoring original handlers.");
        kscm_setActiveMonitors(KSCrashMonitorTypeNone);
    }
}
g_onExceptionEvent 是一个 block,声明为 static void (*g_onExceptionEvent)(struct KSCrash_MonitorContext* monitorContext); 在 KSCrashMonitor.c 中被赋值
void kscm_setEventCallback(void (*onEvent)(struct KSCrash_MonitorContext* monitorContext))
{
    g_onExceptionEvent = onEvent;
}
kscm_setEventCallback() 函数在 KSCrashC.c 文件中被调用
KSCrashMonitorType kscrash_install(const char* appName, const char* const installPath)
{
    KSLOG_DEBUG("Installing crash reporter.");

    if(g_installed)
    {
        KSLOG_DEBUG("Crash reporter already installed.");
        return g_monitoring;
    }
    g_installed = 1;

    char path[KSFU_MAX_PATH_LENGTH];
    snprintf(path, sizeof(path), "%s/Reports", installPath);
    ksfu_makePath(path);
    kscrs_initialize(appName, path);

    snprintf(path, sizeof(path), "%s/Data", installPath);
    ksfu_makePath(path);
    snprintf(path, sizeof(path), "%s/Data/CrashState.json", installPath);
    kscrashstate_initialize(path);

    snprintf(g_consoleLogPath, sizeof(g_consoleLogPath), "%s/Data/ConsoleLog.txt", installPath);
    if(g_shouldPrintPreviousLog)
    {
        printPreviousLog(g_consoleLogPath);
    }
    kslog_setLogFilename(g_consoleLogPath, true);

    ksccd_init(60);
    // 设置 crash 发生时的 callback 函数
    kscm_setEventCallback(onCrash);
    KSCrashMonitorType monitors = kscrash_setMonitoring(g_monitoring);

    KSLOG_DEBUG("Installation complete.");
    return monitors;
}

/** Called when a crash occurs.
 *
 * This function gets passed as a callback to a crash handler.
 */
static void onCrash(struct KSCrash_MonitorContext* monitorContext)
{
    KSLOG_DEBUG("Updating application state to note crash.");
    kscrashstate_notifyAppCrash();
    monitorContext->consoleLogPath = g_shouldAddConsoleLogToReport ? g_consoleLogPath : NULL;

    // 正在处理 crash 的时候,发生了再次 crash
    if(monitorContext->crashedDuringCrashHandling)
    {
        kscrashreport_writeRecrashReport(monitorContext, g_lastCrashReportFilePath);
    }
    else
    {
        // 1. 先根据当前时间创建新的 crash 的文件路径
        char crashReportFilePath[KSFU_MAX_PATH_LENGTH];
        kscrs_getNextCrashReportPath(crashReportFilePath);
        // 2. 将新生成的文件路径保存到 g_lastCrashReportFilePath
        strncpy(g_lastCrashReportFilePath, crashReportFilePath, sizeof(g_lastCrashReportFilePath));
        // 3. 将新生成的文件路径传入函数进行 crash 写入
        kscrashreport_writeStandardReport(monitorContext, crashReportFilePath);
    }
}
接下来的函数就是具体的日志写入文件的实现。2个函数做的事情相似,都是格式化为 json 形式并写入文件。区别在于 crash 写入时如果再次发生 crash, 则走简易版的写入逻辑 kscrashreport_writeRecrashReport(),否则走标准的写入逻辑 kscrashreport_writeStandardReport()。
bool ksfu_openBufferedWriter(KSBufferedWriter* writer, const char* const path, char* writeBuffer, int writeBufferLength)
{
    writer->buffer = writeBuffer;
    writer->bufferLength = writeBufferLength;
    writer->position = 0;
    /*
     open() 的第二个参数描述的是文件操作的权限
     #define O_RDONLY        0x0000         open for reading only
     #define O_WRONLY        0x0001         open for writing only
     #define O_RDWR          0x0002         open for reading and writing
     #define O_ACCMODE       0x0003         mask for above mode

     #define O_CREAT         0x0200         create if nonexistant
     #define O_TRUNC         0x0400         truncate to zero length
     #define O_EXCL          0x0800         error if already exists

     0755:即用户具有读/写/执行权限,组用户和其它用户具有读写权限;
     0644:即用户具有读写权限,组用户和其它用户具有只读权限;
     成功则返回文件描述符,若出现则返回 -1
     */
    writer->fd = open(path, O_RDWR | O_CREAT | O_EXCL, 0644);
    if(writer->fd < 0)
    {
        KSLOG_ERROR("Could not open crash report file %s: %s", path, strerror(errno));
        return false;
    }
    return true;
}
/**
 * Write a standard crash report to a file.
 *
 *  @param monitorContext Contextual information about the crash and environment.
 *                      The caller must fill this out before passing it in.
 *
 *  @param path The file to write to.
 */
void kscrashreport_writeStandardReport(const struct KSCrash_MonitorContext* const monitorContext,
                                       const char* path)
{
		KSLOG_INFO("Writing crash report to %s", path);
    char writeBuffer[1024];
    KSBufferedWriter bufferedWriter;

    if(!ksfu_openBufferedWriter(&bufferedWriter, path, writeBuffer, sizeof(writeBuffer)))
    {
        return;
    }

    ksccd_freeze();

    KSJSONEncodeContext jsonContext;
    jsonContext.userData = &bufferedWriter;
    KSCrashReportWriter concreteWriter;
    KSCrashReportWriter* writer = &concreteWriter;
    prepareReportWriter(writer, &jsonContext);

    ksjson_beginEncode(getJsonContext(writer), true, addJSONData, &bufferedWriter);

    writer->beginObject(writer, KSCrashField_Report);
    {
        writeReportInfo(writer,
                        KSCrashField_Report,
                        KSCrashReportType_Standard,
                        monitorContext->eventID,
                        monitorContext->System.processName);
        ksfu_flushBufferedWriter(&bufferedWriter);

        writeBinaryImages(writer, KSCrashField_BinaryImages);
        ksfu_flushBufferedWriter(&bufferedWriter);

        writeProcessState(writer, KSCrashField_ProcessState, monitorContext);
        ksfu_flushBufferedWriter(&bufferedWriter);

        writeSystemInfo(writer, KSCrashField_System, monitorContext);
        ksfu_flushBufferedWriter(&bufferedWriter);

        writer->beginObject(writer, KSCrashField_Crash);
        {
            writeError(writer, KSCrashField_Error, monitorContext);
            ksfu_flushBufferedWriter(&bufferedWriter);
            writeAllThreads(writer,
                            KSCrashField_Threads,
                            monitorContext,
                            g_introspectionRules.enabled);
            ksfu_flushBufferedWriter(&bufferedWriter);
        }
        writer->endContainer(writer);

        if(g_userInfoJSON != NULL)
        {
            addJSONElement(writer, KSCrashField_User, g_userInfoJSON, false);
            ksfu_flushBufferedWriter(&bufferedWriter);
        }
        else
        {
            writer->beginObject(writer, KSCrashField_User);
        }
        if(g_userSectionWriteCallback != NULL)
        {
            ksfu_flushBufferedWriter(&bufferedWriter);
            g_userSectionWriteCallback(writer);
        }
        writer->endContainer(writer);
        ksfu_flushBufferedWriter(&bufferedWriter);

        writeDebugInfo(writer, KSCrashField_Debug, monitorContext);
    }
    writer->endContainer(writer);

    ksjson_endEncode(getJsonContext(writer));
    ksfu_closeBufferedWriter(&bufferedWriter);
    ksccd_unfreeze();
}

/** Write a minimal crash report to a file.
 *
 * @param monitorContext Contextual information about the crash and environment.
 *                       The caller must fill this out before passing it in.
 *
 * @param path The file to write to.
 */
void kscrashreport_writeRecrashReport(const struct KSCrash_MonitorContext* const monitorContext,
                                      const char* path)
{
  char writeBuffer[1024];
    KSBufferedWriter bufferedWriter;
    static char tempPath[KSFU_MAX_PATH_LENGTH];
    // 将传递过来的上份 crash report 文件名路径(/var/mobile/Containers/Data/Application/******/Library/Caches/KSCrash/Test/Reports/Test-report-******.json)修改为去掉 .json ,加上 .old 成为新的文件路径 /var/mobile/Containers/Data/Application/******/Library/Caches/KSCrash/Test/Reports/Test-report-******.old

    strncpy(tempPath, path, sizeof(tempPath) - 10);
    strncpy(tempPath + strlen(tempPath) - 5, ".old", 5);
    KSLOG_INFO("Writing recrash report to %s", path);

    if(rename(path, tempPath) < 0)
    {
        KSLOG_ERROR("Could not rename %s to %s: %s", path, tempPath, strerror(errno));
    }
    // 根据传入路径来打开内存写入需要的文件
    if(!ksfu_openBufferedWriter(&bufferedWriter, path, writeBuffer, sizeof(writeBuffer)))
    {
        return;
    }

    ksccd_freeze();
    // json 解析的 c 代码
    KSJSONEncodeContext jsonContext;
    jsonContext.userData = &bufferedWriter;
    KSCrashReportWriter concreteWriter;
    KSCrashReportWriter* writer = &concreteWriter;
    prepareReportWriter(writer, &jsonContext);

    ksjson_beginEncode(getJsonContext(writer), true, addJSONData, &bufferedWriter);

    writer->beginObject(writer, KSCrashField_Report);
    {
        writeRecrash(writer, KSCrashField_RecrashReport, tempPath);
        ksfu_flushBufferedWriter(&bufferedWriter);
        if(remove(tempPath) < 0)
        {
            KSLOG_ERROR("Could not remove %s: %s", tempPath, strerror(errno));
        }
        writeReportInfo(writer,
                        KSCrashField_Report,
                        KSCrashReportType_Minimal,
                        monitorContext->eventID,
                        monitorContext->System.processName);
        ksfu_flushBufferedWriter(&bufferedWriter);

        writer->beginObject(writer, KSCrashField_Crash);
        {
            writeError(writer, KSCrashField_Error, monitorContext);
            ksfu_flushBufferedWriter(&bufferedWriter);
            int threadIndex = ksmc_indexOfThread(monitorContext->offendingMachineContext,
                                                 ksmc_getThreadFromContext(monitorContext->offendingMachineContext));
            writeThread(writer,
                        KSCrashField_CrashedThread,
                        monitorContext,
                        monitorContext->offendingMachineContext,
                        threadIndex,
                        false);
            ksfu_flushBufferedWriter(&bufferedWriter);
        }
        writer->endContainer(writer);
    }
    writer->endContainer(writer);

    ksjson_endEncode(getJsonContext(writer));
    ksfu_closeBufferedWriter(&bufferedWriter);
    ksccd_unfreeze();
}
2.6.2 Crash 日志的读取逻辑
当前 App 在 Crash 之后,KSCrash 将数据保存到 App 沙盒目录下,App 下次启动后我们读取存储的 crash 文件,然后处理数据并上传。
App 启动后函数调用:
[KSCrashInstallation sendAllReportsWithCompletion:] -> [KSCrash sendAllReportsWithCompletion:] -> [KSCrash allReports] -> [KSCrash reportWithIntID:] ->[KSCrash loadCrashReportJSONWithID:] -> kscrs_readReport
在 sendAllReportsWithCompletion 里读取沙盒里的Crash 数据。
// 先通过读取文件夹,遍历文件夹内的文件数量来判断 crash 报告的个数
static int getReportCount()
{
    int count = 0;
    DIR* dir = opendir(g_reportsPath);
    if(dir == NULL)
    {
        KSLOG_ERROR("Could not open directory %s", g_reportsPath);
        goto done;
    }
    struct dirent* ent;
    while((ent = readdir(dir)) != NULL)
    {
        if(getReportIDFromFilename(ent->d_name) > 0)
        {
            count++;
        }
    }

done:
    if(dir != NULL)
    {
        closedir(dir);
    }
    return count;
}

// 通过 crash 文件个数、文件夹信息去遍历,一次获取到文件名(文件名的最后一部分就是 reportID),拿到 reportID 再去读取 crash 报告内的文件内容,写入数组
- (NSArray*) allReports
{
    int reportCount = kscrash_getReportCount();
    int64_t reportIDs[reportCount];
    reportCount = kscrash_getReportIDs(reportIDs, reportCount);
    NSMutableArray* reports = [NSMutableArray arrayWithCapacity:(NSUInteger)reportCount];
    for(int i = 0; i < reportCount; i++)
    {
        NSDictionary* report = [self reportWithIntID:reportIDs[i]];
        if(report != nil)
        {
            [reports addObject:report];
        }
    }

    return reports;
}

//  根据 reportID 找到 crash 信息
- (NSDictionary*) reportWithIntID:(int64_t) reportID
{
    NSData* jsonData = [self loadCrashReportJSONWithID:reportID];
    if(jsonData == nil)
    {
        return nil;
    }

    NSError* error = nil;
    NSMutableDictionary* crashReport = [KSJSONCodec decode:jsonData
                                                   options:KSJSONDecodeOptionIgnoreNullInArray |
                                                           KSJSONDecodeOptionIgnoreNullInObject |
                                                           KSJSONDecodeOptionKeepPartialObject
                                                     error:&error];
    if(error != nil)
    {
        KSLOG_ERROR(@"Encountered error loading crash report %" PRIx64 ": %@", reportID, error);
    }
    if(crashReport == nil)
    {
        KSLOG_ERROR(@"Could not load crash report");
        return nil;
    }
    [self doctorReport:crashReport];

    return crashReport;
}

//  reportID 读取 crash 内容并转换为 NSData 类型
- (NSData*) loadCrashReportJSONWithID:(int64_t) reportID
{
    char* report = kscrash_readReport(reportID);
    if(report != NULL)
    {
        return [NSData dataWithBytesNoCopy:report length:strlen(report) freeWhenDone:YES];
    }
    return nil;
}

// reportID 读取 crash 数据到 char 类型
char* kscrash_readReport(int64_t reportID)
{
    if(reportID <= 0)
    {
        KSLOG_ERROR("Report ID was %" PRIx64, reportID);
        return NULL;
    }

    char* rawReport = kscrs_readReport(reportID);
    if(rawReport == NULL)
    {
        KSLOG_ERROR("Failed to load report ID %" PRIx64, reportID);
        return NULL;
    }

    char* fixedReport = kscrf_fixupCrashReport(rawReport);
    if(fixedReport == NULL)
    {
        KSLOG_ERROR("Failed to fixup report ID %" PRIx64, reportID);
    }

    free(rawReport);
    return fixedReport;
}

// 多线程加锁,通过 reportID 执行 c 函数 getCrashReportPathByID,将路径设置到 path 上。然后执行 ksfu_readEntireFile 读取 crash 信息到 result
char* kscrs_readReport(int64_t reportID)
{
    pthread_mutex_lock(&g_mutex);
    char path[KSCRS_MAX_PATH_LENGTH];
    getCrashReportPathByID(reportID, path);
    char* result;
    ksfu_readEntireFile(path, &result, NULL, 2000000);
    pthread_mutex_unlock(&g_mutex);
    return result;
}

int kscrash_getReportIDs(int64_t* reportIDs, int count)
{
    return kscrs_getReportIDs(reportIDs, count);
}

int kscrs_getReportIDs(int64_t* reportIDs, int count)
{
    pthread_mutex_lock(&g_mutex);
    count = getReportIDs(reportIDs, count);
    pthread_mutex_unlock(&g_mutex);
    return count;
}
// 循环读取文件夹内容,根据 ent->d_name 调用 getReportIDFromFilename 函数,来获取 reportID,循环内部填充数组
static int getReportIDs(int64_t* reportIDs, int count)
{
    int index = 0;
    DIR* dir = opendir(g_reportsPath);
    if(dir == NULL)
    {
        KSLOG_ERROR("Could not open directory %s", g_reportsPath);
        goto done;
    }

    struct dirent* ent;
    while((ent = readdir(dir)) != NULL && index < count)
    {
        int64_t reportID = getReportIDFromFilename(ent->d_name);
        if(reportID > 0)
        {
            reportIDs[index++] = reportID;
        }
    }

    qsort(reportIDs, (unsigned)count, sizeof(reportIDs[0]), compareInt64);

done:
    if(dir != NULL)
    {
        closedir(dir);
    }
    return index;
}

// sprintf(参数1, 格式2) 函数将格式2的值返回到参数1上,然后执行 sscanf(参数1, 参数2, 参数3),函数将字符串参数1的内容,按照参数2的格式,写入到参数3上。crash 文件命名为 "App名称-report-reportID.json"
static int64_t getReportIDFromFilename(const char* filename)
{
    char scanFormat[100];
    sprintf(scanFormat, "%s-report-%%" PRIx64 ".json", g_appName);

    int64_t reportID = 0;
    sscanf(filename, scanFormat, &reportID);
    return reportID;
}
![]()
2.7 前端 js 相关的 Crash 的监控
2.7.1 JavascriptCore 异常监控
这部分简单粗暴,直接通过 JSContext 对象的 exceptionHandler 属性来监控,比如下面的代码
jsContext.exceptionHandler = ^(JSContext *context, JSValue *exception) {
    // 处理 jscore 相关的异常信息
};
2.7.2 h5 页面异常监控
当 h5 页面内的 Javascript 运行异常时会 window 对象会触发 ErrorEvent 接口的 error 事件,并执行 window.onerror()。
window.onerror = function (msg, url, lineNumber, columnNumber, error) {
   // 处理异常信息
};
![]()
2.7.3 React Native 异常监控
小实验:下图是写了一个 RN Demo 工程,在 Debug Text 控件上加了事件监听代码,内部人为触发 crash
<Text style={styles.sectionTitle} onPress={()=>{1+qw;}}>Debug</Text>
对比组1:
条件: iOS 项目 debug 模式。在 RN 端增加了异常处理的代码。
模拟器点击 command + d 调出面板,选择 Debug,打开 Chrome 浏览器, Mac 下快捷键 Command + Option + J 打开调试面板,就可以像调试 React 一样调试 RN 代码了。
![]()
查看到 crash stack 后点击可以跳转到 sourceMap 的地方。
Tips:RN 项目打 Release 包
-
在项目根目录下创建文件夹( release_iOS),作为资源的输出文件夹
-
在终端切换到工程目录,然后执行下面的代码
react-native bundle --entry-file index.js --platform ios --dev false --bundle-output release_ios/main.jsbundle --assets-dest release_iOS --sourcemap-output release_ios/index.ios.map;
-
将 release_iOS 文件夹内的 .jsbundle 和 assets 文件夹内容拖入到 iOS 工程中即可
对比组2:
条件:iOS 项目 release 模式。在 RN 端不增加异常处理代码
操作:运行 iOS 工程,点击按钮模拟 crash
现象:iOS 项目奔溃。截图以及日志如下
![]()
2020-06-22 22:26:03.318 [info][tid:main][RCTRootView.m:294] Running application todos ({
    initialProps =     {
    };
    rootTag = 1;
})
2020-06-22 22:26:03.490 [info][tid:com.facebook.react.JavaScript] Running "todos" with {"rootTag":1,"initialProps":{}}
2020-06-22 22:27:38.673 [error][tid:com.facebook.react.JavaScript] ReferenceError: Can't find variable: qw
2020-06-22 22:27:38.675 [fatal][tid:com.facebook.react.ExceptionsManagerQueue] Unhandled JS Exception: ReferenceError: Can't find variable: qw
2020-06-22 22:27:38.691300+0800 todos[16790:314161] *** Terminating app due to uncaught exception 'RCTFatalException: Unhandled JS Exception: ReferenceError: Can't find variable: qw', reason: 'Unhandled JS Exception: ReferenceError: Can't find variable: qw, stack:
onPress@397:1821
<unknown>@203:3896
_performSideEffectsForTransition@210:9689
_performSideEffectsForTransition@(null):(null)
_receiveSignal@210:8425
_receiveSignal@(null):(null)
touchableHandleResponderRelease@210:5671
touchableHandleResponderRelease@(null):(null)
onResponderRelease@203:3006
b@97:1125
S@97:1268
w@97:1322
R@97:1617
M@97:2401
forEach@(null):(null)
U@97:2201
<unknown>@97:13818
Pe@97:90199
Re@97:13478
Ie@97:13664
receiveTouches@97:14448
value@27:3544
<unknown>@27:840
value@27:2798
value@27:812
value@(null):(null)
'
*** First throw call stack:
(
	0   CoreFoundation                      0x00007fff23e3cf0e __exceptionPreprocess + 350
	1   libobjc.A.dylib                     0x00007fff50ba89b2 objc_exception_throw + 48
	2   todos                               0x00000001017b0510 RCTFormatError + 0
	3   todos                               0x000000010182d8ca -[RCTExceptionsManager reportFatal:stack:exceptionId:suppressRedBox:] + 503
	4   todos                               0x000000010182e34e -[RCTExceptionsManager reportException:] + 1658
	5   CoreFoundation                      0x00007fff23e43e8c __invoking___ + 140
	6   CoreFoundation                      0x00007fff23e41071 -[NSInvocation invoke] + 321
	7   CoreFoundation                      0x00007fff23e41344 -[NSInvocation invokeWithTarget:] + 68
	8   todos                               0x00000001017e07fa -[RCTModuleMethod invokeWithBridge:module:arguments:] + 578
	9   todos                               0x00000001017e2a84 _ZN8facebook5reactL11invokeInnerEP9RCTBridgeP13RCTModuleDatajRKN5folly7dynamicE + 246
	10  todos                               0x00000001017e280c ___ZN8facebook5react15RCTNativeModule6invokeEjON5folly7dynamicEi_block_invoke + 78
	11  libdispatch.dylib                   0x00000001025b5f11 _dispatch_call_block_and_release + 12
	12  libdispatch.dylib                   0x00000001025b6e8e _dispatch_client_callout + 8
	13  libdispatch.dylib                   0x00000001025bd6fd _dispatch_lane_serial_drain + 788
	14  libdispatch.dylib                   0x00000001025be28f _dispatch_lane_invoke + 422
	15  libdispatch.dylib                   0x00000001025c9b65 _dispatch_workloop_worker_thread + 719
	16  libsystem_pthread.dylib             0x00007fff51c08a3d _pthread_wqthread + 290
	17  libsystem_pthread.dylib             0x00007fff51c07b77 start_wqthread + 15
)
libc++abi.dylib: terminating with uncaught exception of type NSException
(lldb)
Tips:如何在 RN release 模式下调试(看到 js 侧的 console 信息)
- 在
AppDelegate.m 中引入 #import <React/RCTLog.h>
- 在
- (BOOL)application:(UIApplication *)application didFinishLaunchingWithOptions:(NSDictionary *)launchOptions 中加入 RCTSetLogThreshold(RCTLogLevelTrace);
对比组3:
条件:iOS 项目 release 模式。在 RN 端增加异常处理代码。
global.ErrorUtils.setGlobalHandler((e) => {
  console.log(e);
  let message = { name: e.name,
                message: e.message,
                stack: e.stack
  };
  axios.get('http://192.168.1.100:8888/test.php', {
  	params: { 'message': JSON.stringify(message) }
  }).then(function (response) {
  		console.log(response)
  }).catch(function (error) {
  console.log(error)
  });
}, true)
操作:运行 iOS 工程,点击按钮模拟 crash。
现象:iOS 项目不奔溃。日志信息如下,对比 bundle 包中的 js。
![]()
结论:
在 RN 项目中,如果发生了 crash 则会在 Native 侧有相应体现。如果 RN 侧写了 crash 捕获的代码,则 Native 侧不会奔溃。如果 RN 侧的 crash 没有捕获,则 Native 直接奔溃。
RN 项目写了 crash 监控,监控后将堆栈信息打印出来发现对应的 js 信息是经过 webpack 处理的,crash 分析难度很大。所以我们针对 RN 的 crash 需要在 RN 侧写监控代码,监控后需要上报,此外针对监控后的信息需要写专门的 crash 信息还原给你,也就是 sourceMap 解析。
2.7.3.1 js 逻辑错误
写过 RN 的人都知道在 DEBUG 模式下 js 代码有问题则会产生红屏,在 RELEASE 模式下则会白屏或者闪退,为了体验和质量把控需要做异常监控。
在看 RN 源码时候发现了 ErrorUtils,看代码可以设置处理错误信息。
/**
 * Copyright (c) Facebook, Inc. and its affiliates.
 *
 * This source code is licensed under the MIT license found in the
 * LICENSE file in the root directory of this source tree.
 *
 * @format
 * @flow strict
 * @polyfill
 */

let _inGuard = 0;

type ErrorHandler = (error: mixed, isFatal: boolean) => void;
type Fn<Args, Return> = (...Args) => Return;

/**
 * This is the error handler that is called when we encounter an exception
 * when loading a module. This will report any errors encountered before
 * ExceptionsManager is configured.
 */
let _globalHandler: ErrorHandler = function onError(
  e: mixed,
  isFatal: boolean,
) {
  throw e;
};

/**
 * The particular require runtime that we are using looks for a global
 * `ErrorUtils` object and if it exists, then it requires modules with the
 * error handler specified via ErrorUtils.setGlobalHandler by calling the
 * require function with applyWithGuard. Since the require module is loaded
 * before any of the modules, this ErrorUtils must be defined (and the handler
 * set) globally before requiring anything.
 */
const ErrorUtils = {
  setGlobalHandler(fun: ErrorHandler): void {
    _globalHandler = fun;
  },
  getGlobalHandler(): ErrorHandler {
    return _globalHandler;
  },
  reportError(error: mixed): void {
    _globalHandler && _globalHandler(error, false);
  },
  reportFatalError(error: mixed): void {
    // NOTE: This has an untyped call site in Metro.
    _globalHandler && _globalHandler(error, true);
  },
  applyWithGuard<TArgs: $ReadOnlyArray<mixed>, TOut>(
    fun: Fn<TArgs, TOut>,
    context?: ?mixed,
    args?: ?TArgs,
    // Unused, but some code synced from www sets it to null.
    unused_onError?: null,
    // Some callers pass a name here, which we ignore.
    unused_name?: ?string,
  ): ?TOut {
    try {
      _inGuard++;
      // $FlowFixMe: TODO T48204745 (1) apply(context, null) is fine. (2) array -> rest array should work
      return fun.apply(context, args);
    } catch (e) {
      ErrorUtils.reportError(e);
    } finally {
      _inGuard--;
    }
    return null;
  },
  applyWithGuardIfNeeded<TArgs: $ReadOnlyArray<mixed>, TOut>(
    fun: Fn<TArgs, TOut>,
    context?: ?mixed,
    args?: ?TArgs,
  ): ?TOut {
    if (ErrorUtils.inGuard()) {
      // $FlowFixMe: TODO T48204745 (1) apply(context, null) is fine. (2) array -> rest array should work
      return fun.apply(context, args);
    } else {
      ErrorUtils.applyWithGuard(fun, context, args);
    }
    return null;
  },
  inGuard(): boolean {
    return !!_inGuard;
  },
  guard<TArgs: $ReadOnlyArray<mixed>, TOut>(
    fun: Fn<TArgs, TOut>,
    name?: ?string,
    context?: ?mixed,
  ): ?(...TArgs) => ?TOut {
    // TODO: (moti) T48204753 Make sure this warning is never hit and remove it - types
    // should be sufficient.
    if (typeof fun !== 'function') {
      console.warn('A function must be passed to ErrorUtils.guard, got ', fun);
      return null;
    }
    const guardName = name ?? fun.name ?? '<generated guard>';
    function guarded(...args: TArgs): ?TOut {
      return ErrorUtils.applyWithGuard(
        fun,
        context ?? this,
        args,
        null,
        guardName,
      );
    }

    return guarded;
  },
};

global.ErrorUtils = ErrorUtils;

export type ErrorUtilsT = typeof ErrorUtils;
所以 RN 的异常可以使用 global.ErrorUtils 来设置错误处理。举个例子
global.ErrorUtils.setGlobalHandler(e => {
   // e.name e.message e.stack
}, true);
2.7.3.2 组件问题
其实对于 RN 的 crash 处理还有个需要注意的就是 React Error Boundaries。详细资料
过去,组件内的 JavaScript 错误会导致 React 的内部状态被破坏,并且在下一次渲染时 产生 可能无法追踪的 错误。这些错误基本上是由较早的其他代码(非 React 组件代码)错误引起的,但 React 并没有提供一种在组件中优雅处理这些错误的方式,也无法从错误中恢复。
部分 UI 的 JavaScript 错误不应该导致整个应用崩溃,为了解决这个问题,React 16 引入了一个新的概念 —— 错误边界。
错误边界是一种 React 组件,这种组件可以捕获并打印发生在其子组件树任何位置的 JavaScript 错误,并且,它会渲染出备用 UI,而不是渲染那些崩溃了的子组件树。错误边界在渲染期间、生命周期方法和整个组件树的构造函数中捕获错误。
它能捕获子组件生命周期函数中的异常,包括构造函数(constructor)和 render 函数
而不能捕获以下异常:
- Event handlers(事件处理函数)
- Asynchronous code(异步代码,如setTimeout、promise等)
- Server side rendering(服务端渲染)
- Errors thrown in the error boundary itself (rather than its children)(异常边界组件本身抛出的异常)
所以可以通过异常边界组件捕获组件生命周期内的所有异常然后渲染兜底组件 ,防止 App crash,提高用户体验。也可引导用户反馈问题,方便问题的排查和修复
至此 RN 的 crash 分为2种,分别是 js 逻辑错误、组件 js 错误,都已经被监控处理了。接下来就看看如何从工程化层面解决这些问题
2.7.4 RN Crash 还原
SourceMap 文件对于前端日志的解析至关重要,SourceMap 文件中各个参数和如何计算的步骤都在里面有写,可以查看这篇文章。
有了 SourceMap 文件,借助于 mozilla 的 source-map 项目,可以很好的还原 RN 的 crash 日志。
我写了个 NodeJS 脚本,代码如下
var fs = require('fs');
var sourceMap = require('source-map');
var arguments = process.argv.splice(2);

function parseJSError(aLine, aColumn) {
    fs.readFile('./index.ios.map', 'utf8', function (err, data) {
        const whatever =  sourceMap.SourceMapConsumer.with(data, null, consumer => {
            // 读取 crash 日志的行号、列号
            let parseData = consumer.originalPositionFor({
                line: parseInt(aLine),
                column: parseInt(aColumn)
            });
            // 输出到控制台
            console.log(parseData);
            // 输出到文件中
            fs.writeFileSync('./parsed.txt', JSON.stringify(parseData) + '\n', 'utf8', function(err) {
                if(err) {
                    console.log(err);
                }
            });
        });
    });
}

var line = arguments[0];
var column = arguments[1];
parseJSError(line, column);
接下来做个实验,还是上述的 todos 项目。
-
在 Text 的点击事件上模拟 crash
<Text style={styles.sectionTitle} onPress={()=>{1+qw;}}>Debug</Text>
-
将 RN 项目打 bundle 包、产出 sourceMap 文件。执行命令,
react-native bundle --entry-file index.js --platform android --dev false --bundle-output release_ios/main.jsbundle --assets-dest release_iOS --sourcemap-output release_ios/index.android.map;
因为高频使用,所以给 iterm2 增加 alias 别名设置,修改 .zshrc 文件
alias RNRelease='react-native bundle --entry-file index.js --platform ios --dev false --bundle-output release_ios/main.jsbundle --assets-dest release_iOS --sourcemap-output release_ios/index.ios.map;' # RN 打 Release 包
-
将 js bundle 和图片资源拷贝到 Xcode 工程中
-
点击模拟 crash,将日志下面的行号和列号拷贝,在 Node 项目下,执行下面命令
node index.js 397 1822
-
拿脚本解析好的行号、列号、文件信息去和源代码文件比较,结果很正确。
![]()
2.7.5 SourceMap 解析系统设计
目的:通过平台可以将 RN 项目线上 crash 可以还原到具体的文件、代码行数、代码列数。可以看到具体的代码,可以看到 RN stack trace、提供源文件下载功能。
- 打包系统下管理的服务器:
- 生产环境下打包才生成 source map 文件
- 存储打包前的所有文件(install)
- 开发产品侧 RN 分析界面。点击收集到的 RN crash,在详情页可以看到具体的文件、代码行数、代码列数。可以看到具体的代码,可以看到 RN stack trace、Native stack trace。(具体技术实现上面讲过了)
- 由于 souece map 文件较大,RN 解析过长虽然不久,但是是对计算资源的消耗,所以需要设计高效读取方式
- SourceMap 在 iOS、Android 模式下不一样,所以 SoureceMap 存储需要区分 os。
3. KSCrash 的使用包装
然后再封装自己的 Crash 处理逻辑。比如要做的事情就是:
-
继承自 KSCrashInstallation 这个抽象类,设置初始化工作(抽象类比如 NSURLProtocol 必须继承后使用),实现抽象类中的 sink 方法。
/**
 * Crash system installation which handles backend-specific details.
 *
 * Only one installation can be installed at a time.
 *
 * This is an abstract class.
 */
@interface KSCrashInstallation : NSObject
#import "CMCrashInstallation.h"
#import <KSCrash/KSCrashInstallation+Private.h>
#import "CMCrashReporterSink.h"

@implementation CMCrashInstallation

+ (instancetype)sharedInstance {
    static CMCrashInstallation *sharedInstance = nil;
    static dispatch_once_t onceToken;
    dispatch_once(&onceToken, ^{
        sharedInstance = [[CMCrashInstallation alloc] init];
    });
    return sharedInstance;
}

- (id)init {
    return [super initWithRequiredProperties: nil];
}

- (id<KSCrashReportFilter>)sink {
    CMCrashReporterSink *sink = [[CMCrashReporterSink alloc] init];
    return [sink defaultCrashReportFilterSetAppleFmt];
}

@end
-
sink 方法内部的 CMCrashReporterSink 类,遵循了 KSCrashReportFilter 协议,声明了公有方法 defaultCrashReportFilterSetAppleFmt
// .h
#import <Foundation/Foundation.h>
#import <KSCrash/KSCrashReportFilter.h>

@interface CMCrashReporterSink : NSObject<KSCrashReportFilter>

- (id <KSCrashReportFilter>) defaultCrashReportFilterSetAppleFmt;

@end

// .m
#pragma mark - public Method

- (id <KSCrashReportFilter>) defaultCrashReportFilterSetAppleFmt
{
    return [KSCrashReportFilterPipeline filterWithFilters:
            [CMCrashReportFilterAppleFmt filterWithReportStyle:KSAppleReportStyleSymbolicatedSideBySide],
            self,
            nil];
}
其中 defaultCrashReportFilterSetAppleFmt 方法内部返回了一个 KSCrashReportFilterPipeline 类方法 filterWithFilters 的结果。
CMCrashReportFilterAppleFmt 是一个继承自 KSCrashReportFilterAppleFmt 的类,遵循了 KSCrashReportFilter 协议。协议方法允许开发者处理 Crash 的数据格式。
/** Filter the specified reports.
 *
 * @param reports The reports to process.
 * @param onCompletion Block to call when processing is complete.
 */
- (void) filterReports:(NSArray*) reports
          onCompletion:(KSCrashReportFilterCompletion) onCompletion;
#import <KSCrash/KSCrashReportFilterAppleFmt.h>

@interface CMCrashReportFilterAppleFmt : KSCrashReportFilterAppleFmt<KSCrashReportFilter>

@end

// .m
- (void) filterReports:(NSArray*)reports onCompletion:(KSCrashReportFilterCompletion)onCompletion
  {
    NSMutableArray* filteredReports = [NSMutableArray arrayWithCapacity:[reports count]];
    for(NSDictionary *report in reports){
      if([self majorVersion:report] == kExpectedMajorVersion){
        id monitorInfo = [self generateMonitorInfoFromCrashReport:report];
        if(monitorInfo != nil){
          [filteredReports addObject:monitorInfo];
        }
      }
    }
    kscrash_callCompletion(onCompletion, filteredReports, YES, nil);
}

/**
 @brief 获取Crash JSON中的crash时间、mach name、signal name和apple report
 */
- (NSDictionary *)generateMonitorInfoFromCrashReport:(NSDictionary *)crashReport
{
    NSDictionary *infoReport = [crashReport objectForKey:@"report"];
    // ...
    id appleReport = [self toAppleFormat:crashReport];

    NSMutableDictionary *info = [NSMutableDictionary dictionary];
    [info setValue:crashTime forKey:@"crashTime"];
    [info setValue:appleReport forKey:@"appleReport"];
    [info setValue:userException forKey:@"userException"];
    [info setValue:userInfo forKey:@"custom"];

    return [info copy];
}
/**
 * A pipeline of filters. Reports get passed through each subfilter in order.
 *
 * Input: Depends on what's in the pipeline.
 * Output: Depends on what's in the pipeline.
 */
@interface KSCrashReportFilterPipeline : NSObject <KSCrashReportFilter>
-
APM 能力中为 Crash 模块设置一个启动器。启动器内部设置 KSCrash 的初始化工作,以及触发 Crash 时候监控所需数据的组装。比如:SESSION_ID、App 启动时间、App 名称、崩溃时间、App 版本号、当前页面信息等基础信息。
/** C Function to call during a crash report to give the callee an opportunity to
 * add to the report. NULL = ignore.
 *
 * WARNING: Only call async-safe functions from this function! DO NOT call
 * Objective-C methods!!!
 */
@property(atomic,readwrite,assign) KSReportWriteCallback onCrash;
+ (instancetype)sharedInstance
{
    static CMCrashMonitor *_sharedManager = nil;
    static dispatch_once_t onceToken;
    dispatch_once(&onceToken, ^{
        _sharedManager = [[CMCrashMonitor alloc] init];
    });
    return _sharedManager;
}


#pragma mark - public Method

- (void)startMonitor
{
    CMMLog(@"crash monitor started");

#ifdef DEBUG
    BOOL _trackingCrashOnDebug = [CMMonitorConfig sharedInstance].trackingCrashOnDebug;
    if (_trackingCrashOnDebug) {
        [self installKSCrash];
    }
#else
    [self installKSCrash];
#endif
}

#pragma mark - private method

static void onCrash(const KSCrashReportWriter* writer)
{
    NSString *sessionId = [NSString stringWithFormat:@"\"%@\"", ***]];
    writer->addJSONElement(writer, "SESSION_ID", [sessionId UTF8String], true);

    NSString *appLaunchTime = ***;
    writer->addJSONElement(writer, "USER_APP_START_DATE", [[NSString stringWithFormat:@"\"%@\"", appLaunchTime] UTF8String], true);
    // ...
}

- (void)installKSCrash
{
    [[CMCrashInstallation sharedInstance] install];
    [[CMCrashInstallation sharedInstance] sendAllReportsWithCompletion:nil];
    [CMCrashInstallation sharedInstance].onCrash = onCrash;
    dispatch_after(dispatch_time(DISPATCH_TIME_NOW, (int64_t)(5.f * NSEC_PER_SEC)), dispatch_get_main_queue(), ^{
        _isCanAddCrashCount = NO;
    });
}
在 installKSCrash 方法中调用了 [[CMCrashInstallation sharedInstance] sendAllReportsWithCompletion: nil],内部实现如下
- (void) sendAllReportsWithCompletion:(KSCrashReportFilterCompletion) onCompletion
{
    NSError* error = [self validateProperties];
    if(error != nil)
    {
        if(onCompletion != nil)
        {
            onCompletion(nil, NO, error);
        }
        return;
    }

    id<KSCrashReportFilter> sink = [self sink];
    if(sink == nil)
    {
        onCompletion(nil, NO, [NSError errorWithDomain:[[self class] description]
                                                  code:0
                                           description:@"Sink was nil (subclasses must implement method \"sink\")"]);
        return;
    }

    sink = [KSCrashReportFilterPipeline filterWithFilters:self.prependedFilters, sink, nil];

    KSCrash* handler = [KSCrash sharedInstance];
    handler.sink = sink;
    [handler sendAllReportsWithCompletion:onCompletion];
}
方法内部将 KSCrashInstallation 的 sink 赋值给 KSCrash 对象。 内部还是调用了 KSCrash 的 sendAllReportsWithCompletion 方法,实现如下
- (void) sendAllReportsWithCompletion:(KSCrashReportFilterCompletion) onCompletion
{
    NSArray* reports = [self allReports];

    KSLOG_INFO(@"Sending %d crash reports", [reports count]);

    [self sendReports:reports
         onCompletion:^(NSArray* filteredReports, BOOL completed, NSError* error)
     {
         KSLOG_DEBUG(@"Process finished with completion: %d", completed);
         if(error != nil)
         {
             KSLOG_ERROR(@"Failed to send reports: %@", error);
         }
         if((self.deleteBehaviorAfterSendAll == KSCDeleteOnSucess && completed) ||
            self.deleteBehaviorAfterSendAll == KSCDeleteAlways)
         {
             kscrash_deleteAllReports();
         }
         kscrash_callCompletion(onCompletion, filteredReports, completed, error);
     }];
}
该方法内部调用了对象方法 sendReports: onCompletion:,如下所示
- (void) sendReports:(NSArray*) reports onCompletion:(KSCrashReportFilterCompletion) onCompletion
{
    if([reports count] == 0)
    {
        kscrash_callCompletion(onCompletion, reports, YES, nil);
        return;
    }

    if(self.sink == nil)
    {
        kscrash_callCompletion(onCompletion, reports, NO,
                                 [NSError errorWithDomain:[[self class] description]
                                                     code:0
                                              description:@"No sink set. Crash reports not sent."]);
        return;
    }

    [self.sink filterReports:reports
                onCompletion:^(NSArray* filteredReports, BOOL completed, NSError* error)
     {
         kscrash_callCompletion(onCompletion, filteredReports, completed, error);
     }];
}
方法内部的 [self.sink filterReports: onCompletion: ] 实现其实就是 CMCrashInstallation 中设置的 sink getter 方法,内部返回了 CMCrashReporterSink 对象的 defaultCrashReportFilterSetAppleFmt 方法的返回值。内部实现如下
- (id <KSCrashReportFilter>) defaultCrashReportFilterSetAppleFmt
{
    return [KSCrashReportFilterPipeline filterWithFilters:
            [CMCrashReportFilterAppleFmt filterWithReportStyle:KSAppleReportStyleSymbolicatedSideBySide],
            self,
            nil];
}
可以看到这个函数内部设置了多个 filters,其中一个就是 self,也就是 CMCrashReporterSink 对象,所以上面的 [self.sink filterReports: onCompletion:] ,也就是调用 CMCrashReporterSink 内的数据处理方法。完了之后通过 kscrash_callCompletion(onCompletion, reports, YES, nil); 告诉 KSCrash 本地保存的 Crash 日志已经处理完毕,可以删除了。
- (void)filterReports:(NSArray *)reports onCompletion:(KSCrashReportFilterCompletion)onCompletion
{
    for (NSDictionary *report in reports) {
        // 处理 Crash 数据,将数据交给统一的数据上报组件处理...
    }
    kscrash_callCompletion(onCompletion, reports, YES, nil);
}
至此,概括下 KSCrash 做的事情,提供各种 crash 的监控能力,在 crash 后将进程信息、基本信息、异常信息、线程信息等用 c 高效转换为 json 写入文件,App 下次启动后读取本地的 crash 文件夹中的 crash 日志,让开发者可以自定义 key、value 然后去上报日志到 APM 系统,然后删除本地 crash 文件夹中的日志。
4. 符号化
应用 crash 之后,系统会生成一份崩溃日志,存储在设置中,应用的运行状态、调用堆栈、所处线程等信息会记录在日志中。但是这些日志是地址,并不可读,所以需要进行符号化还原。
4.1 .dSYM 文件<a name="dSYM"></a>
.dSYM (debugging symbol)文件是保存十六进制函数地址映射信息的中转文件,调试信息(symbols)都包含在该文件中。Xcode 工程每次编译运行都会生成新的 .dSYM 文件。默认情况下 debug 模式时不生成 .dSYM ,可以在 Build Settings -> Build Options -> Debug Information Format 后将值 DWARF 修改为 DWARF with dSYM File,这样再次编译运行就可以生成 .dSYM 文件。
所以每次 App 打包的时候都需要保存每个版本的 .dSYM 文件。
.dSYM 文件中包含 DWARF 信息,打开文件的包内容 Test.app.dSYM/Contents/Resources/DWARF/Test 保存的就是 DWARF 文件。
.dSYM 文件是从 Mach-O 文件中抽取调试信息而得到的文件目录,发布的时候为了安全,会把调试信息存储在单独的文件,.dSYM 其实是一个文件目录,结构如下:
![]()
4.2 DWARF 文件
DWARF is a debugging file format used by many compilers and debuggers to support source level debugging. It addresses the requirements of a number of procedural languages, such as C, C++, and Fortran, and is designed to be extensible to other languages. DWARF is architecture independent and applicable to any processor or operating system. It is widely used on Unix, Linux and other operating systems, as well as in stand-alone environments.
DWARF 是一种调试文件格式,它被许多编译器和调试器所广泛使用以支持源代码级别的调试。它满足许多过程语言(C、C++、Fortran)的需求,它被设计为支持拓展到其他语言。DWARF 是架构独立的,适用于其他任何的处理器和操作系统。被广泛使用在 Unix、Linux 和其他的操作系统上,以及独立环境上。
DWARF 全称是 Debugging With Arbitrary Record Formats,是一种使用属性化记录格式的调试文件。
DWARF 是可执行程序与源代码关系的一个紧凑表示。
大多数现代编程语言都是块结构:每个实体(一个类、一个函数)被包含在另一个实体中。一个 c 程序,每个文件可能包含多个数据定义、多个变量、多个函数,所以 DWARF 遵循这个模型,也是块结构。DWARF 里基本的描述项是调试信息项 DIE(Debugging Information Entry)。一个 DIE 有一个标签,表示这个 DIE 描述了什么以及一个填入了细节并进一步描述该项的属性列表(类比 html、xml 结构)。一个 DIE(除了最顶层的)被一个父 DIE 包含,可能存在兄弟 DIE 或者子 DIE,属性可能包含各种值:常量(比如一个函数名),变量(比如一个函数的起始地址),或对另一个DIE的引用(比如一个函数的返回值类型)。
DWARF 文件中的数据如下:
| 数据列 |
信息说明 |
| .debug_loc |
在 DW_AT_location 属性中使用的位置列表 |
| .debug_macinfo |
宏信息 |
| .debug_pubnames |
全局对象和函数的查找表 |
| .debug_pubtypes |
全局类型的查找表 |
| .debug_ranges |
在 DW_AT_ranges 属性中使用的地址范围 |
| .debug_str |
在 .debug_info 中使用的字符串表 |
| .debug_types |
类型描述 |
常用的标记与属性如下:
| 数据列 |
信息说明 |
| DW_TAG_class_type |
表示类名称和类型信息 |
| DW_TAG_structure_type |
表示结构名称和类型信息 |
| DW_TAG_union_type |
表示联合名称和类型信息 |
| DW_TAG_enumeration_type |
表示枚举名称和类型信息 |
| DW_TAG_typedef |
表示 typedef 的名称和类型信息 |
| DW_TAG_array_type |
表示数组名称和类型信息 |
| DW_TAG_subrange_type |
表示数组的大小信息 |
| DW_TAG_inheritance |
表示继承的类名称和类型信息 |
| DW_TAG_member |
表示类的成员 |
| DW_TAG_subprogram |
表示函数的名称信息 |
| DW_TAG_formal_parameter |
表示函数的参数信息 |
| DW_TAG_name |
表示名称字符串 |
| DW_TAG_type |
表示类型信息 |
| DW_TAG_artifical |
在创建时由编译程序设置 |
| DW_TAG_sibling |
表示兄弟位置信息 |
| DW_TAG_data_memver_location |
表示位置信息 |
| DW_TAG_virtuality |
在虚拟时设置 |
简单看一个 DWARF 的例子:将测试工程的 .dSYM 文件夹下的 DWARF 文件用下面命令解析
dwarfdump -F --debug-info Test.app.dSYM/Contents/Resources/DWARF/Test > debug-info.txt
打开如下
Test.app.dSYM/Contents/Resources/DWARF/Test:	file format Mach-O arm64

.debug_info contents:
0x00000000: Compile Unit: length = 0x0000004f version = 0x0004 abbr_offset = 0x0000 addr_size = 0x08 (next unit at 0x00000053)

0x0000000b: DW_TAG_compile_unit
              DW_AT_producer [DW_FORM_strp]	("Apple clang version 11.0.3 (clang-1103.0.32.62)")
              DW_AT_language [DW_FORM_data2]	(DW_LANG_ObjC)
              DW_AT_name [DW_FORM_strp]	("_Builtin_stddef_max_align_t")
              DW_AT_stmt_list [DW_FORM_sec_offset]	(0x00000000)
              DW_AT_comp_dir [DW_FORM_strp]	("/Users/lbp/Desktop/Test")
              DW_AT_APPLE_major_runtime_vers [DW_FORM_data1]	(0x02)
              DW_AT_GNU_dwo_id [DW_FORM_data8]	(0x392b5344d415340c)

0x00000027:   DW_TAG_module
                DW_AT_name [DW_FORM_strp]	("_Builtin_stddef_max_align_t")
                DW_AT_LLVM_config_macros [DW_FORM_strp]	("\"-DDEBUG=1\" \"-DOBJC_OLD_DISPATCH_PROTOTYPES=1\"")
                DW_AT_LLVM_include_path [DW_FORM_strp]	("/Applications/Xcode.app/Contents/Developer/Toolchains/XcodeDefault.xctoolchain/usr/lib/clang/11.0.3/include")
                DW_AT_LLVM_isysroot [DW_FORM_strp]	("/Applications/Xcode.app/Contents/Developer/Platforms/iPhoneOS.platform/Developer/SDKs/iPhoneOS13.5.sdk")

0x00000038:     DW_TAG_typedef
                  DW_AT_type [DW_FORM_ref4]	(0x0000004b "long double")
                  DW_AT_name [DW_FORM_strp]	("max_align_t")
                  DW_AT_decl_file [DW_FORM_data1]	("/Applications/Xcode.app/Contents/Developer/Toolchains/XcodeDefault.xctoolchain/usr/lib/clang/11.0.3/include/__stddef_max_align_t.h")
                  DW_AT_decl_line [DW_FORM_data1]	(16)

0x00000043:     DW_TAG_imported_declaration
                  DW_AT_decl_file [DW_FORM_data1]	("/Applications/Xcode.app/Contents/Developer/Toolchains/XcodeDefault.xctoolchain/usr/lib/clang/11.0.3/include/__stddef_max_align_t.h")
                  DW_AT_decl_line [DW_FORM_data1]	(27)
                  DW_AT_import [DW_FORM_ref_addr]	(0x0000000000000027)

0x0000004a:     NULL

0x0000004b:   DW_TAG_base_type
                DW_AT_name [DW_FORM_strp]	("long double")
                DW_AT_encoding [DW_FORM_data1]	(DW_ATE_float)
                DW_AT_byte_size [DW_FORM_data1]	(0x08)

0x00000052:   NULL
0x00000053: Compile Unit: length = 0x000183dc version = 0x0004 abbr_offset = 0x0000 addr_size = 0x08 (next unit at 0x00018433)

0x0000005e: DW_TAG_compile_unit
              DW_AT_producer [DW_FORM_strp]	("Apple clang version 11.0.3 (clang-1103.0.32.62)")
              DW_AT_language [DW_FORM_data2]	(DW_LANG_ObjC)
              DW_AT_name [DW_FORM_strp]	("Darwin")
              DW_AT_stmt_list [DW_FORM_sec_offset]	(0x000000a7)
              DW_AT_comp_dir [DW_FORM_strp]	("/Users/lbp/Desktop/Test")
              DW_AT_APPLE_major_runtime_vers [DW_FORM_data1]	(0x02)
              DW_AT_GNU_dwo_id [DW_FORM_data8]	(0xa4a1d339379e18a5)

0x0000007a:   DW_TAG_module
                DW_AT_name [DW_FORM_strp]	("Darwin")
                DW_AT_LLVM_config_macros [DW_FORM_strp]	("\"-DDEBUG=1\" \"-DOBJC_OLD_DISPATCH_PROTOTYPES=1\"")
                DW_AT_LLVM_include_path [DW_FORM_strp]	("/Applications/Xcode.app/Contents/Developer/Platforms/iPhoneOS.platform/Developer/SDKs/iPhoneOS13.5.sdk/usr/include")
                DW_AT_LLVM_isysroot [DW_FORM_strp]	("/Applications/Xcode.app/Contents/Developer/Platforms/iPhoneOS.platform/Developer/SDKs/iPhoneOS13.5.sdk")

0x0000008b:     DW_TAG_module
                  DW_AT_name [DW_FORM_strp]	("C")
                  DW_AT_LLVM_config_macros [DW_FORM_strp]	("\"-DDEBUG=1\" \"-DOBJC_OLD_DISPATCH_PROTOTYPES=1\"")
                  DW_AT_LLVM_include_path [DW_FORM_strp]	("/Applications/Xcode.app/Contents/Developer/Platforms/iPhoneOS.platform/Developer/SDKs/iPhoneOS13.5.sdk/usr/include")
                  DW_AT_LLVM_isysroot [DW_FORM_strp]	("/Applications/Xcode.app/Contents/Developer/Platforms/iPhoneOS.platform/Developer/SDKs/iPhoneOS13.5.sdk")

0x0000009c:       DW_TAG_module
                    DW_AT_name [DW_FORM_strp]	("fenv")
                    DW_AT_LLVM_config_macros [DW_FORM_strp]	("\"-DDEBUG=1\" \"-DOBJC_OLD_DISPATCH_PROTOTYPES=1\"")
                    DW_AT_LLVM_include_path [DW_FORM_strp]	("/Applications/Xcode.app/Contents/Developer/Platforms/iPhoneOS.platform/Developer/SDKs/iPhoneOS13.5.sdk/usr/include")
                    DW_AT_LLVM_isysroot [DW_FORM_strp]	("/Applications/Xcode.app/Contents/Developer/Platforms/iPhoneOS.platform/Developer/SDKs/iPhoneOS13.5.sdk")

0x000000ad:         DW_TAG_enumeration_type
                      DW_AT_type [DW_FORM_ref4]	(0x00017276 "unsigned int")
                      DW_AT_byte_size [DW_FORM_data1]	(0x04)
                      DW_AT_decl_file [DW_FORM_data1]	("/Applications/Xcode.app/Contents/Developer/Platforms/iPhoneOS.platform/Developer/SDKs/iPhoneOS13.5.sdk/usr/include/fenv.h")
                      DW_AT_decl_line [DW_FORM_data1]	(154)

0x000000b5:           DW_TAG_enumerator
                        DW_AT_name [DW_FORM_strp]	("__fpcr_trap_invalid")
                        DW_AT_const_value [DW_FORM_udata]	(256)

0x000000bc:           DW_TAG_enumerator
                        DW_AT_name [DW_FORM_strp]	("__fpcr_trap_divbyzero")
                        DW_AT_const_value [DW_FORM_udata]	(512)

0x000000c3:           DW_TAG_enumerator
                        DW_AT_name [DW_FORM_strp]	("__fpcr_trap_overflow")
                        DW_AT_const_value [DW_FORM_udata]	(1024)

0x000000ca:           DW_TAG_enumerator
                        DW_AT_name [DW_FORM_strp]	("__fpcr_trap_underflow")
// ......
0x000466ee:   DW_TAG_subprogram
                DW_AT_name [DW_FORM_strp]	("CFBridgingRetain")
                DW_AT_decl_file [DW_FORM_data1]	("/Applications/Xcode.app/Contents/Developer/Platforms/iPhoneOS.platform/Developer/SDKs/iPhoneOS13.5.sdk/System/Library/Frameworks/Foundation.framework/Headers/NSObject.h")
                DW_AT_decl_line [DW_FORM_data1]	(105)
                DW_AT_prototyped [DW_FORM_flag_present]	(true)
                DW_AT_type [DW_FORM_ref_addr]	(0x0000000000019155 "CFTypeRef")
                DW_AT_inline [DW_FORM_data1]	(DW_INL_inlined)

0x000466fa:     DW_TAG_formal_parameter
                  DW_AT_name [DW_FORM_strp]	("X")
                  DW_AT_decl_file [DW_FORM_data1]	("/Applications/Xcode.app/Contents/Developer/Platforms/iPhoneOS.platform/Developer/SDKs/iPhoneOS13.5.sdk/System/Library/Frameworks/Foundation.framework/Headers/NSObject.h")
                  DW_AT_decl_line [DW_FORM_data1]	(105)
                  DW_AT_type [DW_FORM_ref4]	(0x00046706 "id")

0x00046705:     NULL

0x00046706:   DW_TAG_typedef
                DW_AT_type [DW_FORM_ref4]	(0x00046711 "objc_object*")
                DW_AT_name [DW_FORM_strp]	("id")
                DW_AT_decl_file [DW_FORM_data1]	("/Users/lbp/Desktop/Test/Test/NetworkAPM/NSURLResponse+cm_FetchStatusLineFromCFNetwork.m")
                DW_AT_decl_line [DW_FORM_data1]	(44)

0x00046711:   DW_TAG_pointer_type
                DW_AT_type [DW_FORM_ref4]	(0x00046716 "objc_object")

0x00046716:   DW_TAG_structure_type
                DW_AT_name [DW_FORM_strp]	("objc_object")
                DW_AT_byte_size [DW_FORM_data1]	(0x00)

0x0004671c:     DW_TAG_member
                  DW_AT_name [DW_FORM_strp]	("isa")
                  DW_AT_type [DW_FORM_ref4]	(0x00046727 "objc_class*")
                  DW_AT_data_member_location [DW_FORM_data1]	(0x00)
// ......
这里就不粘贴全部内容了(太长了)。可以看到 DIE 包含了函数开始地址、结束地址、函数名、文件名、所在行数,对于给定的地址,找到函数开始地址、结束地址之间包含该抵制的 DIE,则可以还原函数名和文件名信息。
debug_line 可以还原文件行数等信息
dwarfdump -F --debug-line Test.app.dSYM/Contents/Resources/DWARF/Test > debug-inline.txt
贴部分信息
Test.app.dSYM/Contents/Resources/DWARF/Test:	file format Mach-O arm64

.debug_line contents:
debug_line[0x00000000]
Line table prologue:
    total_length: 0x000000a3
         version: 4
 prologue_length: 0x0000009a
 min_inst_length: 1
max_ops_per_inst: 1
 default_is_stmt: 1
       line_base: -5
      line_range: 14
     opcode_base: 13
standard_opcode_lengths[DW_LNS_copy] = 0
standard_opcode_lengths[DW_LNS_advance_pc] = 1
standard_opcode_lengths[DW_LNS_advance_line] = 1
standard_opcode_lengths[DW_LNS_set_file] = 1
standard_opcode_lengths[DW_LNS_set_column] = 1
standard_opcode_lengths[DW_LNS_negate_stmt] = 0
standard_opcode_lengths[DW_LNS_set_basic_block] = 0
standard_opcode_lengths[DW_LNS_const_add_pc] = 0
standard_opcode_lengths[DW_LNS_fixed_advance_pc] = 1
standard_opcode_lengths[DW_LNS_set_prologue_end] = 0
standard_opcode_lengths[DW_LNS_set_epilogue_begin] = 0
standard_opcode_lengths[DW_LNS_set_isa] = 1
include_directories[  1] = "/Applications/Xcode.app/Contents/Developer/Toolchains/XcodeDefault.xctoolchain/usr/lib/clang/11.0.3/include"
file_names[  1]:
           name: "__stddef_max_align_t.h"
      dir_index: 1
       mod_time: 0x00000000
         length: 0x00000000

Address            Line   Column File   ISA Discriminator Flags
------------------ ------ ------ ------ --- ------------- -------------
0x0000000000000000      1      0      1   0             0  is_stmt end_sequence
debug_line[0x000000a7]
Line table prologue:
    total_length: 0x0000230a
         version: 4
 prologue_length: 0x00002301
 min_inst_length: 1
max_ops_per_inst: 1
 default_is_stmt: 1
       line_base: -5
      line_range: 14
     opcode_base: 13
standard_opcode_lengths[DW_LNS_copy] = 0
standard_opcode_lengths[DW_LNS_advance_pc] = 1
standard_opcode_lengths[DW_LNS_advance_line] = 1
standard_opcode_lengths[DW_LNS_set_file] = 1
standard_opcode_lengths[DW_LNS_set_column] = 1
standard_opcode_lengths[DW_LNS_negate_stmt] = 0
standard_opcode_lengths[DW_LNS_set_basic_block] = 0
standard_opcode_lengths[DW_LNS_const_add_pc] = 0
standard_opcode_lengths[DW_LNS_fixed_advance_pc] = 1
standard_opcode_lengths[DW_LNS_set_prologue_end] = 0
standard_opcode_lengths[DW_LNS_set_epilogue_begin] = 0
standard_opcode_lengths[DW_LNS_set_isa] = 1
include_directories[  1] = "/Applications/Xcode.app/Contents/Developer/Platforms/iPhoneOS.platform/Developer/SDKs/iPhoneOS13.5.sdk/usr/include"
include_directories[  2] = "/Applications/Xcode.app/Contents/Developer/Toolchains/XcodeDefault.xctoolchain/usr/lib/clang/11.0.3/include"
include_directories[  3] = "/Applications/Xcode.app/Contents/Developer/Platforms/iPhoneOS.platform/Developer/SDKs/iPhoneOS13.5.sdk/usr/include/sys"
include_directories[  4] = "/Applications/Xcode.app/Contents/Developer/Platforms/iPhoneOS.platform/Developer/SDKs/iPhoneOS13.5.sdk/usr/include/mach"
include_directories[  5] = "/Applications/Xcode.app/Contents/Developer/Platforms/iPhoneOS.platform/Developer/SDKs/iPhoneOS13.5.sdk/usr/include/libkern"
include_directories[  6] = "/Applications/Xcode.app/Contents/Developer/Platforms/iPhoneOS.platform/Developer/SDKs/iPhoneOS13.5.sdk/usr/include/architecture"
include_directories[  7] = "/Applications/Xcode.app/Contents/Developer/Platforms/iPhoneOS.platform/Developer/SDKs/iPhoneOS13.5.sdk/usr/include/sys/_types"
include_directories[  8] = "/Applications/Xcode.app/Contents/Developer/Platforms/iPhoneOS.platform/Developer/SDKs/iPhoneOS13.5.sdk/usr/include/_types"
include_directories[  9] = "/Applications/Xcode.app/Contents/Developer/Platforms/iPhoneOS.platform/Developer/SDKs/iPhoneOS13.5.sdk/usr/include/arm"
include_directories[ 10] = "/Applications/Xcode.app/Contents/Developer/Platforms/iPhoneOS.platform/Developer/SDKs/iPhoneOS13.5.sdk/usr/include/sys/_pthread"
include_directories[ 11] = "/Applications/Xcode.app/Contents/Developer/Platforms/iPhoneOS.platform/Developer/SDKs/iPhoneOS13.5.sdk/usr/include/mach/arm"
include_directories[ 12] = "/Applications/Xcode.app/Contents/Developer/Platforms/iPhoneOS.platform/Developer/SDKs/iPhoneOS13.5.sdk/usr/include/libkern/arm"
include_directories[ 13] = "/Applications/Xcode.app/Contents/Developer/Platforms/iPhoneOS.platform/Developer/SDKs/iPhoneOS13.5.sdk/usr/include/uuid"
include_directories[ 14] = "/Applications/Xcode.app/Contents/Developer/Platforms/iPhoneOS.platform/Developer/SDKs/iPhoneOS13.5.sdk/usr/include/netinet"
include_directories[ 15] = "/Applications/Xcode.app/Contents/Developer/Platforms/iPhoneOS.platform/Developer/SDKs/iPhoneOS13.5.sdk/usr/include/netinet6"
include_directories[ 16] = "/Applications/Xcode.app/Contents/Developer/Platforms/iPhoneOS.platform/Developer/SDKs/iPhoneOS13.5.sdk/usr/include/net"
include_directories[ 17] = "/Applications/Xcode.app/Contents/Developer/Platforms/iPhoneOS.platform/Developer/SDKs/iPhoneOS13.5.sdk/usr/include/pthread"
include_directories[ 18] = "/Applications/Xcode.app/Contents/Developer/Platforms/iPhoneOS.platform/Developer/SDKs/iPhoneOS13.5.sdk/usr/include/mach_debug"
include_directories[ 19] = "/Applications/Xcode.app/Contents/Developer/Platforms/iPhoneOS.platform/Developer/SDKs/iPhoneOS13.5.sdk/usr/include/os"
include_directories[ 20] = "/Applications/Xcode.app/Contents/Developer/Platforms/iPhoneOS.platform/Developer/SDKs/iPhoneOS13.5.sdk/usr/include/malloc"
include_directories[ 21] = "/Applications/Xcode.app/Contents/Developer/Platforms/iPhoneOS.platform/Developer/SDKs/iPhoneOS13.5.sdk/usr/include/bsm"
include_directories[ 22] = "/Applications/Xcode.app/Contents/Developer/Platforms/iPhoneOS.platform/Developer/SDKs/iPhoneOS13.5.sdk/usr/include/machine"
include_directories[ 23] = "/Applications/Xcode.app/Contents/Developer/Platforms/iPhoneOS.platform/Developer/SDKs/iPhoneOS13.5.sdk/usr/include/mach/machine"
include_directories[ 24] = "/Applications/Xcode.app/Contents/Developer/Platforms/iPhoneOS.platform/Developer/SDKs/iPhoneOS13.5.sdk/usr/include/secure"
include_directories[ 25] = "/Applications/Xcode.app/Contents/Developer/Platforms/iPhoneOS.platform/Developer/SDKs/iPhoneOS13.5.sdk/usr/include/xlocale"
include_directories[ 26] = "/Applications/Xcode.app/Contents/Developer/Platforms/iPhoneOS.platform/Developer/SDKs/iPhoneOS13.5.sdk/usr/include/arpa"
file_names[  1]:
           name: "fenv.h"
      dir_index: 1
       mod_time: 0x00000000
         length: 0x00000000
file_names[  2]:
           name: "stdatomic.h"
      dir_index: 2
       mod_time: 0x00000000
         length: 0x00000000
file_names[  3]:
           name: "wait.h"
      dir_index: 3
       mod_time: 0x00000000
         length: 0x00000000
// ......
Address            Line   Column File   ISA Discriminator Flags
------------------ ------ ------ ------ --- ------------- -------------
0x000000010000b588     14      0      2   0             0  is_stmt
0x000000010000b5b4     16      5      2   0             0  is_stmt prologue_end
0x000000010000b5d0     17     11      2   0             0  is_stmt
0x000000010000b5d4      0      0      2   0             0
0x000000010000b5d8     17      5      2   0             0
0x000000010000b5dc     17     11      2   0             0
0x000000010000b5e8     18      1      2   0             0  is_stmt
0x000000010000b608     20      0      2   0             0  is_stmt
0x000000010000b61c     22      5      2   0             0  is_stmt prologue_end
0x000000010000b628     23      5      2   0             0  is_stmt
0x000000010000b644     24      1      2   0             0  is_stmt
0x000000010000b650     15      0      1   0             0  is_stmt
0x000000010000b65c     15     41      1   0             0  is_stmt prologue_end
0x000000010000b66c     11      0      2   0             0  is_stmt
0x000000010000b680     11     17      2   0             0  is_stmt prologue_end
0x000000010000b6a4     11     17      2   0             0  is_stmt end_sequence
debug_line[0x0000def9]
Line table prologue:
    total_length: 0x0000015a
         version: 4
 prologue_length: 0x000000eb
 min_inst_length: 1
max_ops_per_inst: 1
 default_is_stmt: 1
       line_base: -5
      line_range: 14
     opcode_base: 13
standard_opcode_lengths[DW_LNS_copy] = 0
standard_opcode_lengths[DW_LNS_advance_pc] = 1
standard_opcode_lengths[DW_LNS_advance_line] = 1
standard_opcode_lengths[DW_LNS_set_file] = 1
standard_opcode_lengths[DW_LNS_set_column] = 1
standard_opcode_lengths[DW_LNS_negate_stmt] = 0
standard_opcode_lengths[DW_LNS_set_basic_block] = 0
standard_opcode_lengths[DW_LNS_const_add_pc] = 0
standard_opcode_lengths[DW_LNS_fixed_advance_pc] = 1
standard_opcode_lengths[DW_LNS_set_prologue_end] = 0
standard_opcode_lengths[DW_LNS_set_epilogue_begin] = 0
standard_opcode_lengths[DW_LNS_set_isa] = 1
include_directories[  1] = "Test"
include_directories[  2] = "Test/NetworkAPM"
include_directories[  3] = "/Applications/Xcode.app/Contents/Developer/Platforms/iPhoneOS.platform/Developer/SDKs/iPhoneOS13.5.sdk/usr/include/objc"
file_names[  1]:
           name: "AppDelegate.h"
      dir_index: 1
       mod_time: 0x00000000
         length: 0x00000000
file_names[  2]:
           name: "JMWebResourceURLProtocol.h"
      dir_index: 2
       mod_time: 0x00000000
         length: 0x00000000
file_names[  3]:
           name: "AppDelegate.m"
      dir_index: 1
       mod_time: 0x00000000
         length: 0x00000000
file_names[  4]:
           name: "objc.h"
      dir_index: 3
       mod_time: 0x00000000
         length: 0x00000000
// ......
可以看到 debug_line 里包含了每个代码地址对应的行数。上面贴了 AppDelegate 的部分。
4.3 symbols
在链接中,我们将函数和变量统称为符合(Symbol),函数名或变量名就是符号名(Symbol Name),我们可以将符号看成是链接中的粘合剂,整个链接过程正是基于符号才能正确完成的。
上述文字来自《程序员的自我修养》。所以符号就是函数、变量、类的统称。
按照类型划分,符号可以分为三类:
- 全局符号:目标文件外可见的符号,可以被其他目标文件所引用,或者需要其他目标文件定义
- 局部符号:只在目标文件内可见的符号,指只在目标文件内可见的函数和变量
- 调试符号:包括行号信息的调试符号信息,行号信息记录了函数和变量对应的文件和文件行号。
符号表(Symbol Table):是内存地址与函数名、文件名、行号的映射表。每个定义的符号都有一个对应的值得,叫做符号值(Symbol Value),对于变量和函数来说,符号值就是地址,符号表组成如下
<起始地址> <结束地址> <函数> [<文件名:行号>]
4.4 如何获取地址?
image 加载的时候会进行相对基地址进行重定位,并且每次加载的基地址都不一样,函数栈 frame 的地址是重定位后的绝对地址,我们要的是重定位前的相对地址。
Binary Images
拿测试工程的 crash 日志举例子,打开贴部分 Binary Images 内容
// ...
Binary Images:
0x102fe0000 - 0x102ff3fff Test arm64  <37eaa57df2523d95969e47a9a1d69ce5> /var/containers/Bundle/Application/643F0DFE-A710-4136-A278-A89D780B7208/Test.app/Test
0x1030e0000 - 0x1030ebfff libobjc-trampolines.dylib arm64  <181f3aa866d93165ac54344385ac6e1d> /usr/lib/libobjc-trampolines.dylib
0x103204000 - 0x103267fff dyld arm64  <6f1c86b640a3352a8529bca213946dd5> /usr/lib/dyld
0x189a78000 - 0x189a8efff libsystem_trace.dylib arm64  <b7477df8f6ab3b2b9275ad23c6cc0b75> /usr/lib/system/libsystem_trace.dylib
// ...
可以看到 Crash 日志的 Binary Images 包含每个 Image 的加载开始地址、结束地址、image 名称、arm 架构、uuid、image 路径。
crash 日志中的信息
Last Exception Backtrace:
// ...
5   Test                          	0x102fe592c -[ViewController testMonitorCrash] + 22828 (ViewController.mm:58)
Binary Images:
0x102fe0000 - 0x102ff3fff Test arm64  <37eaa57df2523d95969e47a9a1d69ce5> /var/containers/Bundle/Application/643F0DFE-A710-4136-A278-A89D780B7208/Test.app/Test
所以 frame 5 的相对地址为 0x102fe592c - 0x102fe0000 。再使用 命令可以还原符号信息。
使用 atos 来解析,0x102fe0000 为 image 加载的开始地址,0x102fe592c 为 frame 需要还原的地址。
atos -o Test.app.dSYM/Contents/Resources/DWARF/Test-arch arm64 -l 0x102fe0000 0x102fe592c
4.5 UUID
-
crash 文件的 UUID
grep --after-context=2 "Binary Images:" *.crash
Test  5-28-20, 7-47 PM.crash:Binary Images:
Test  5-28-20, 7-47 PM.crash-0x102fe0000 - 0x102ff3fff Test arm64  <37eaa57df2523d95969e47a9a1d69ce5> /var/containers/Bundle/Application/643F0DFE-A710-4136-A278-A89D780B7208/Test.app/Test
Test  5-28-20, 7-47 PM.crash-0x1030e0000 - 0x1030ebfff libobjc-trampolines.dylib arm64  <181f3aa866d93165ac54344385ac6e1d> /usr/lib/libobjc-trampolines.dylib
--
Test.crash:Binary Images:
Test.crash-0x102fe0000 - 0x102ff3fff Test arm64  <37eaa57df2523d95969e47a9a1d69ce5> /var/containers/Bundle/Application/643F0DFE-A710-4136-A278-A89D780B7208/Test.app/Test
Test.crash-0x1030e0000 - 0x1030ebfff libobjc-trampolines.dylib arm64  <181f3aa866d93165ac54344385ac6e1d> /usr/lib/libobjc-trampolines.dylib
Test App 的 UUID 为 37eaa57df2523d95969e47a9a1d69ce5.
-
.dSYM 文件的 UUID
dwarfdump --uuid Test.app.dSYM
结果为
UUID: 37EAA57D-F252-3D95-969E-47A9A1D69CE5 (arm64) Test.app.dSYM/Contents/Resources/DWARF/Test
-
app 的 UUID
dwarfdump --uuid Test.app/Test
结果为
UUID: 37EAA57D-F252-3D95-969E-47A9A1D69CE5 (arm64) Test.app/Test
4.6 符号化(解析 Crash 日志)
上述篇幅分析了如何捕获各种类型的 crash,App 在用户手中我们通过技术手段可以获取 crash 案发现场信息并结合一定的机制去上报,但是这种堆栈是十六进制的地址,无法定位问题,所以需要做符号化处理。
上面也说明了.dSYM 文件 的作用,通过符号地址结合 dSYM 文件来还原文件名、所在行、函数名,这个过程叫符号化。但是 .dSYM 文件必须和 crash log 文件的 bundle id、version 严格对应。
获取 Crash 日志可以通过 Xcode -> Window -> Devices and Simulators 选择对应设备,找到 Crash 日志文件,根据时间和 App 名称定位。
app 和 .dSYM 文件可以通过打包的产物得到,路径为 ~/Library/Developer/Xcode/Archives。
解析方法一般有2种:
-
使用 symbolicatecrash
symbolicatecrash 是 Xcode 自带的 crash 日志分析工具,先确定所在路径,在终端执行下面的命令
find /Applications/Xcode.app -name symbolicatecrash -type f
会返回几个路径,找到 iPhoneSimulator.platform 所在那一行
/Applications/Xcode.app/Contents/Developer/Platforms/iPhoneSimulator.platform/Developer/Library/PrivateFrameworks/DVTFoundation.framework/symbolicatecrash
将 symbolicatecrash 拷贝到指定文件夹下(保存了 app、dSYM、crash 文件的文件夹)
执行命令
./symbolicatecrash Test.crash Test.dSYM > Test.crash
第一次做这事儿应该会报错 Error: "DEVELOPER_DIR" is not defined at ./symbolicatecrash line 69.,解决方案:在终端执行下面命令
export DEVELOPER_DIR=/Applications/Xcode.app/Contents/Developer
-
使用 atos
区别于 symbolicatecrash,atos 较为灵活,只要 .crash 和 .dSYM 或者 .crash 和 .app 文件对应即可。
用法如下,-l 最后跟得是符号地址
xcrun atos -o Test.app.dSYM/Contents/Resources/DWARF/Test -arch armv7 -l 0x1023c592c
也可以解析 .app 文件(不存在 .dSYM 文件),其中xxx为段地址,xx为偏移地址
atos -arch architecture -o binary -l xxx xx
因为我们的 App 可能有很多,每个 App 在用户手中可能是不同的版本,所以在 APM 拦截之后需要符号化的时候需要将 crash 文件和 .dSYM 文件一一对应,才能正确符号化,对应的原则就是 UUID 一致。
4.7 系统库符号化解析
我们每次真机连接 Xcode 运行程序,会提示等待,其实系统为了堆栈解析,都会把当前版本的系统符号库自动导入到 /Users/你自己的用户名/Library/Developer/Xcode/iOS DeviceSupport 目录下安装了一大堆系统库的符号化文件。你可以访问下面目录看看
/Users/你自己的用户名/Library/Developer/Xcode/iOS DeviceSupport/
![]()
5. 服务端处理
5.1 ELK 日志系统
业界设计日志监控系统一般会采用基于 ELK 技术。ELK 是 Elasticsearch、Logstash、Kibana 三个开源框架缩写。Elasticsearch 是一个分布式、通过 Restful 方式进行交互的近实时搜索的平台框架。Logstash 是一个中央数据流引擎,用于从不同目标(文件/数据存储/MQ)收集不同格式的数据,经过过滤后支持输出到不同目的地(文件/MQ/Redis/ElasticsSearch/Kafka)。Kibana 可以将 Elasticserarch 的数据通过友好的页面展示出来,提供可视化分析功能。所以 ELK 可以搭建一个高效、企业级的日志分析系统。
早期单体应用时代,几乎应用的所有功能都在一台机器上运行,出了问题,运维人员打开终端输入命令直接查看系统日志,进而定位问题、解决问题。随着系统的功能越来越复杂,用户体量越来越大,单体应用几乎很难满足需求,所以技术架构迭代了,通过水平拓展来支持庞大的用户量,将单体应用进行拆分为多个应用,每个应用采用集群方式部署,负载均衡控制调度,假如某个子模块发生问题,去找这台服务器上终端找日志分析吗?显然台落后,所以日志管理平台便应运而生。通过 Logstash 去收集分析每台服务器的日志文件,然后按照定义的正则模版过滤后传输到 Kafka 或 Redis,然后由另一个 Logstash 从 Kafka 或 Redis 上读取日志存储到 ES 中创建索引,最后通过 Kibana 进行可视化分析。此外可以将收集到的数据进行数据分析,做更进一步的维护和决策。
![]()
上图展示了一个 ELK 的日志架构图。简单说明下:
- Logstash 和 ES 之前存在一个 Kafka 层,因为 Logstash 是架设在数据资源服务器上,将收集到的数据进行实时过滤,过滤需要消耗时间和内存,所以存在 Kafka,起到了数据缓冲存储作用,因为 Kafka 具备非常出色的读写性能。
- 再一步就是 Logstash 从 Kafka 里面进行读取数据,将数据过滤、处理,将结果传输到 ES
- 这个设计不但性能好、耦合低,还具备可拓展性。比如可以从 n 个不同的 Logstash 上读取传输到 n 个 Kafka 上,再由 n 个 Logstash 过滤处理。日志来源可以是 m 个,比如 App 日志、Tomcat 日志、Nginx 日志等等
下图贴一个 Elasticsearch 社区分享的一个 “Elastic APM 动手实战”主题的内容截图。
![]()
5.2 服务侧
Crash log 统一入库 Kibana 时是没有符号化的,所以需要符号化处理,以方便定位问题、crash 产生报表和后续处理。
![]()
所以整个流程就是:客户端 APM SDK 收集 crash log -> Kafka 存储 -> Mac 机执行定时任务符号化 -> 数据回传 Kafka -> 产品侧(显示端)对数据进行分类、报表、报警等操作。
因为公司的产品线有多条,相应的 App 有多个,用户使用的 App 版本也各不相同,所以 crash 日志分析必须要有正确的 .dSYM 文件,那么多 App 的不同版本,自动化就变得非常重要了。
自动化有2种手段,规模小一点的公司或者图省事,可以在 Xcode中 添加 runScript 脚本代码来自动在 release 模式下上传dSYM)。
因为我们公司有自己的一套体系,wax-cli,可以同时管理 iOS SDK、iOS App、Android SDK、Android App、Node、React、React Native 工程项目的初始化、依赖管理、构建(持续集成、Unit Test、Lint、统跳检测)、测试、打包、部署、动态能力(热更新、统跳路由下发)等能力于一身。可以基于各![]() 个阶段做能力的插入,所以可以在调用打包后在打包机上传 .dSYM 文件到七牛云存储(规则可以是以 AppName + Version 为 key,value 为 .dSYM 文件)。
个阶段做能力的插入,所以可以在调用打包后在打包机上传 .dSYM 文件到七牛云存储(规则可以是以 AppName + Version 为 key,value 为 .dSYM 文件)。
现在很多架构设计都是微服务,至于为什么选微服务,不在本文范畴。所以 crash 日志的符号化被设计为一个微服务。架构图如下 ![]() 说明:
说明:
-
Symbolication Service 作为整个监控系统 Prism 的一个组成部分,是专注于 crash report 符号化的微服务。
-
接收来自 mass 的包含预处理过的 crash report 和 dsym index 的请求,从七牛拉取对应的 dsym,对 crash report 做符号化解析,计算 hash,并将 hash 响应给 mass。
-
接收来自 Prism 管理系统的包含原始 crash report 和 dsym index 的请求,从七牛拉取对应的 dsym,对crash report 做符号化解析,并将符号化的 crash report 响应给 Prism 管理系统。
-
Mass 是一个通用的数据处理(流式/批式)和任务调度框架
-
candle 是一个打包系统,上面说的 wax-cli 有个能力就是打包,其实就是调用的 candle 系统的打包构建能力。会根据项目的特点,选择合适的打包机(打包平台是维护了多个打包任务,不同任务根据特点被派发到不同的打包机上,任务详情页可以看到依赖的下载、编译、运行过程等,打包好的产物包括二进制包、下载二维码等等)
其中符号化服务是大前端背景下大前端团队的产物,所以是 NodeJS 实现的。iOS 的符号化机器是 双核的 Mac mini,这就需要做实验测评到底需要开启几个 worker 进程做符号化服务。结果是双进程处理 crash log,比单进程效率高近一倍,而四进程比双进程效率提升不明显,符合双核 mac mini 的特点。所以开启两个 worker 进程做符号化处理。
下图是完整设计图
![]()
简单说明下,符号化流程是一个主从模式,一台 master 机,多个 slave 机,master 机读取 .dSYM 和 crash 结果的 cache。mass 调度符号化服务(内部2个 symbolocate worker)同时从七牛云上获取 .dSYM 文件。
系统架构图如下
![]()
八、 APM 小结
-
通常来说各个端的监控能力是不太一致的,技术实现细节也不统一。所以在技术方案评审的时候需要将监控能力对齐统一。每个能力在各个端的数据字段必须对齐(字段个数、名称、数据类型和精度),因为 APM 本身是一个闭环,监控了之后需符号化解析、数据整理,进行产品化开发、最后需要监控大盘展示等
-
一些 crash 或者 ANR 等根据等级需要邮件、短信、企业内容通信工具告知干系人,之后快速发布版本、hot fix 等。
-
监控的各个能力需要做成可配置,灵活开启关闭。
-
监控数据需要做内存到文件的写入处理,需要注意策略。监控数据需要存储数据库,数据库大小、设计规则等。存入数据库后如何上报,上报机制等会在另一篇文章讲:打造一个通用、可配置的数据上报 SDK
-
尽量在技术评审后,将各端的技术实现写进文档中,同步给相关人员。比如 ANR 的实现
/*
android 端

根据设备分级,一般超过 300ms 视为一次卡顿
hook 系统 loop,在消息处理前后插桩,用以计算每条消息的时长
开启另外线程 dump 堆栈,处理结束后关闭
*/
new ExceptionProcessor().init(this, new Runnable() {
            @Override
            public void run() {
                //监测卡顿
                try {
                    ProxyPrinter proxyPrinter = new ProxyPrinter(PerformanceMonitor.this);
                    Looper.getMainLooper().setMessageLogging(proxyPrinter);
                    mWeakPrinter = new WeakReference<ProxyPrinter>(proxyPrinter);
                } catch (FileNotFoundException e) {
                }
            }
        })

/*
iOS 端

子线程通过 ping 主线程来确认主线程当前是否卡顿。
卡顿阈值设置为 300ms,超过阈值时认为卡顿。
卡顿时获取主线程的堆栈,并存储上传。
*/
- (void) main() {
    while (self.cancle == NO) {
        self.isMainThreadBlocked = YES;
        dispatch_async(dispatch_get_main_queue(), ^{
            self.isMainThreadBlocked = YES;
            [self.semaphore singal];
        });
        [Thread sleep:300];
        if (self.isMainThreadBlocked) {
            [self handleMainThreadBlock];
        }
        [self.semaphore wait];
    }
}
-
整个 APM 的架构图如下
![]()
说明:
- 埋点 SDK,通过 sessionId 来关联日志数据
- wax 上面介绍过了,是一种多端项目管理模式,每个 wax 项目都具有基础信息
-
APM 技术方案本身是随着技术手段、分析需求不断调整升级的。上图的几个结构示意图是早期几个版本的,目前使用的是在此基础上进行了升级和结构调整,提几个关键词:Hermes、Flink SQL、InfluxDB。
参考资料
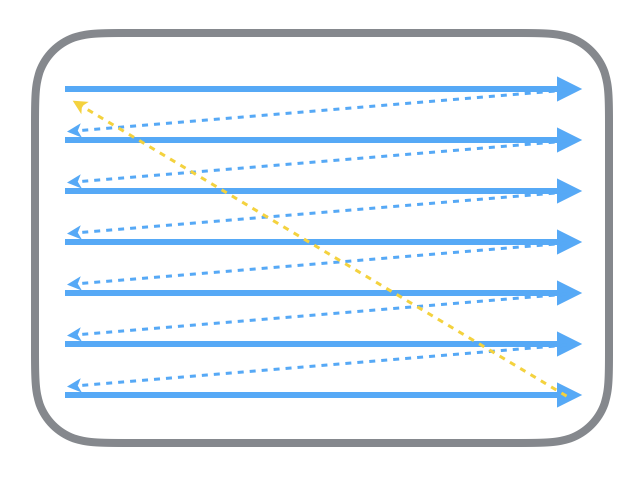
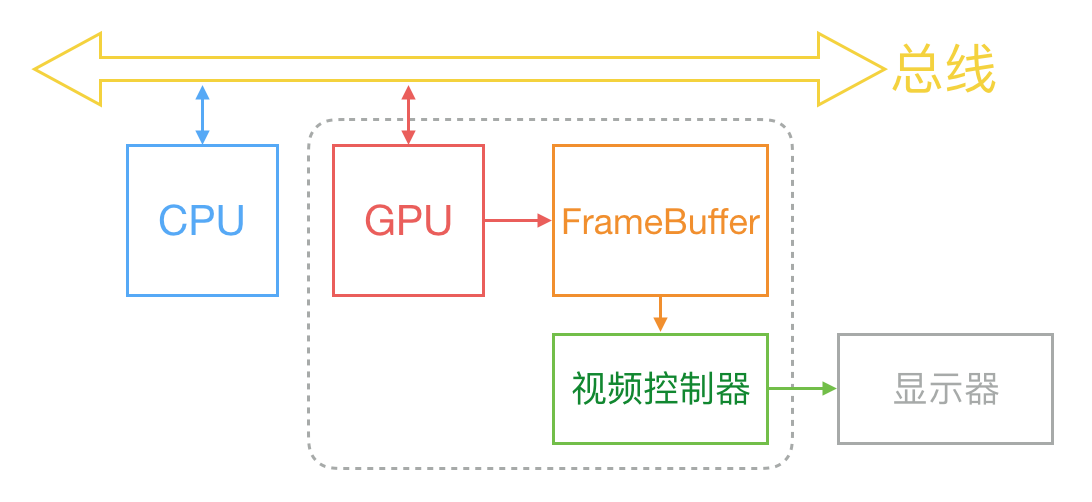
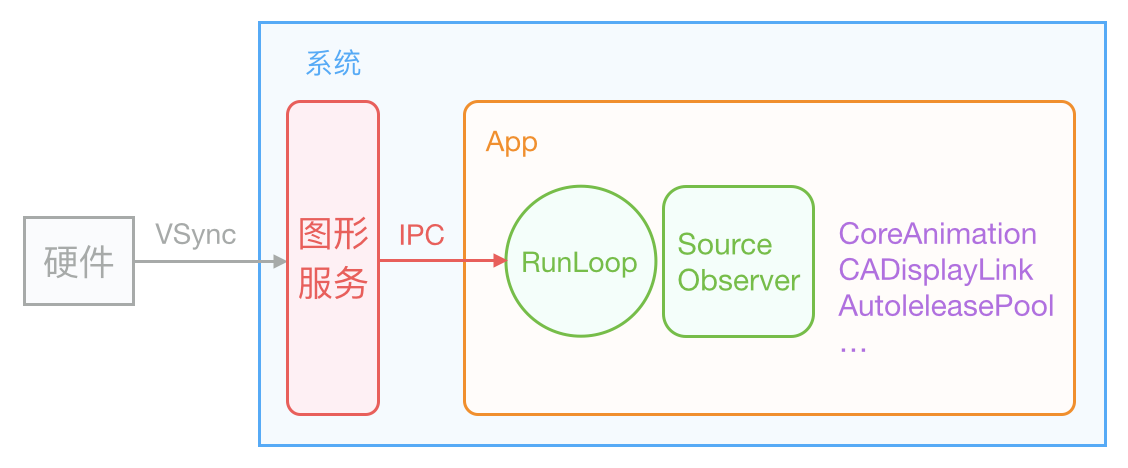
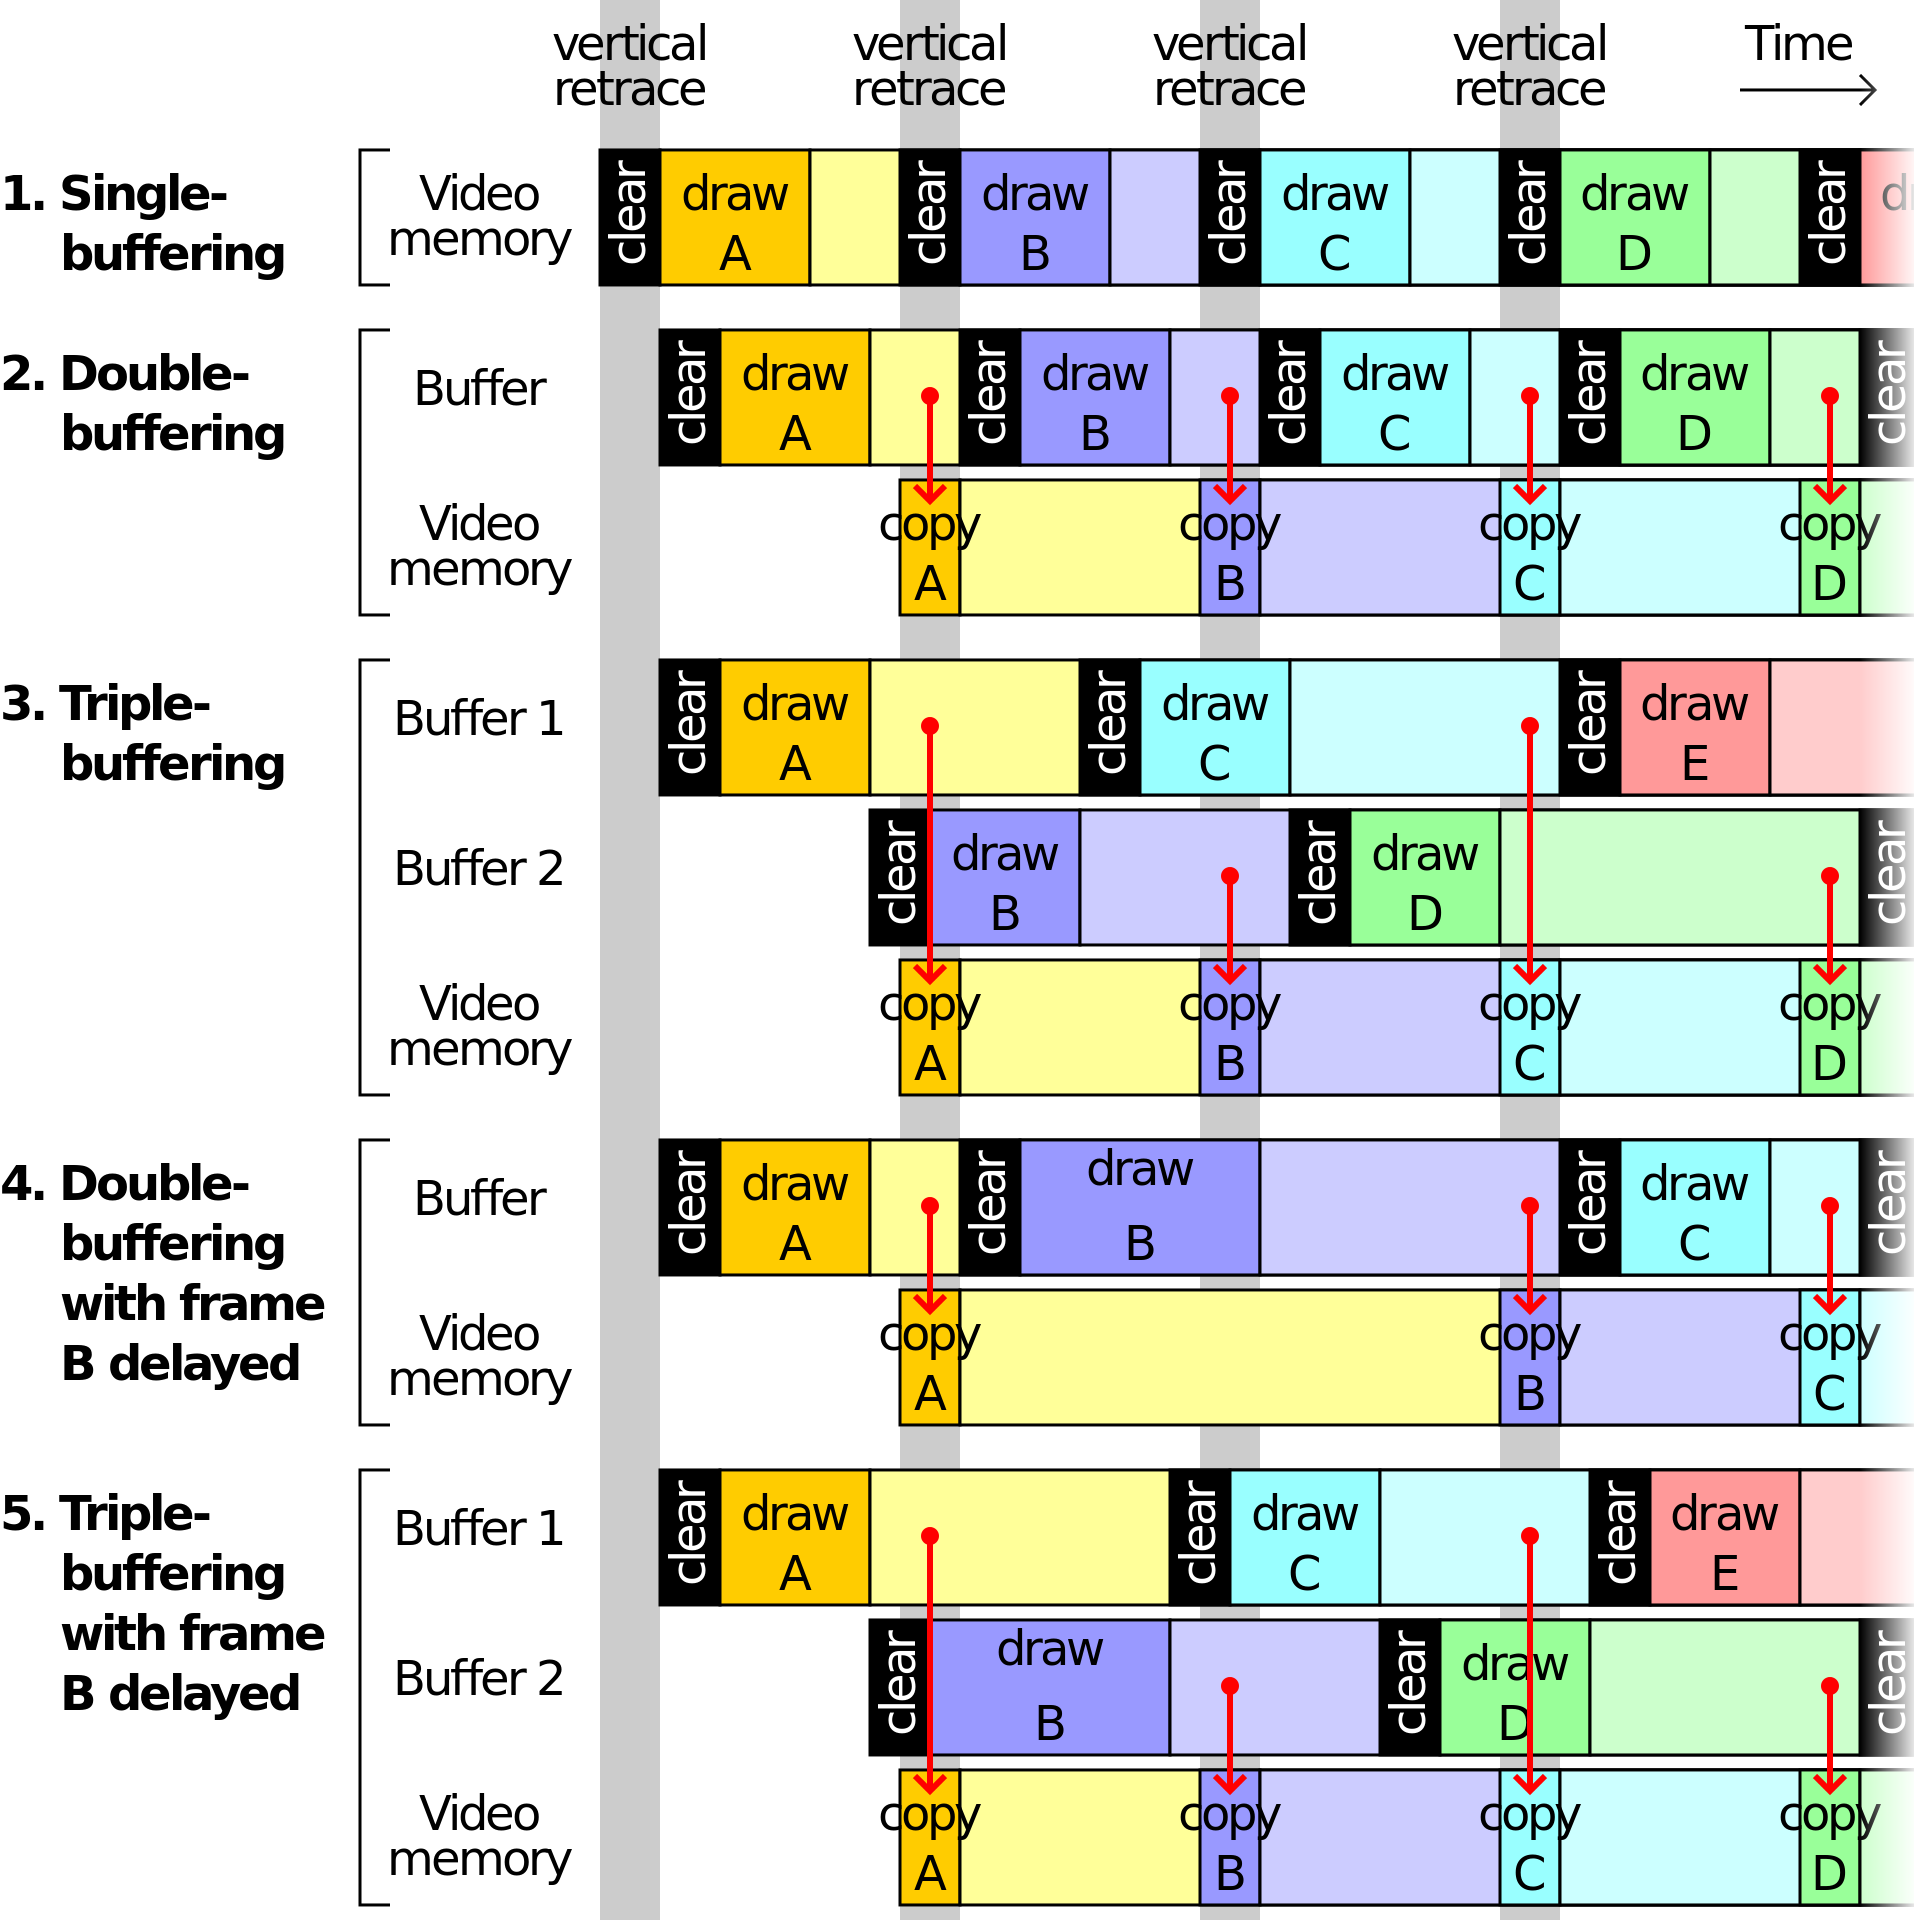
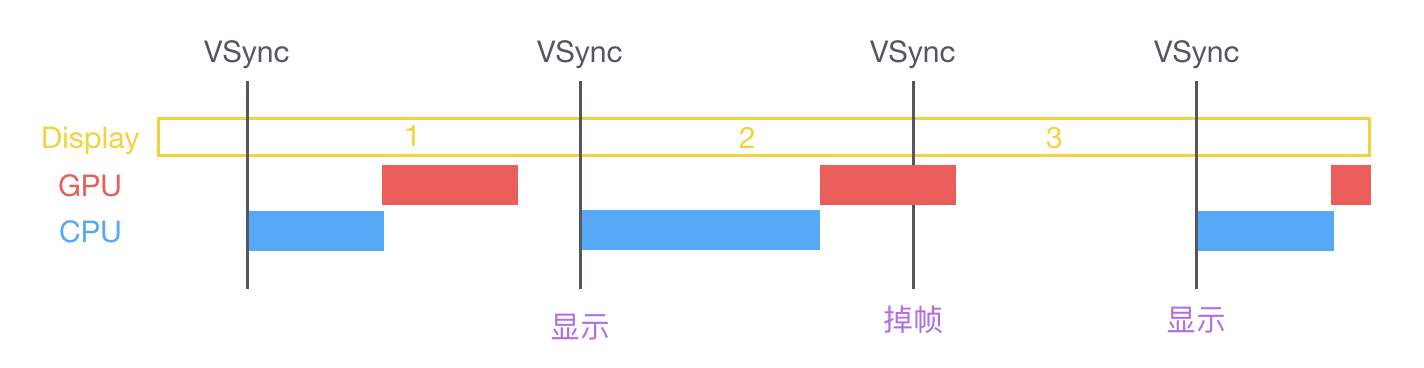
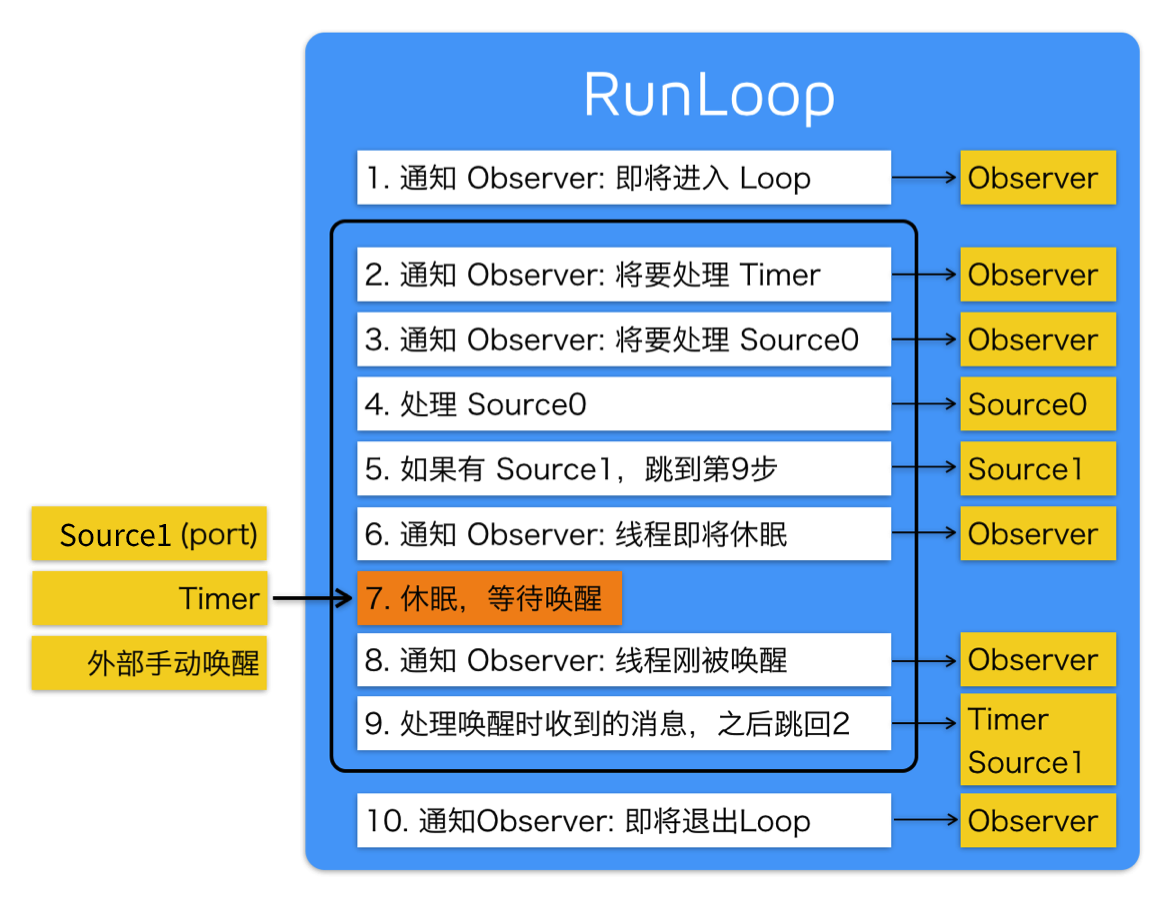
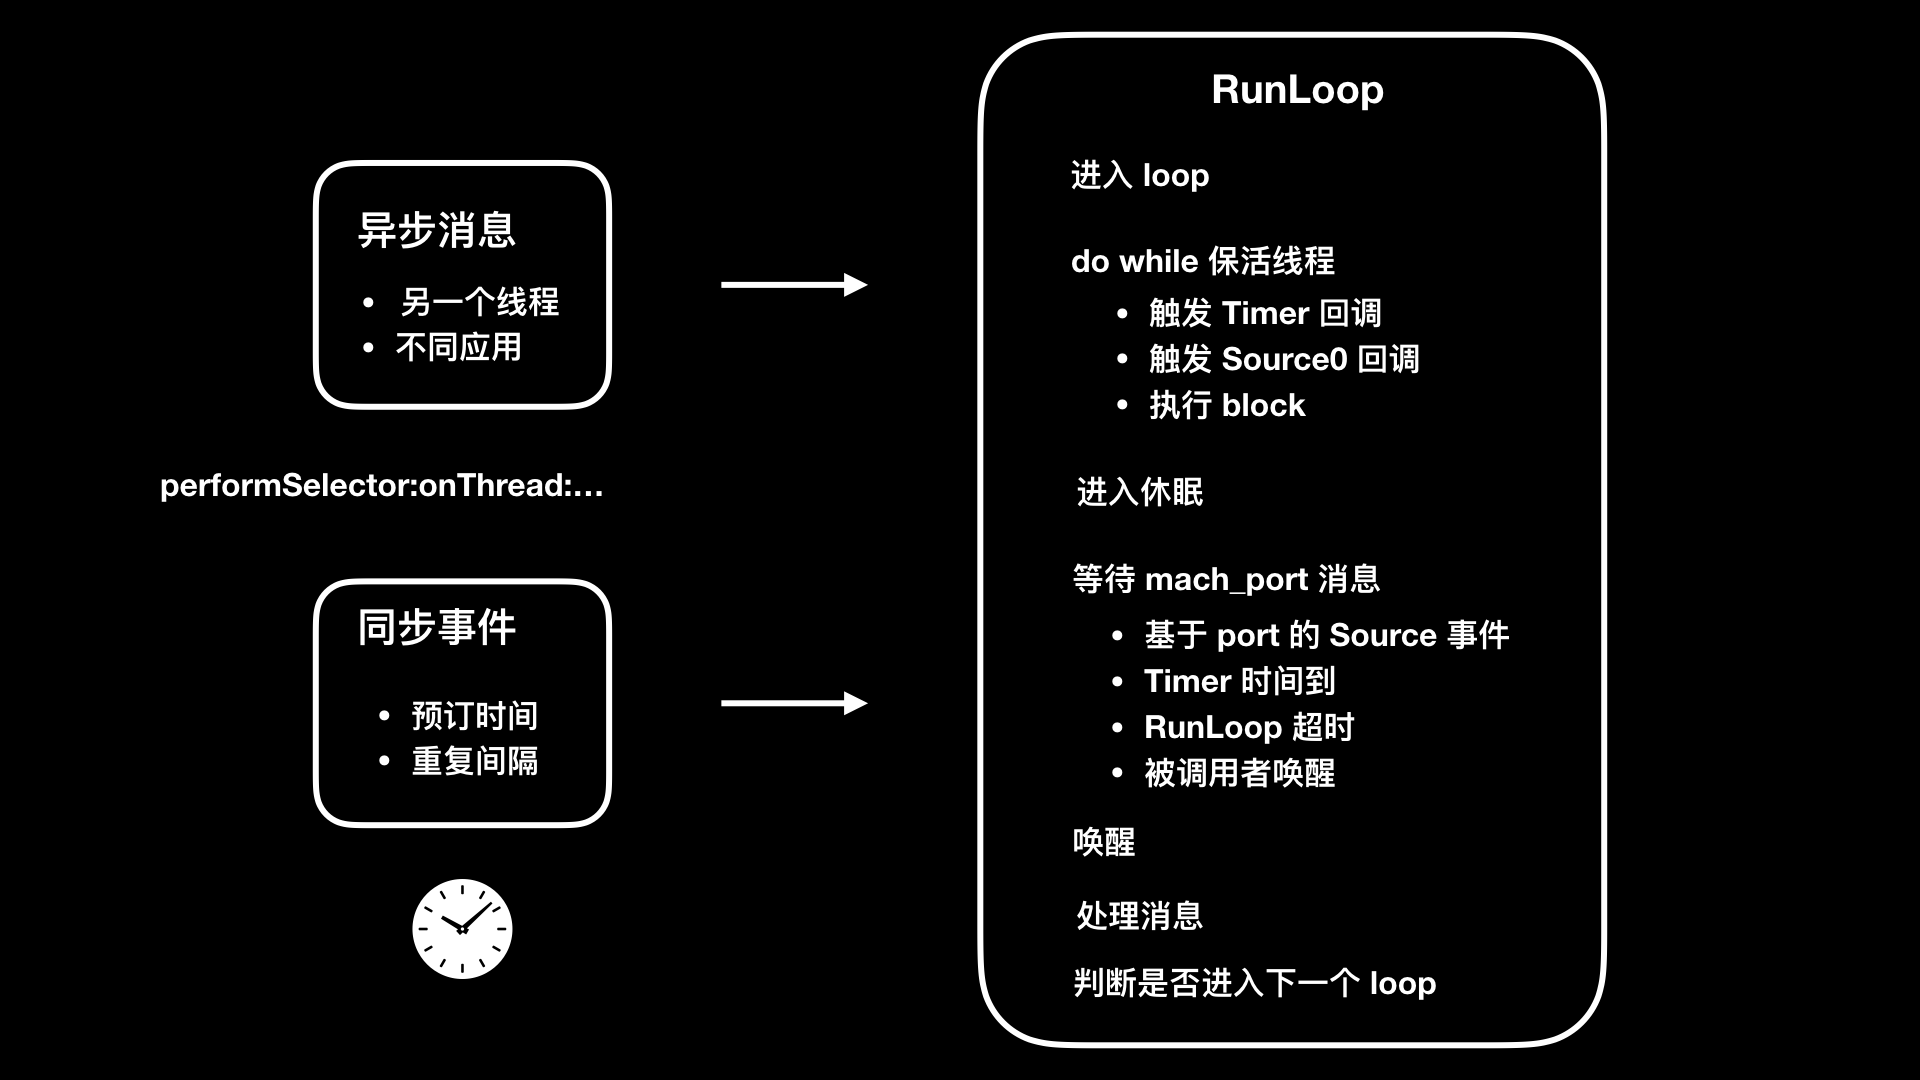 RunLoop 6个状态
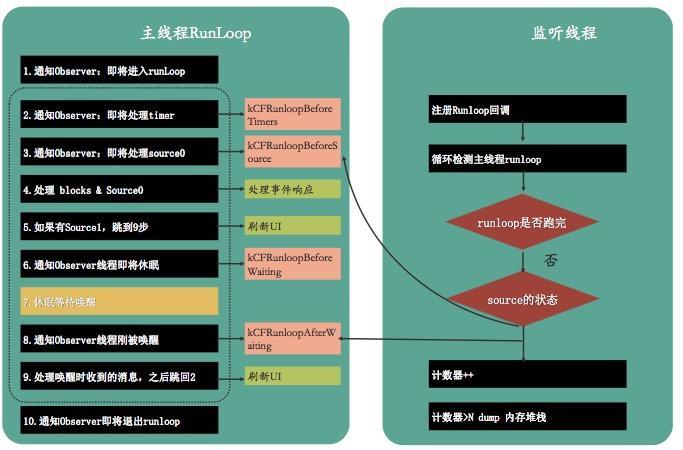
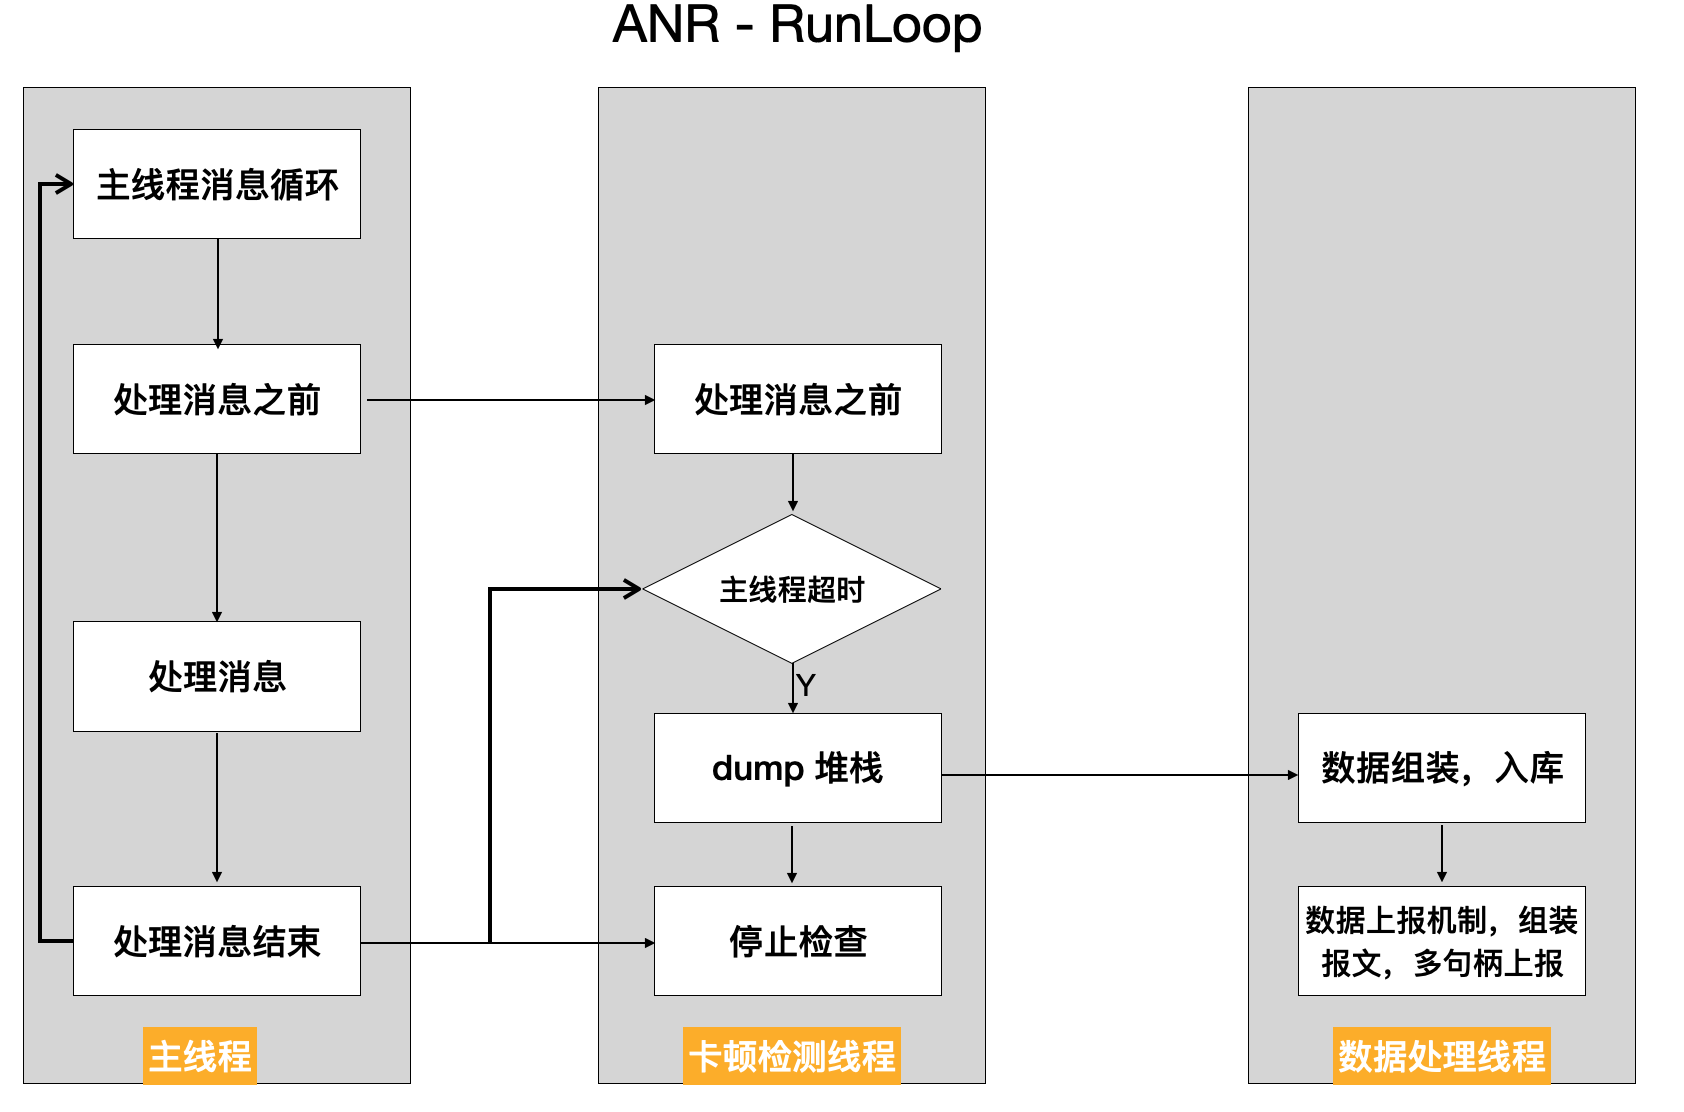
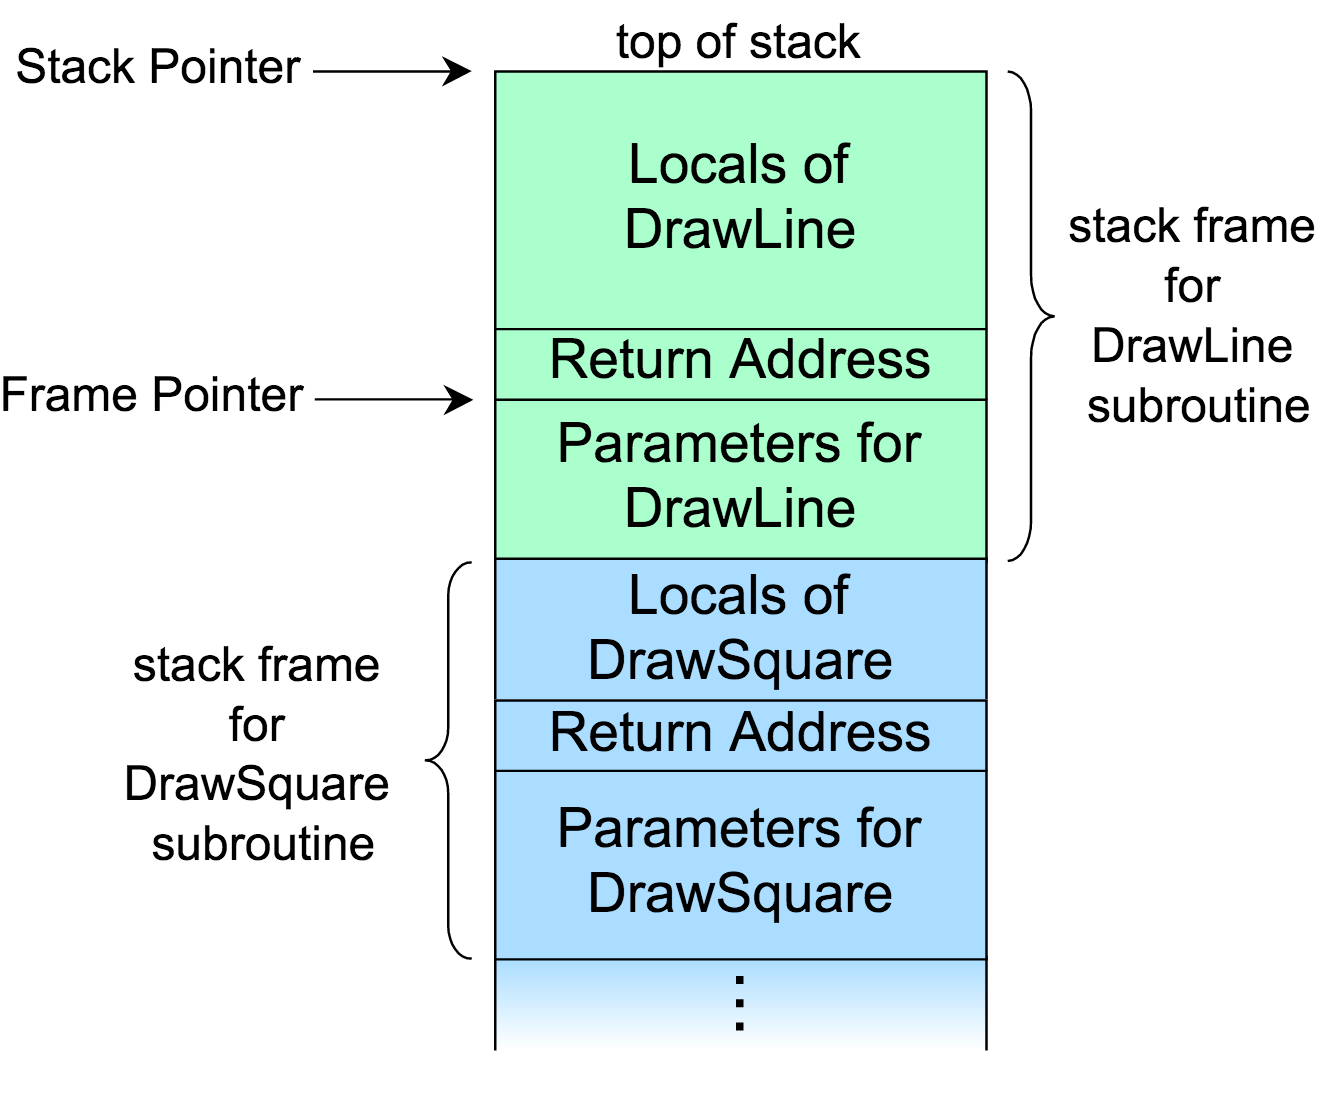
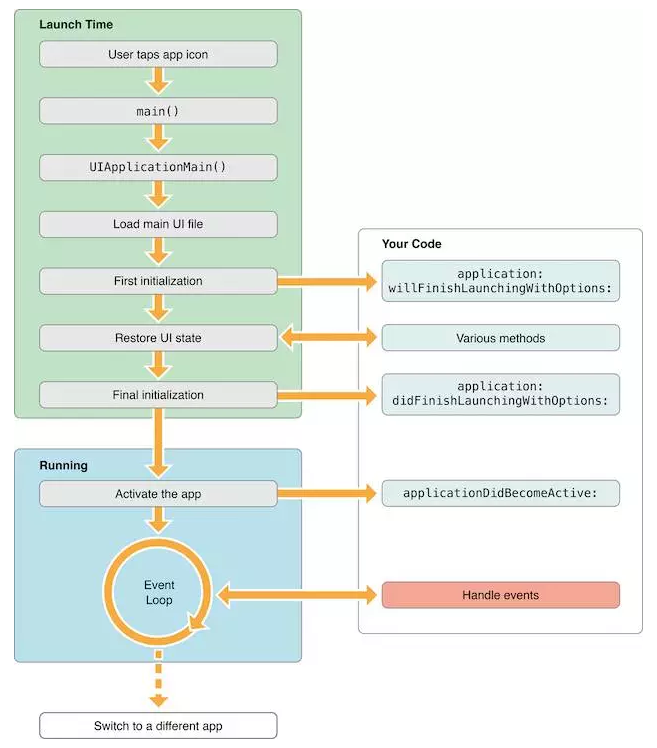
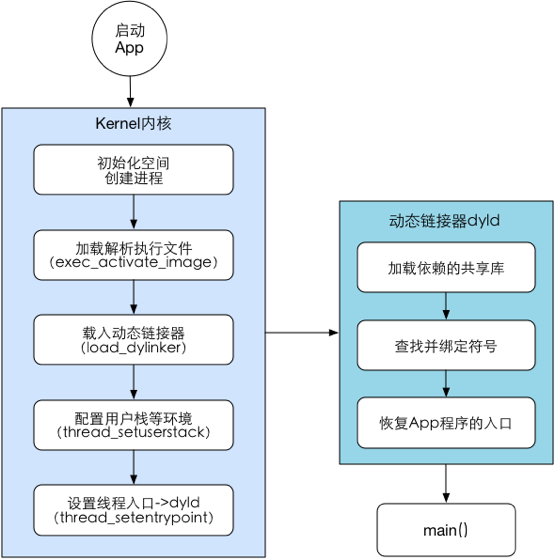
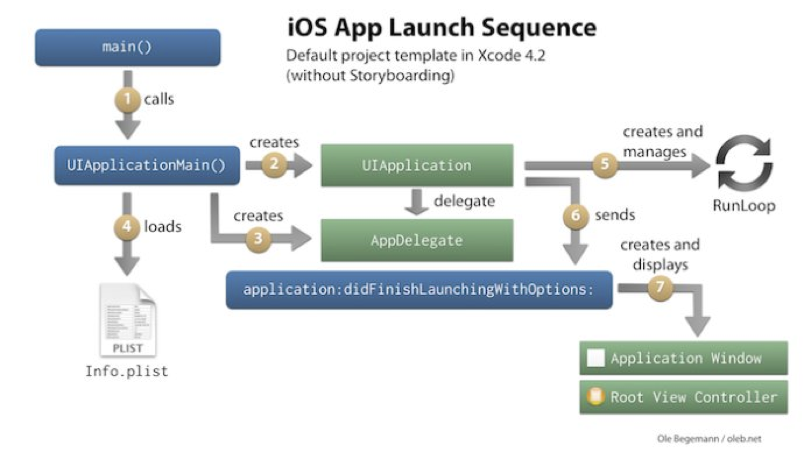
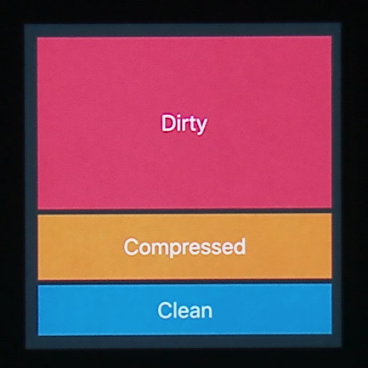
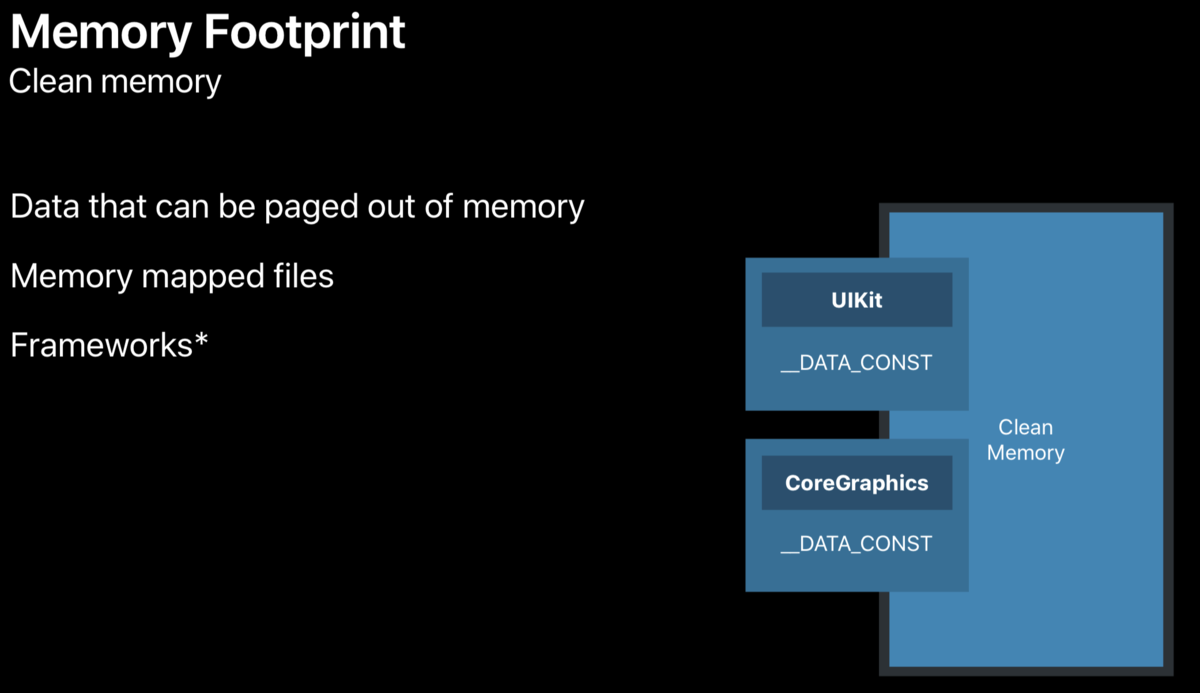
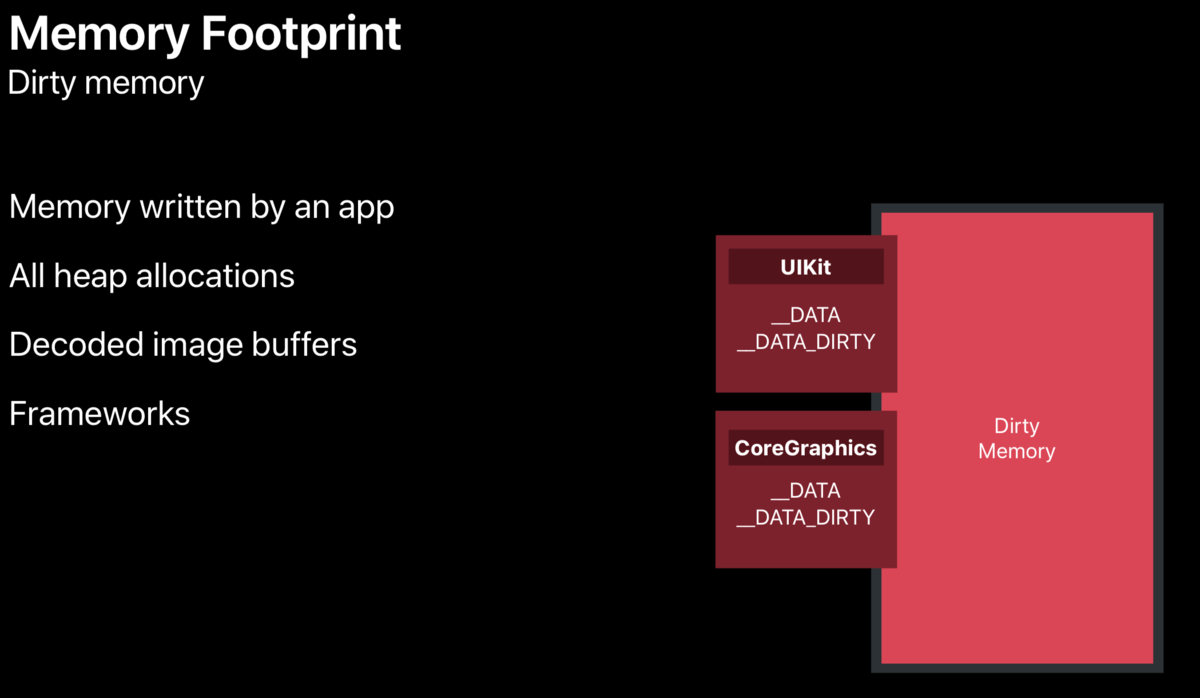
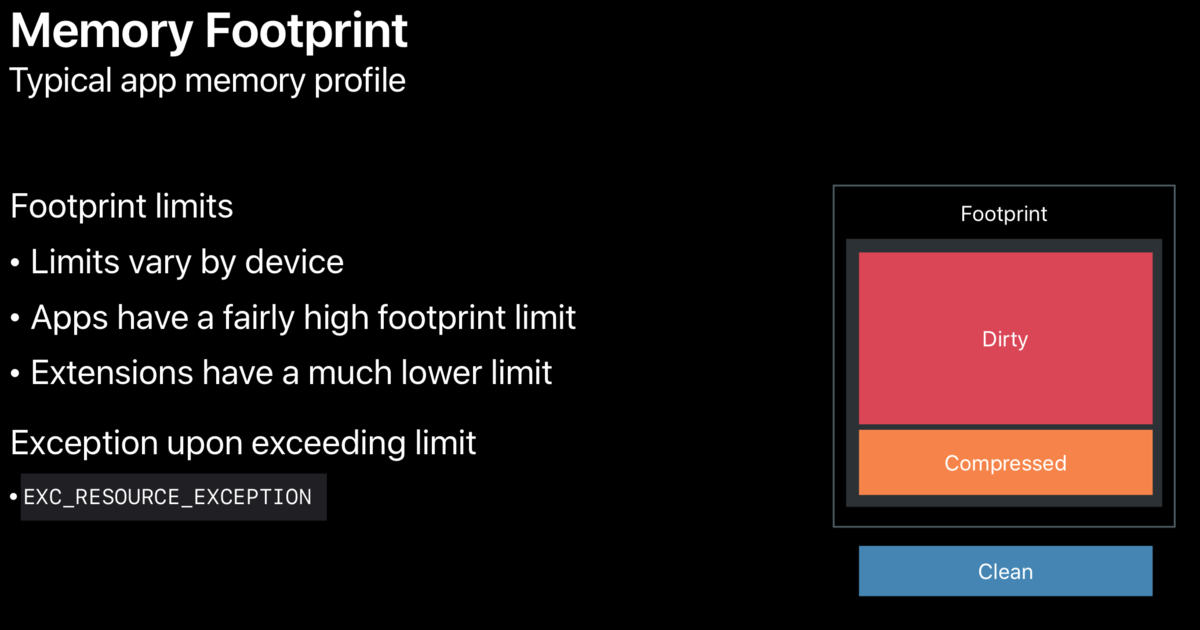
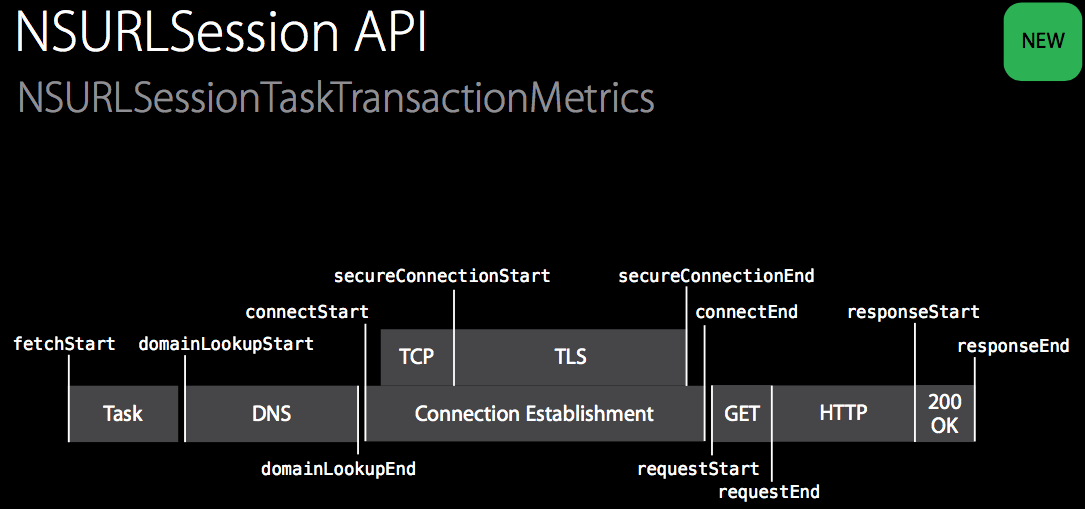
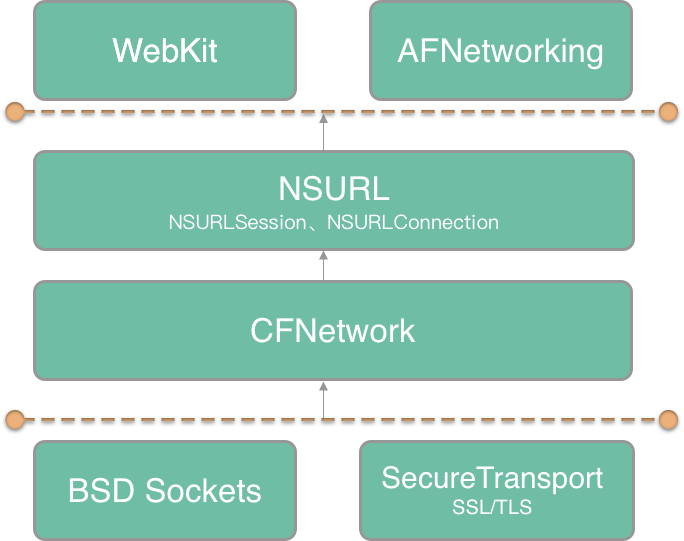
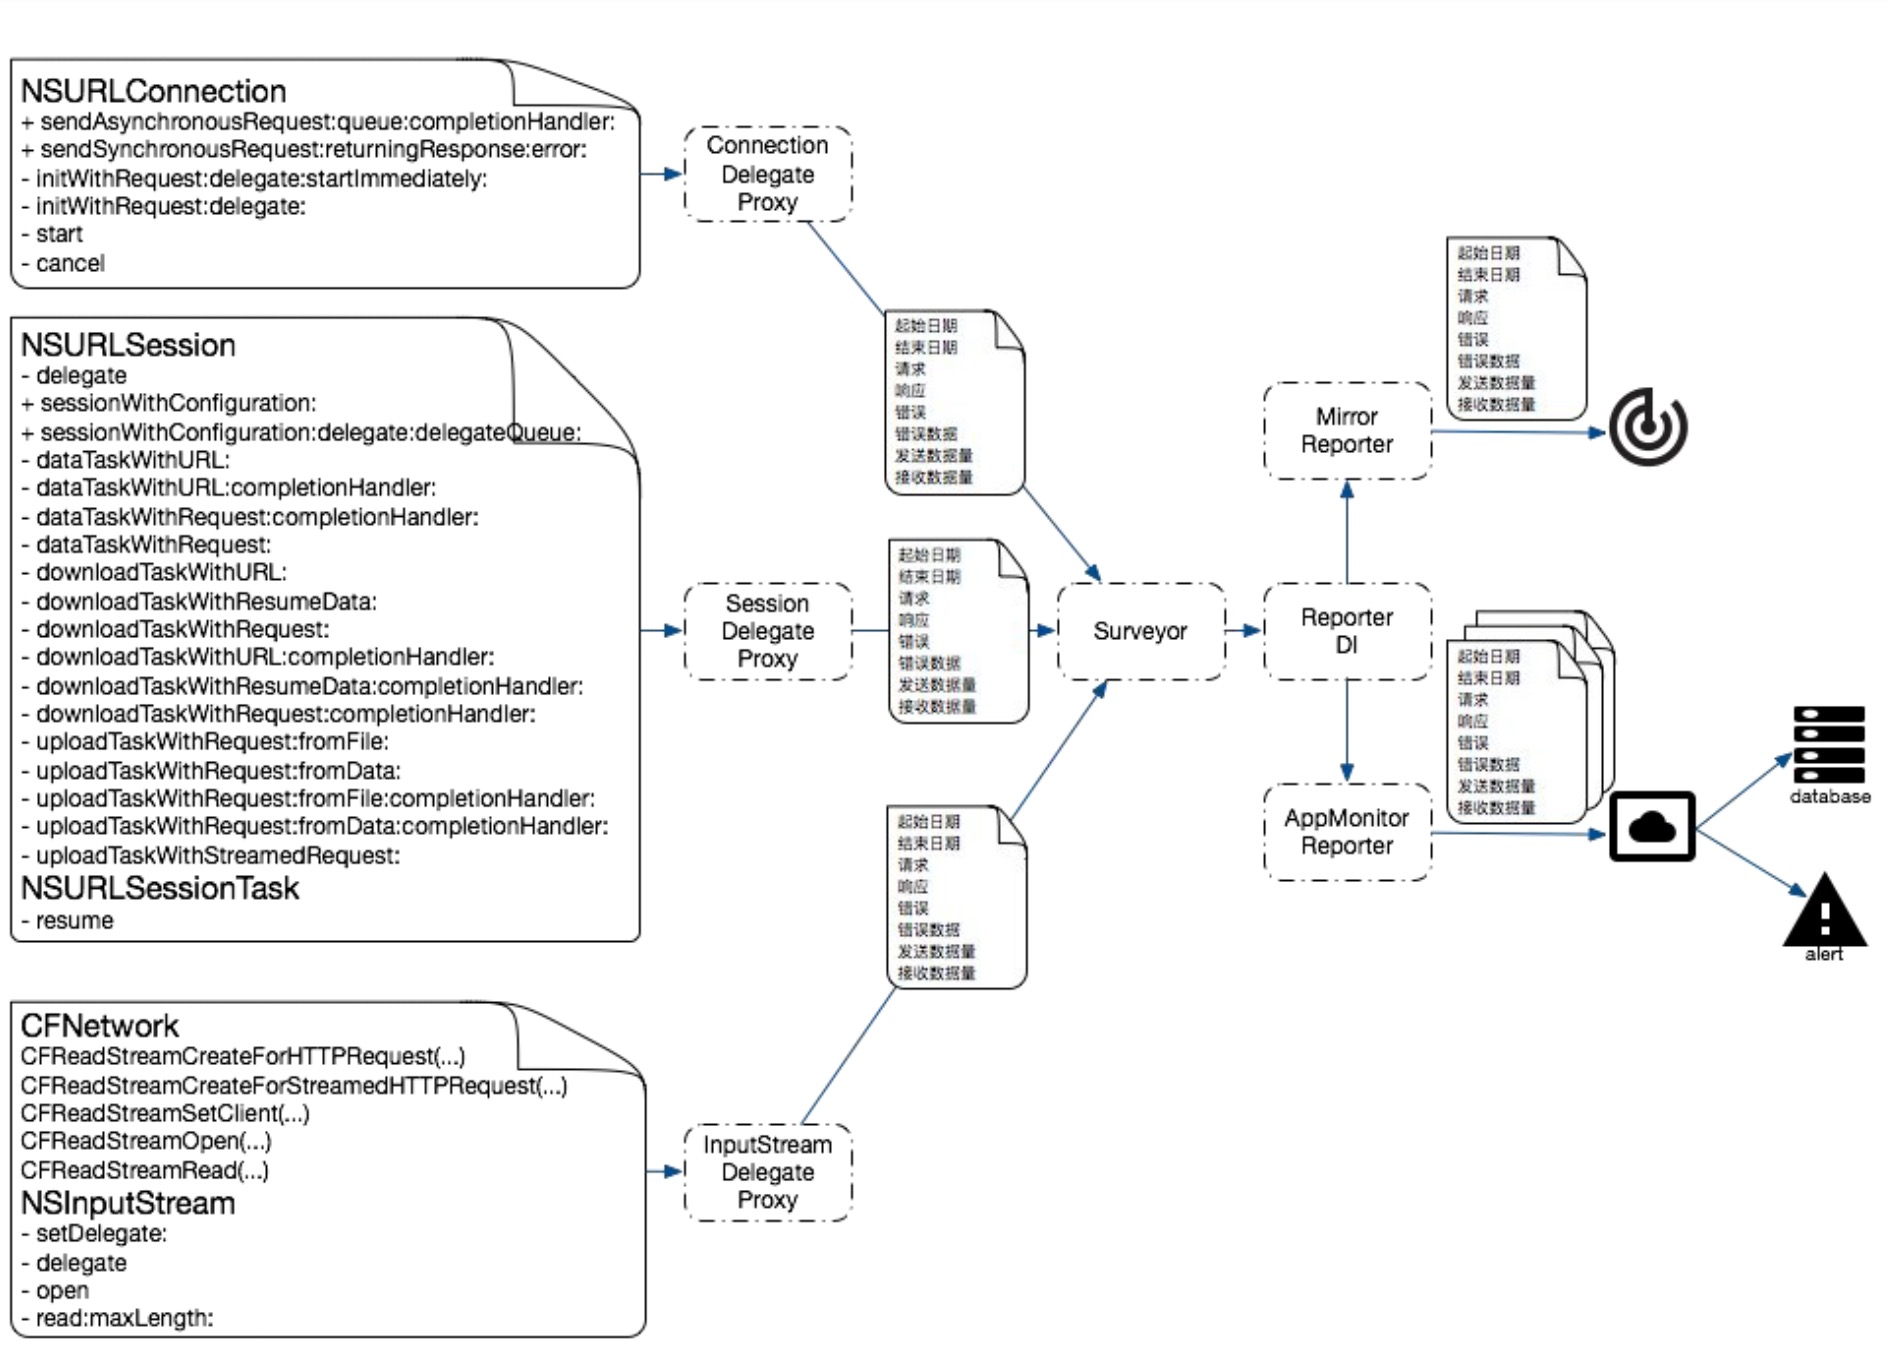
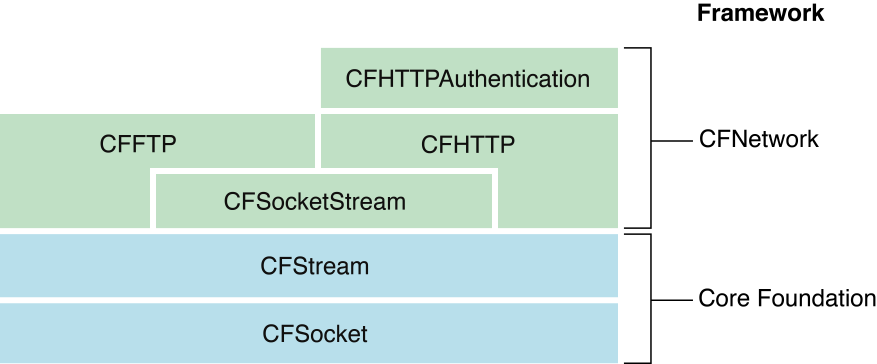
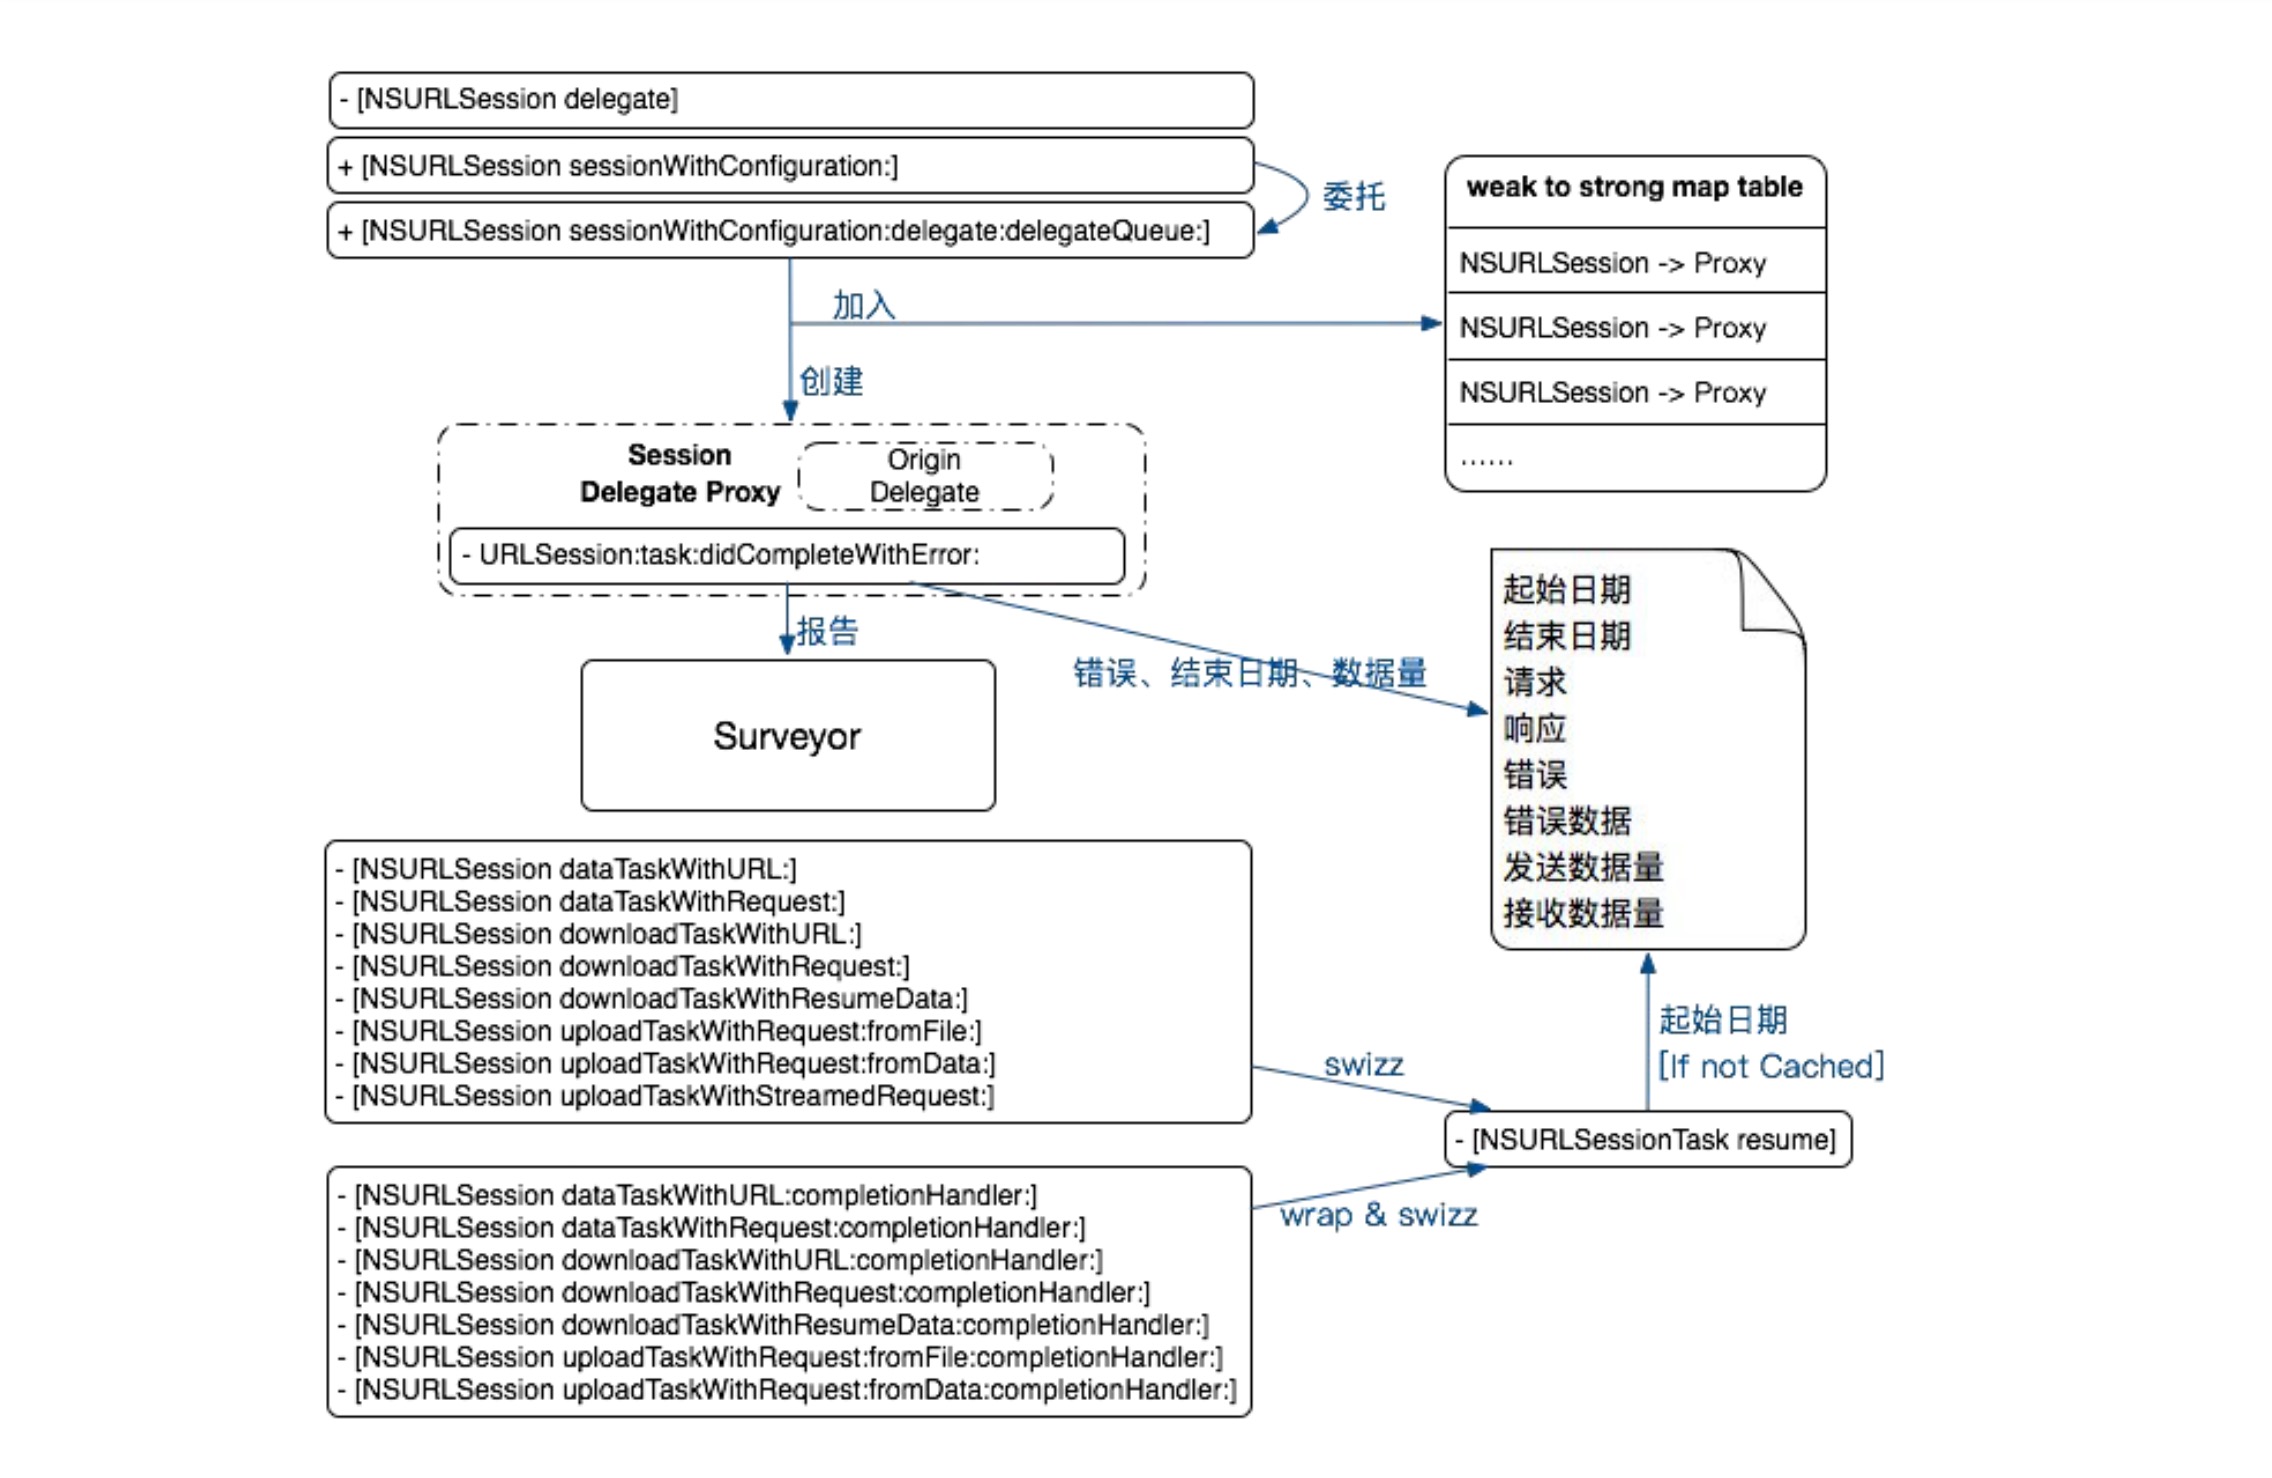
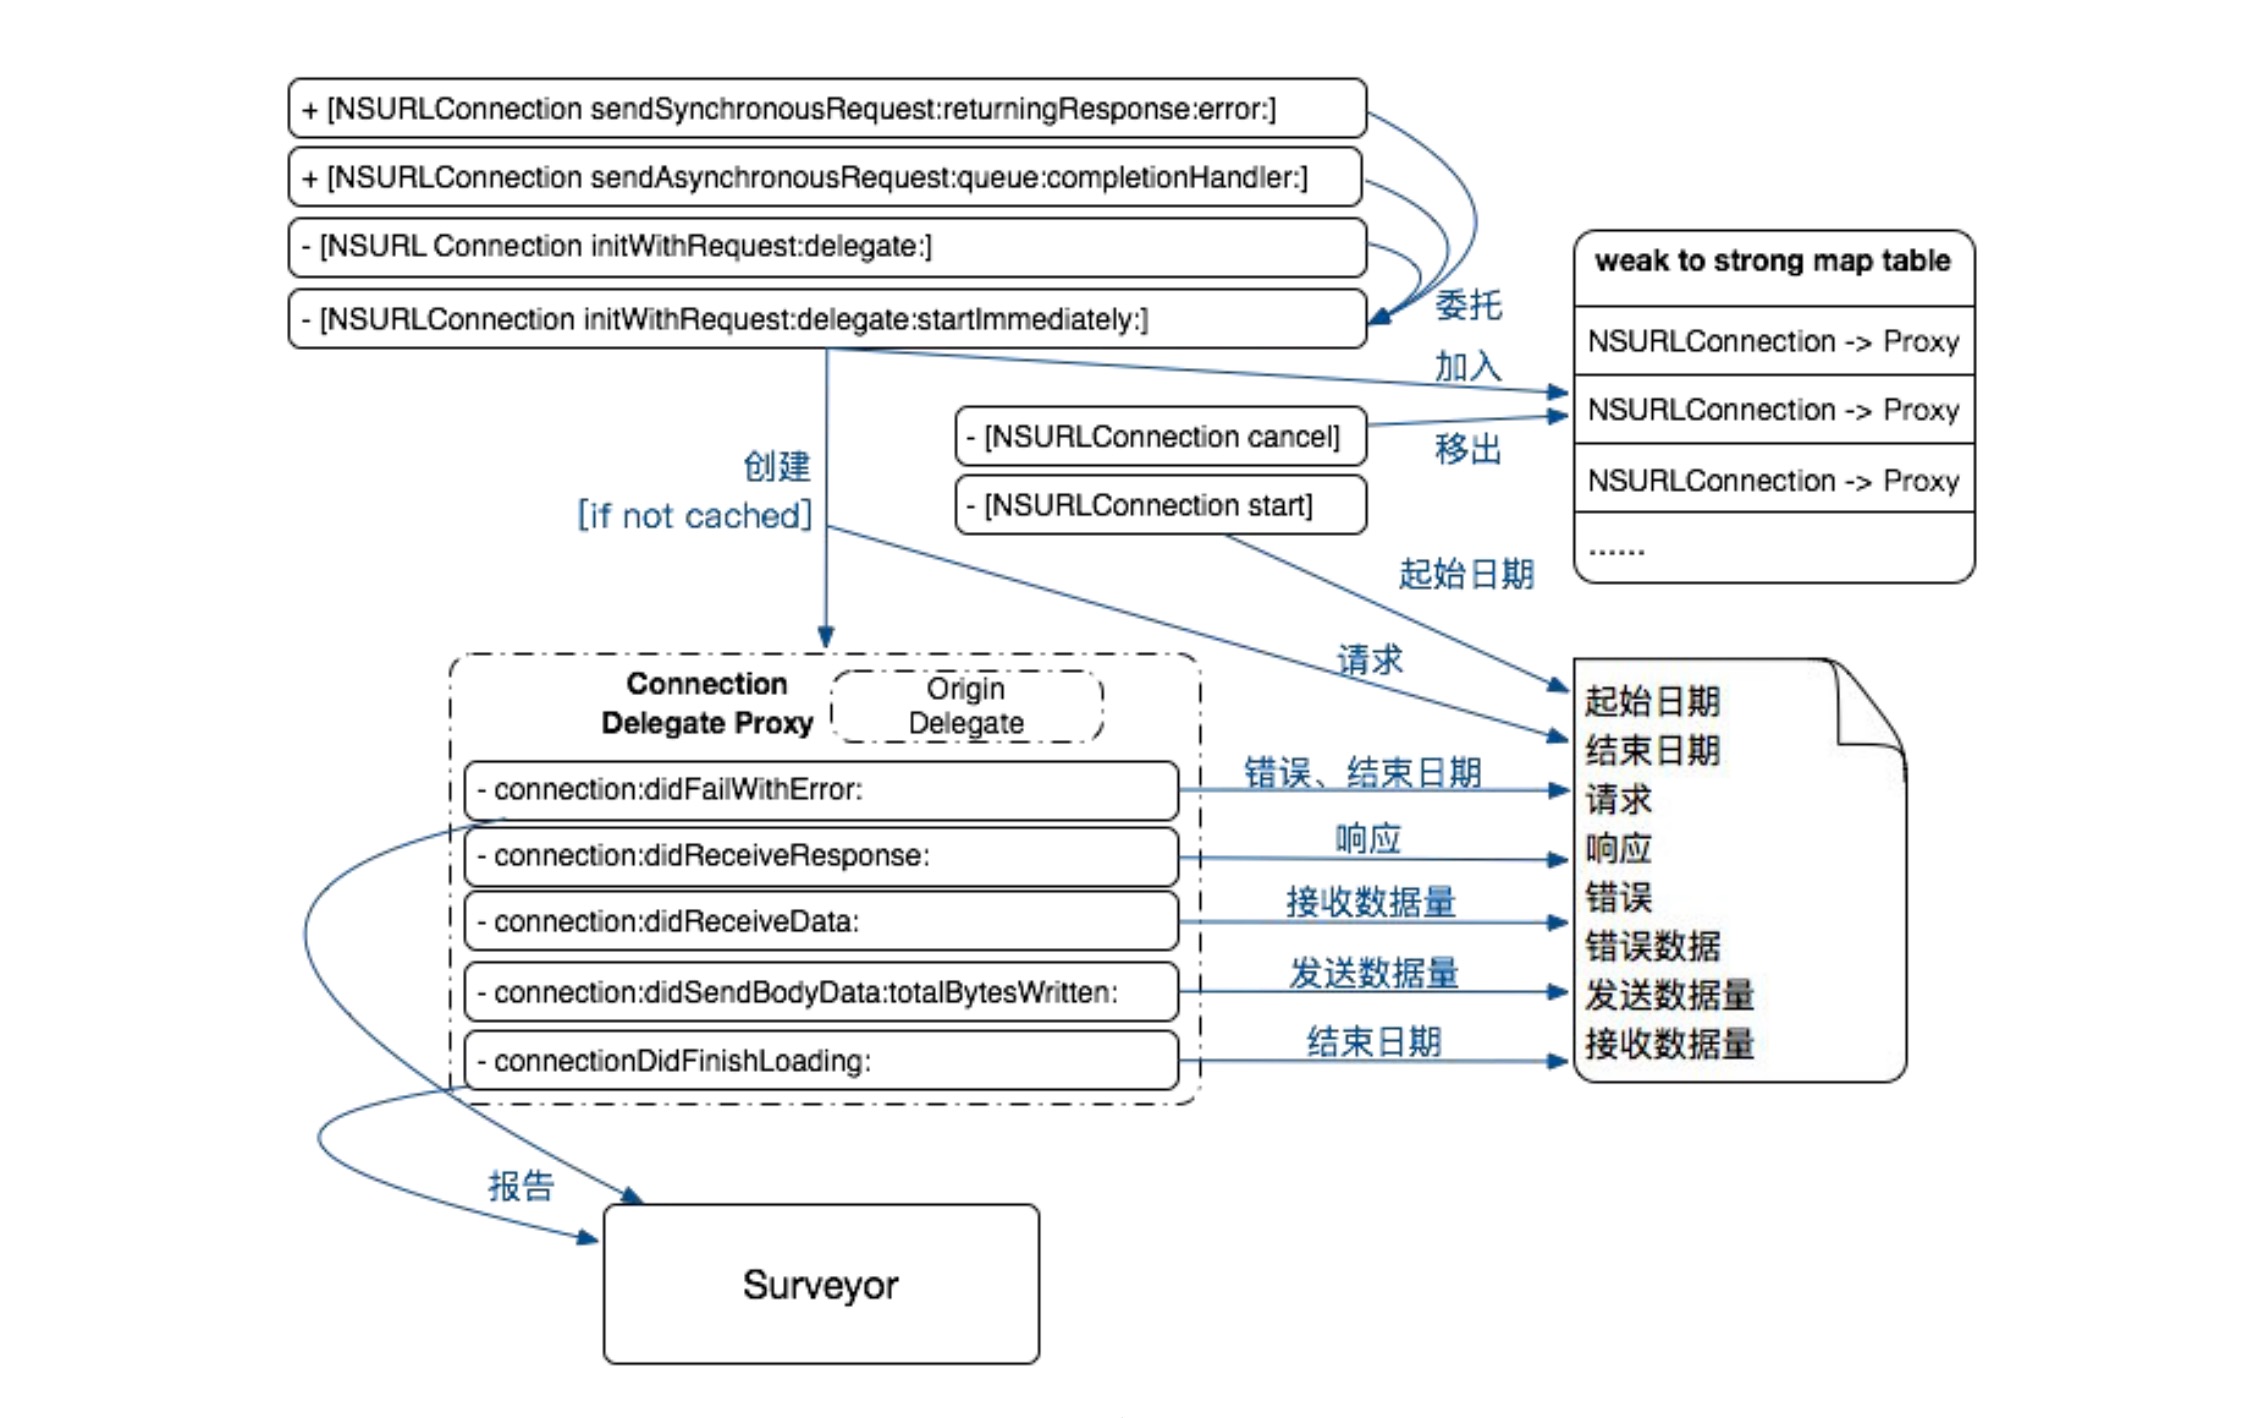
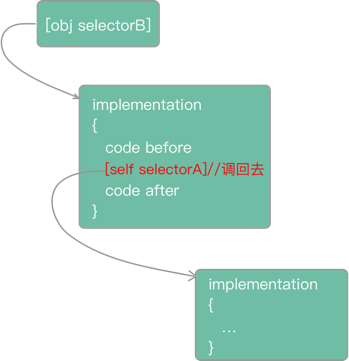
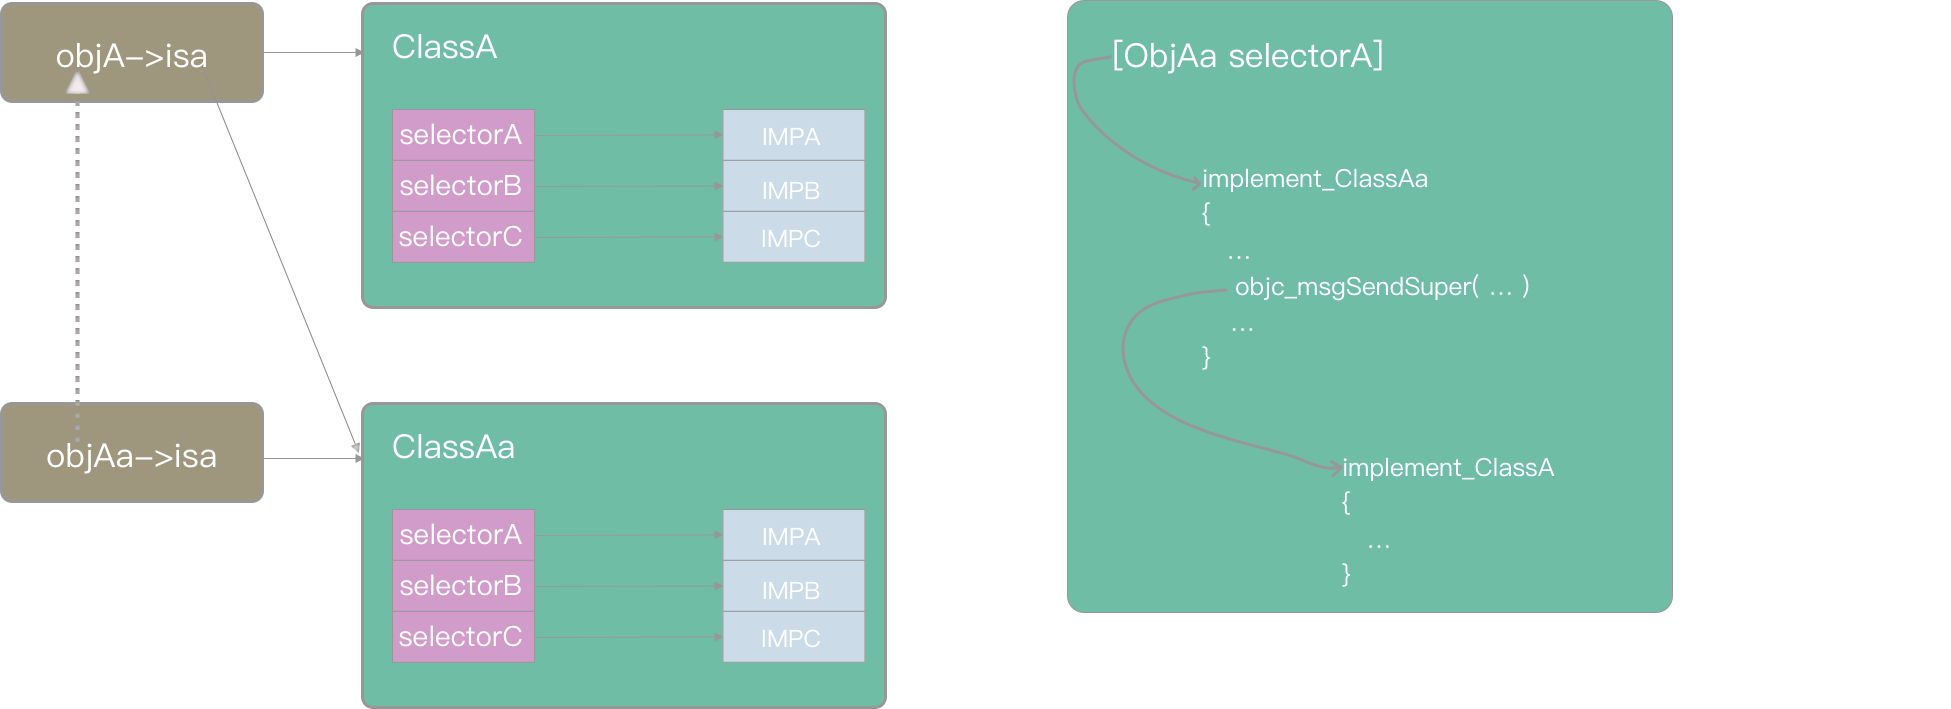
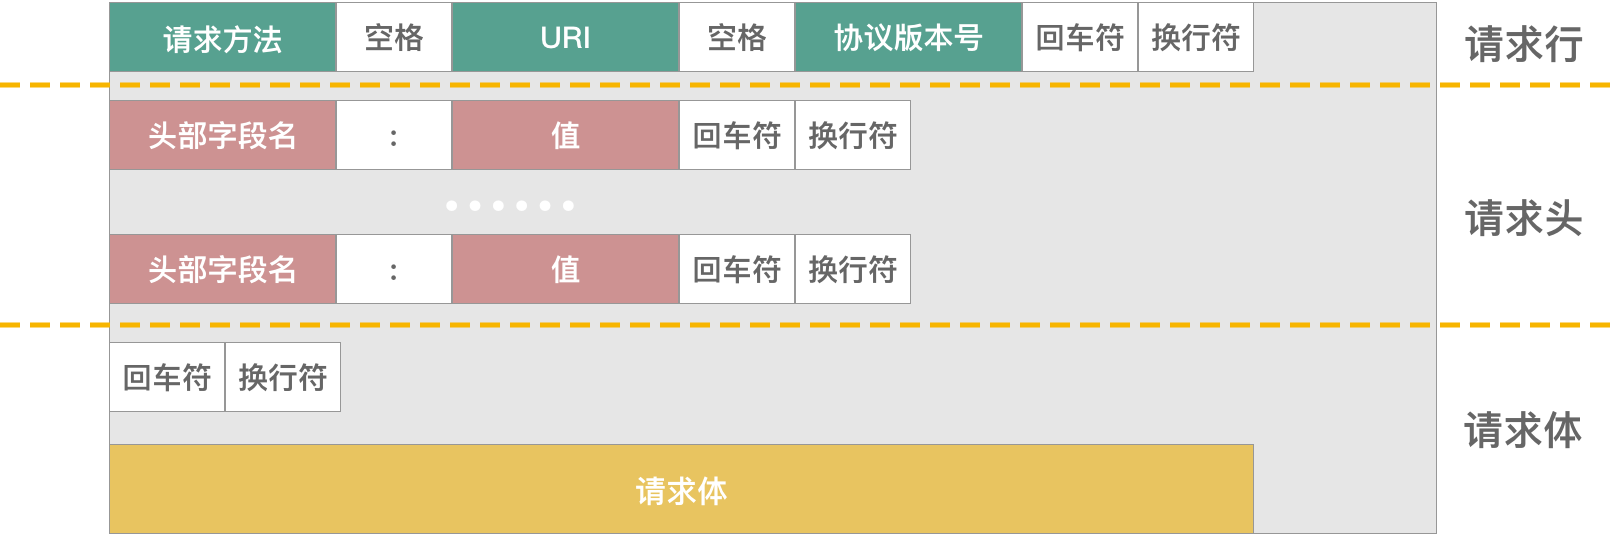
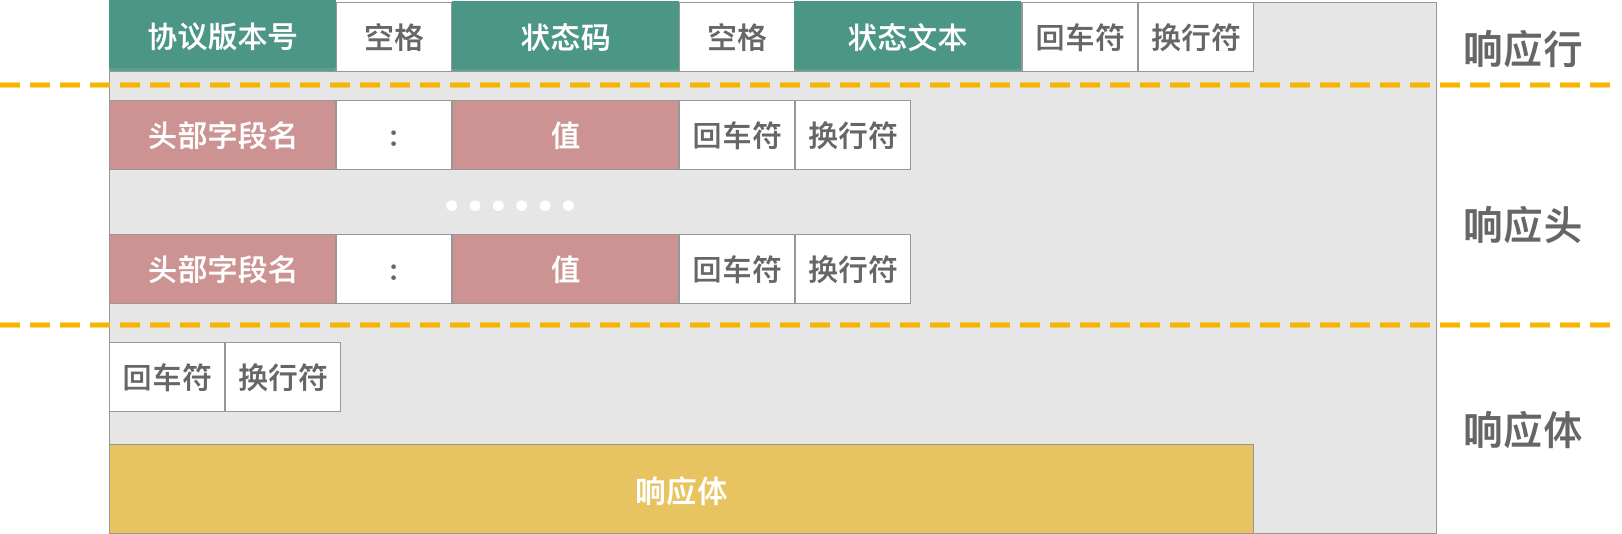
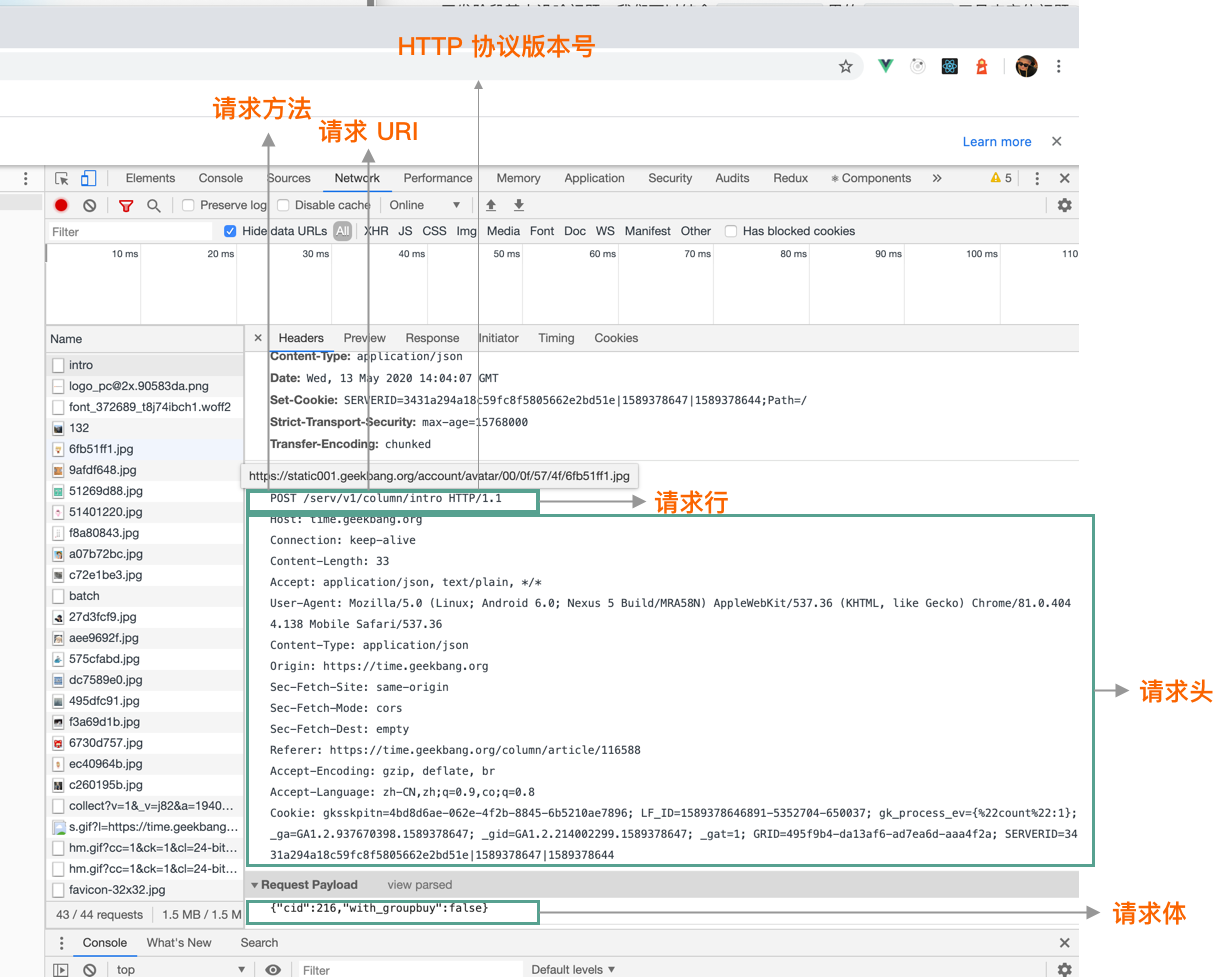
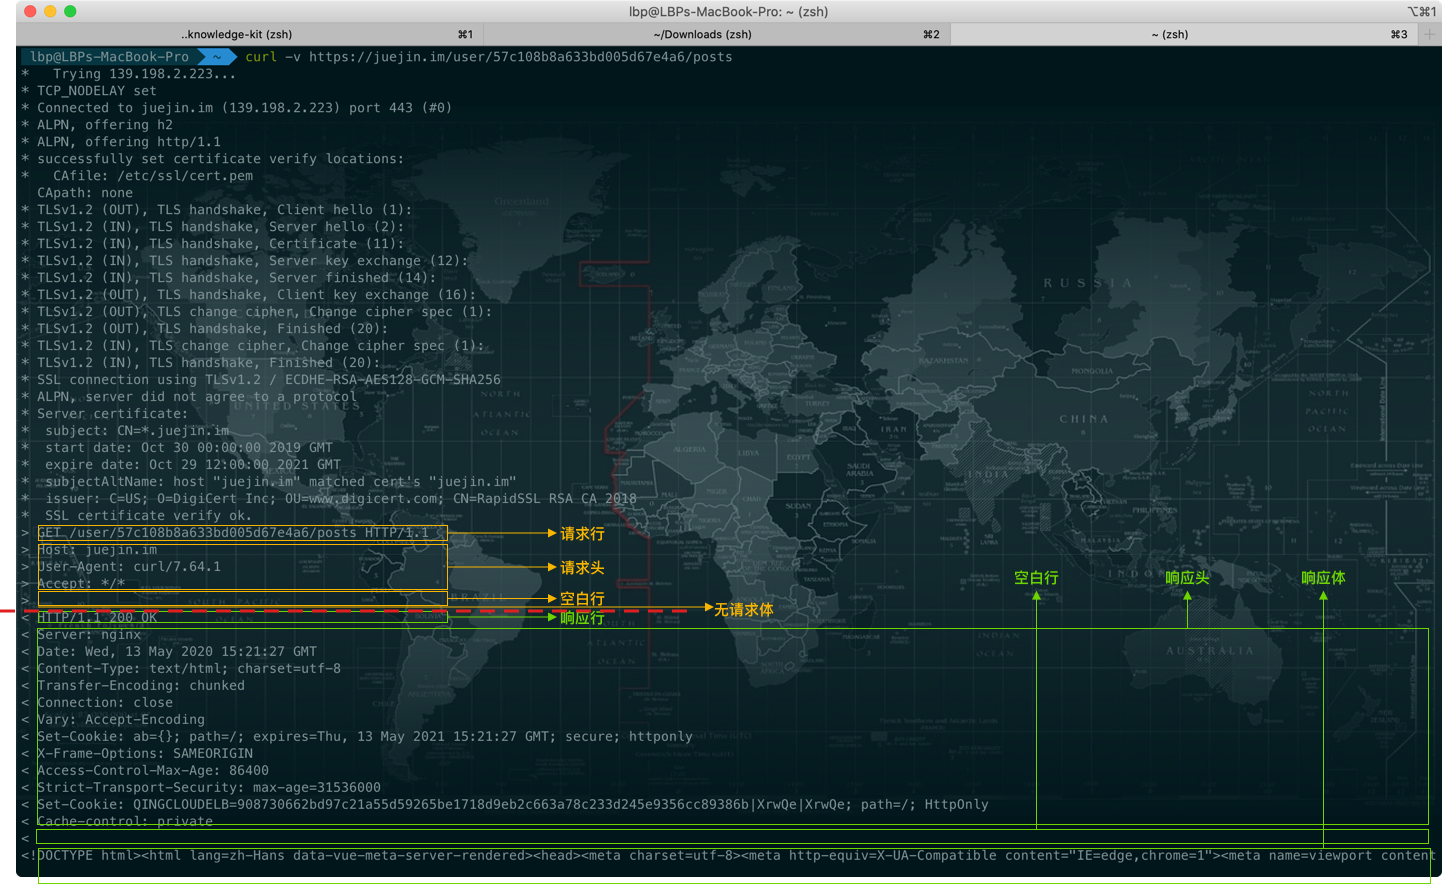
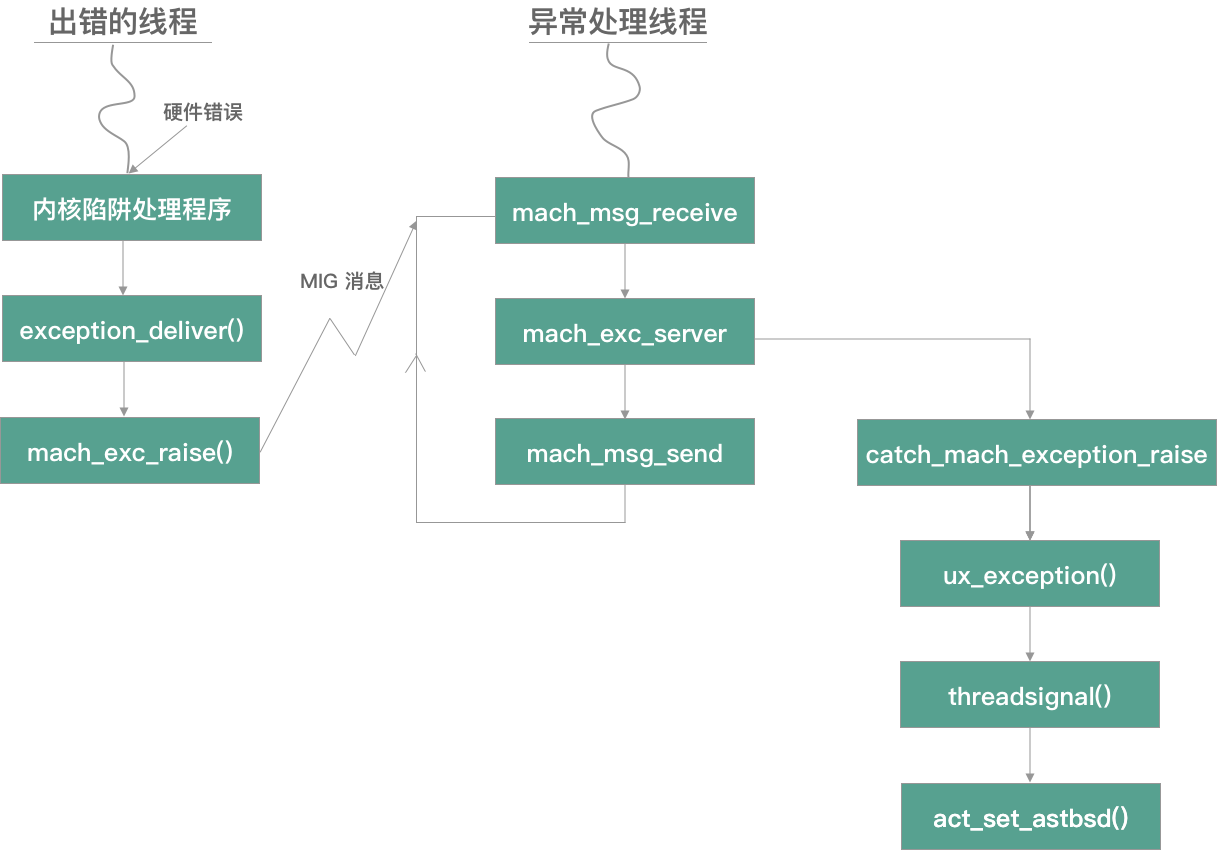
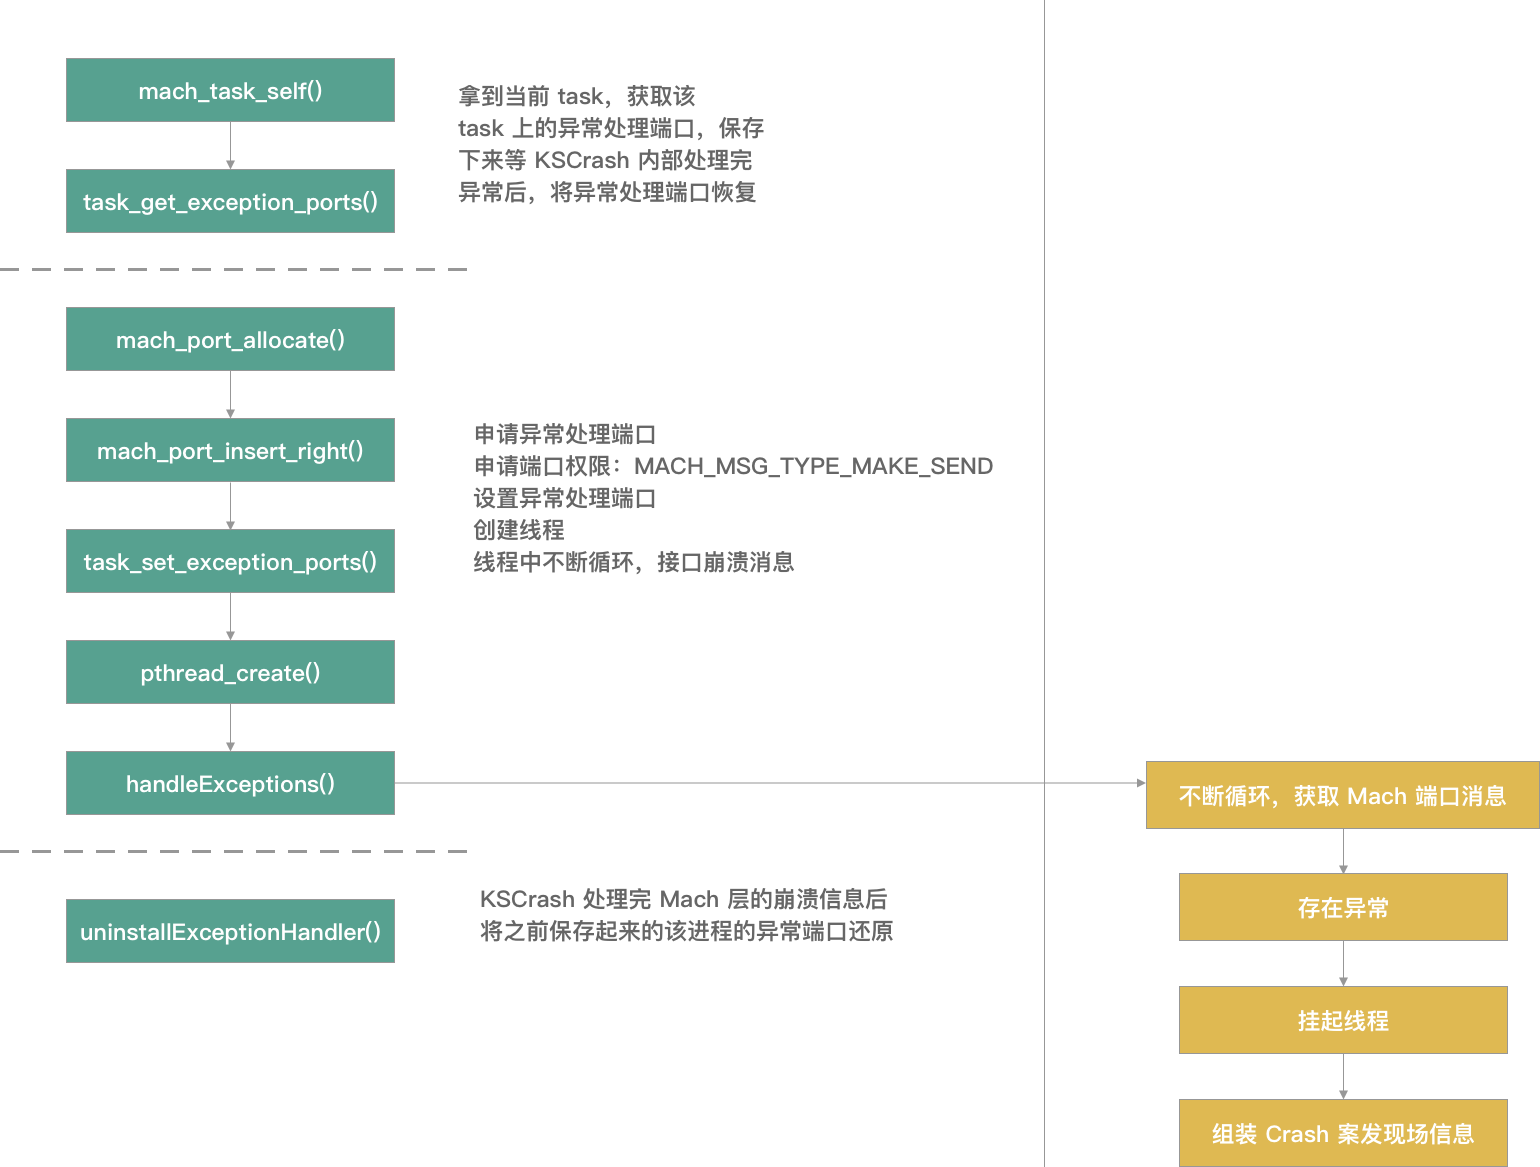
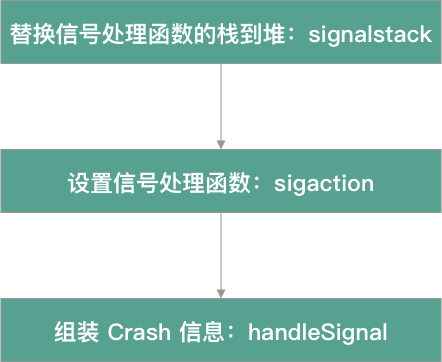
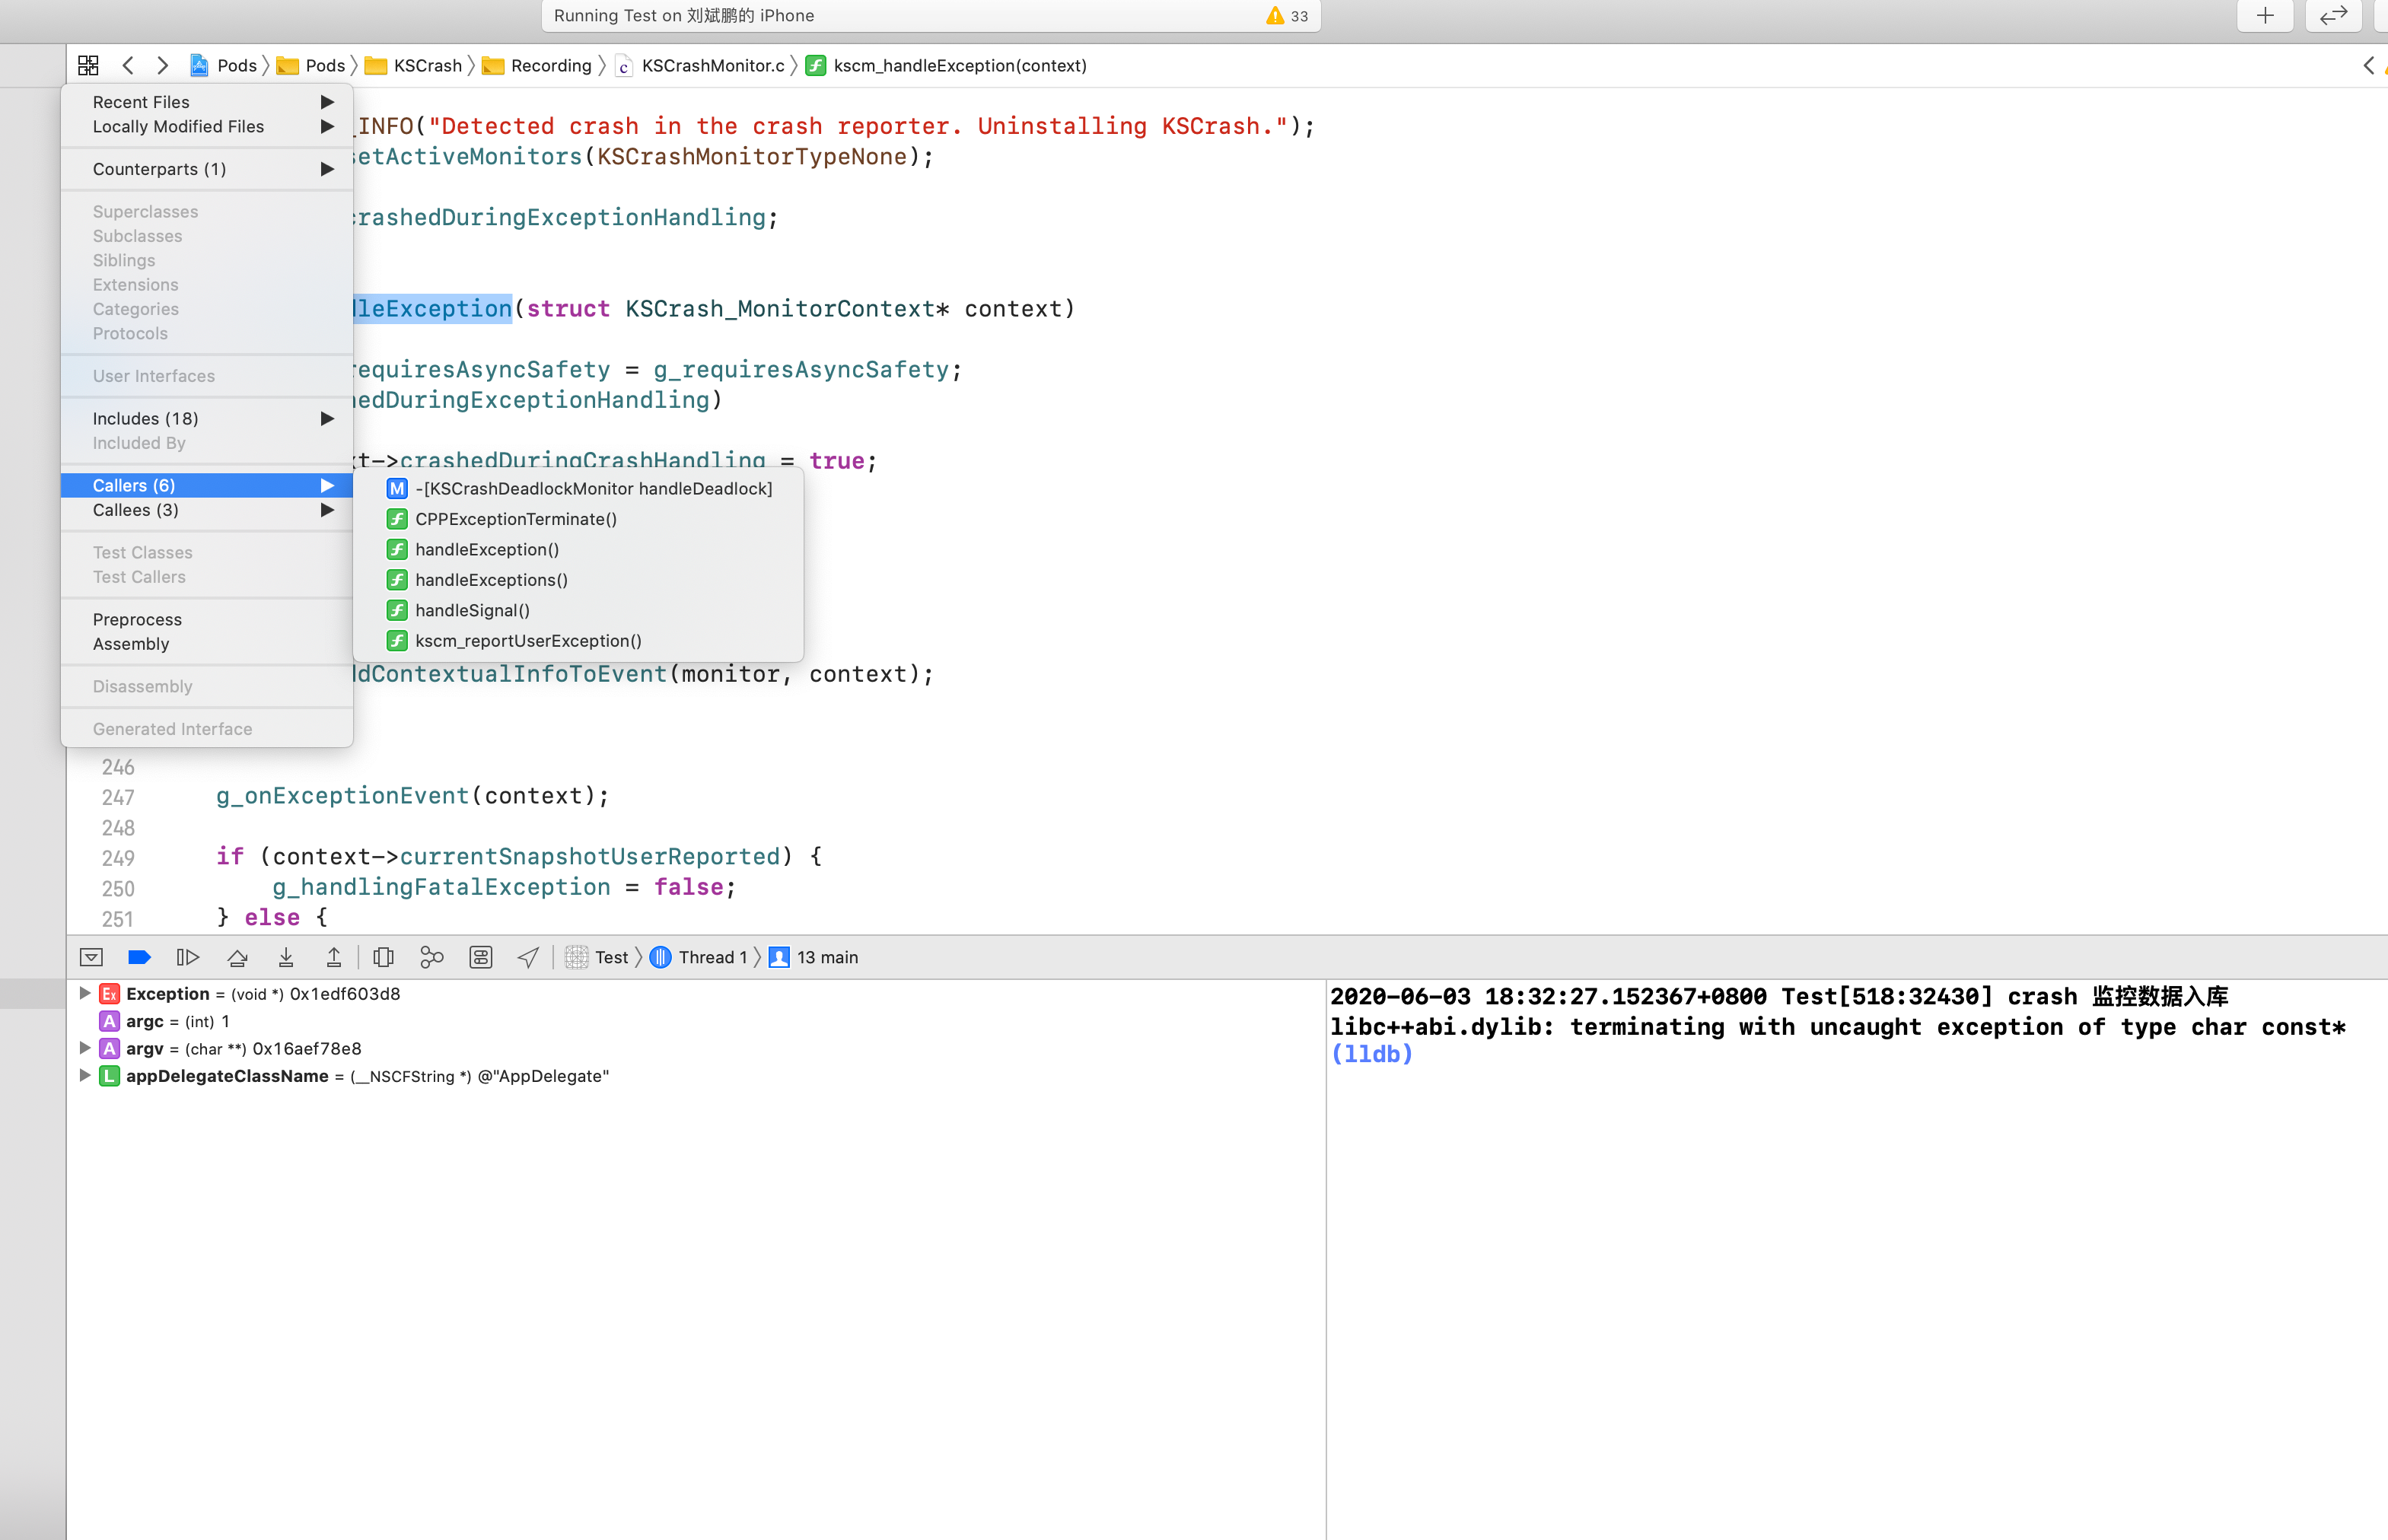
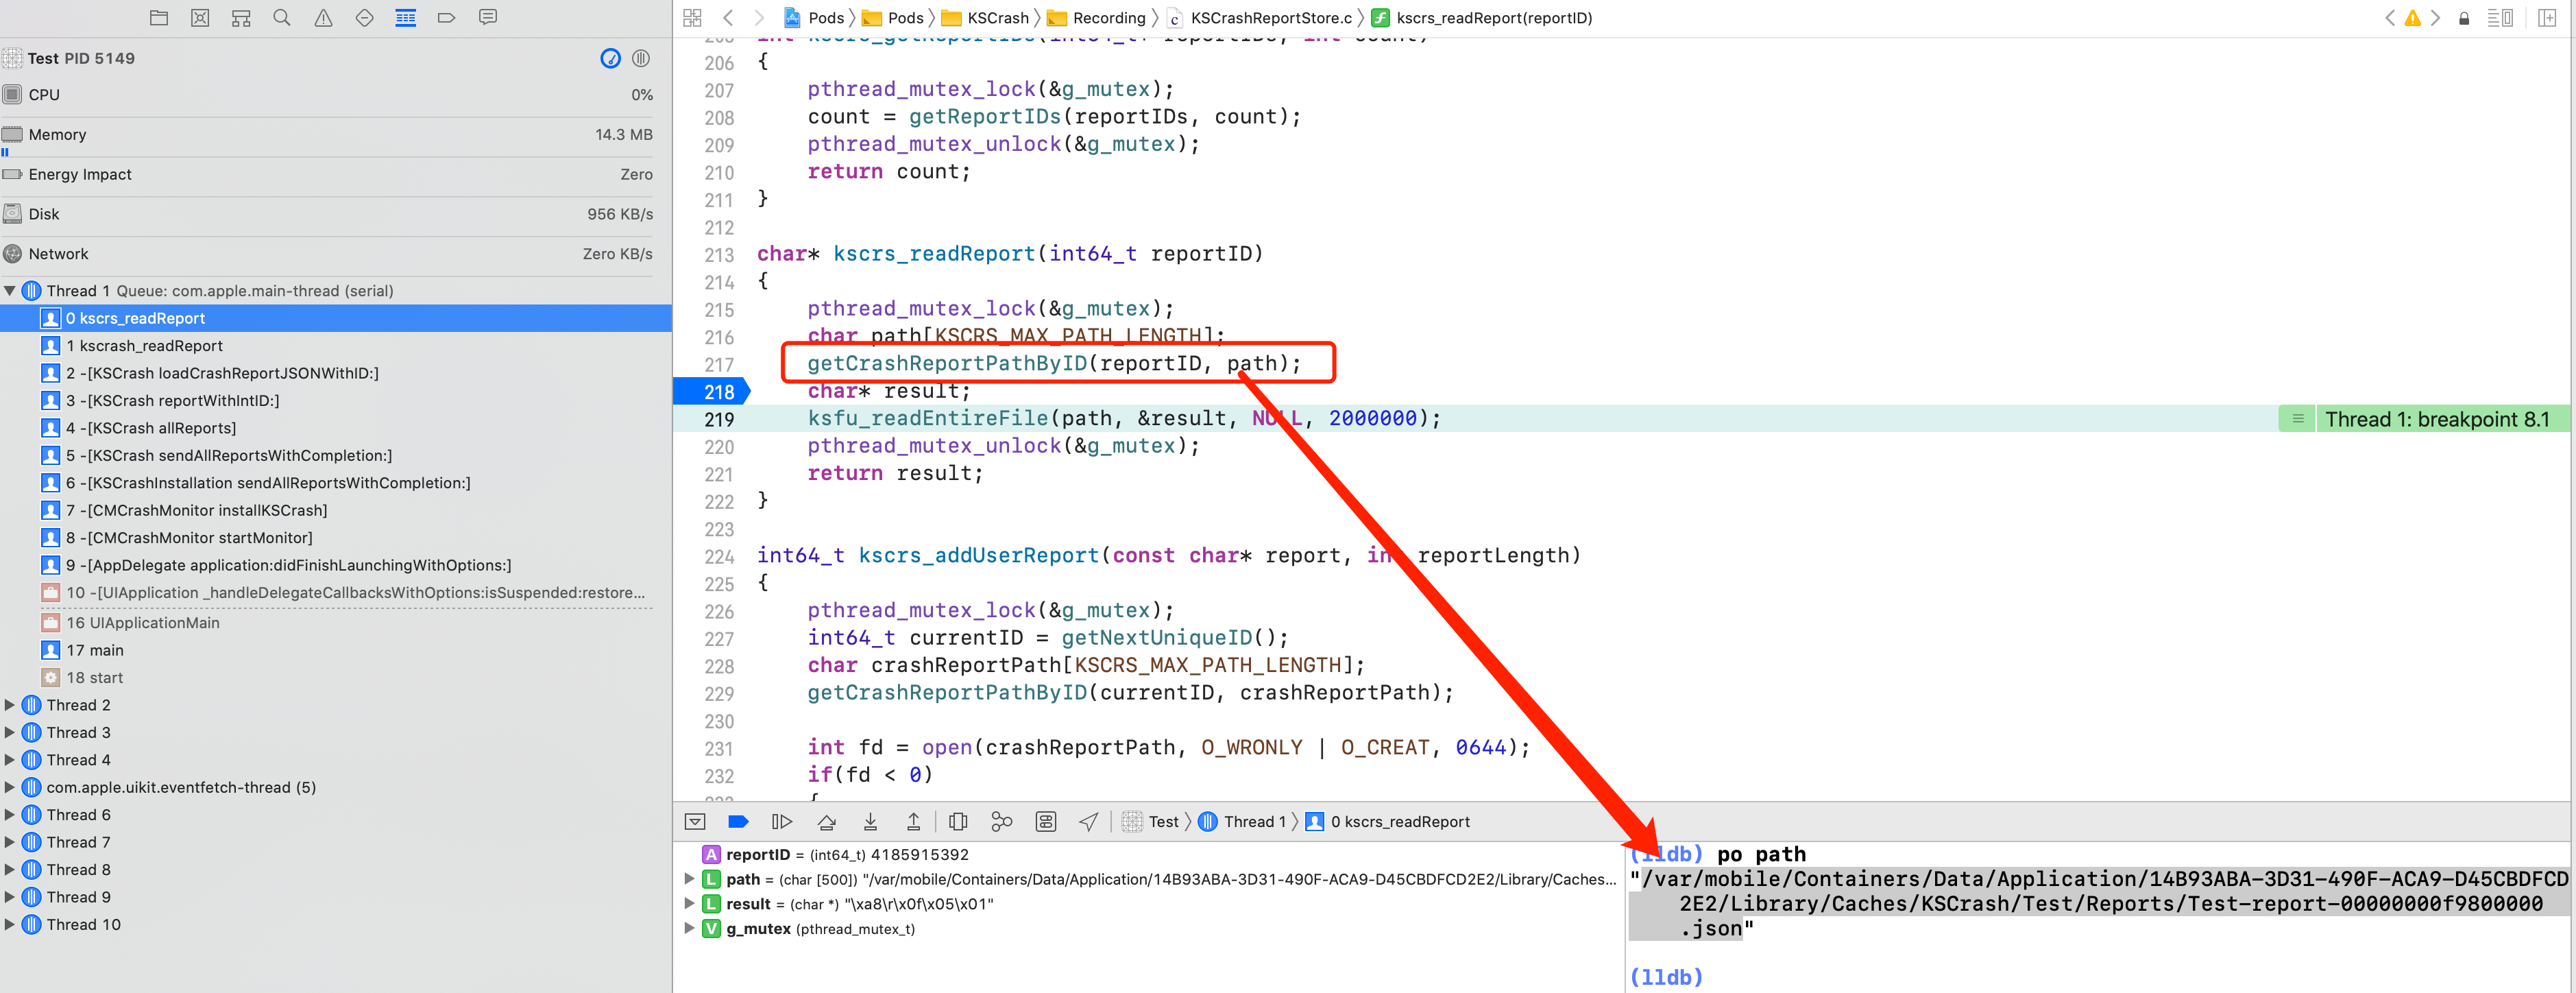
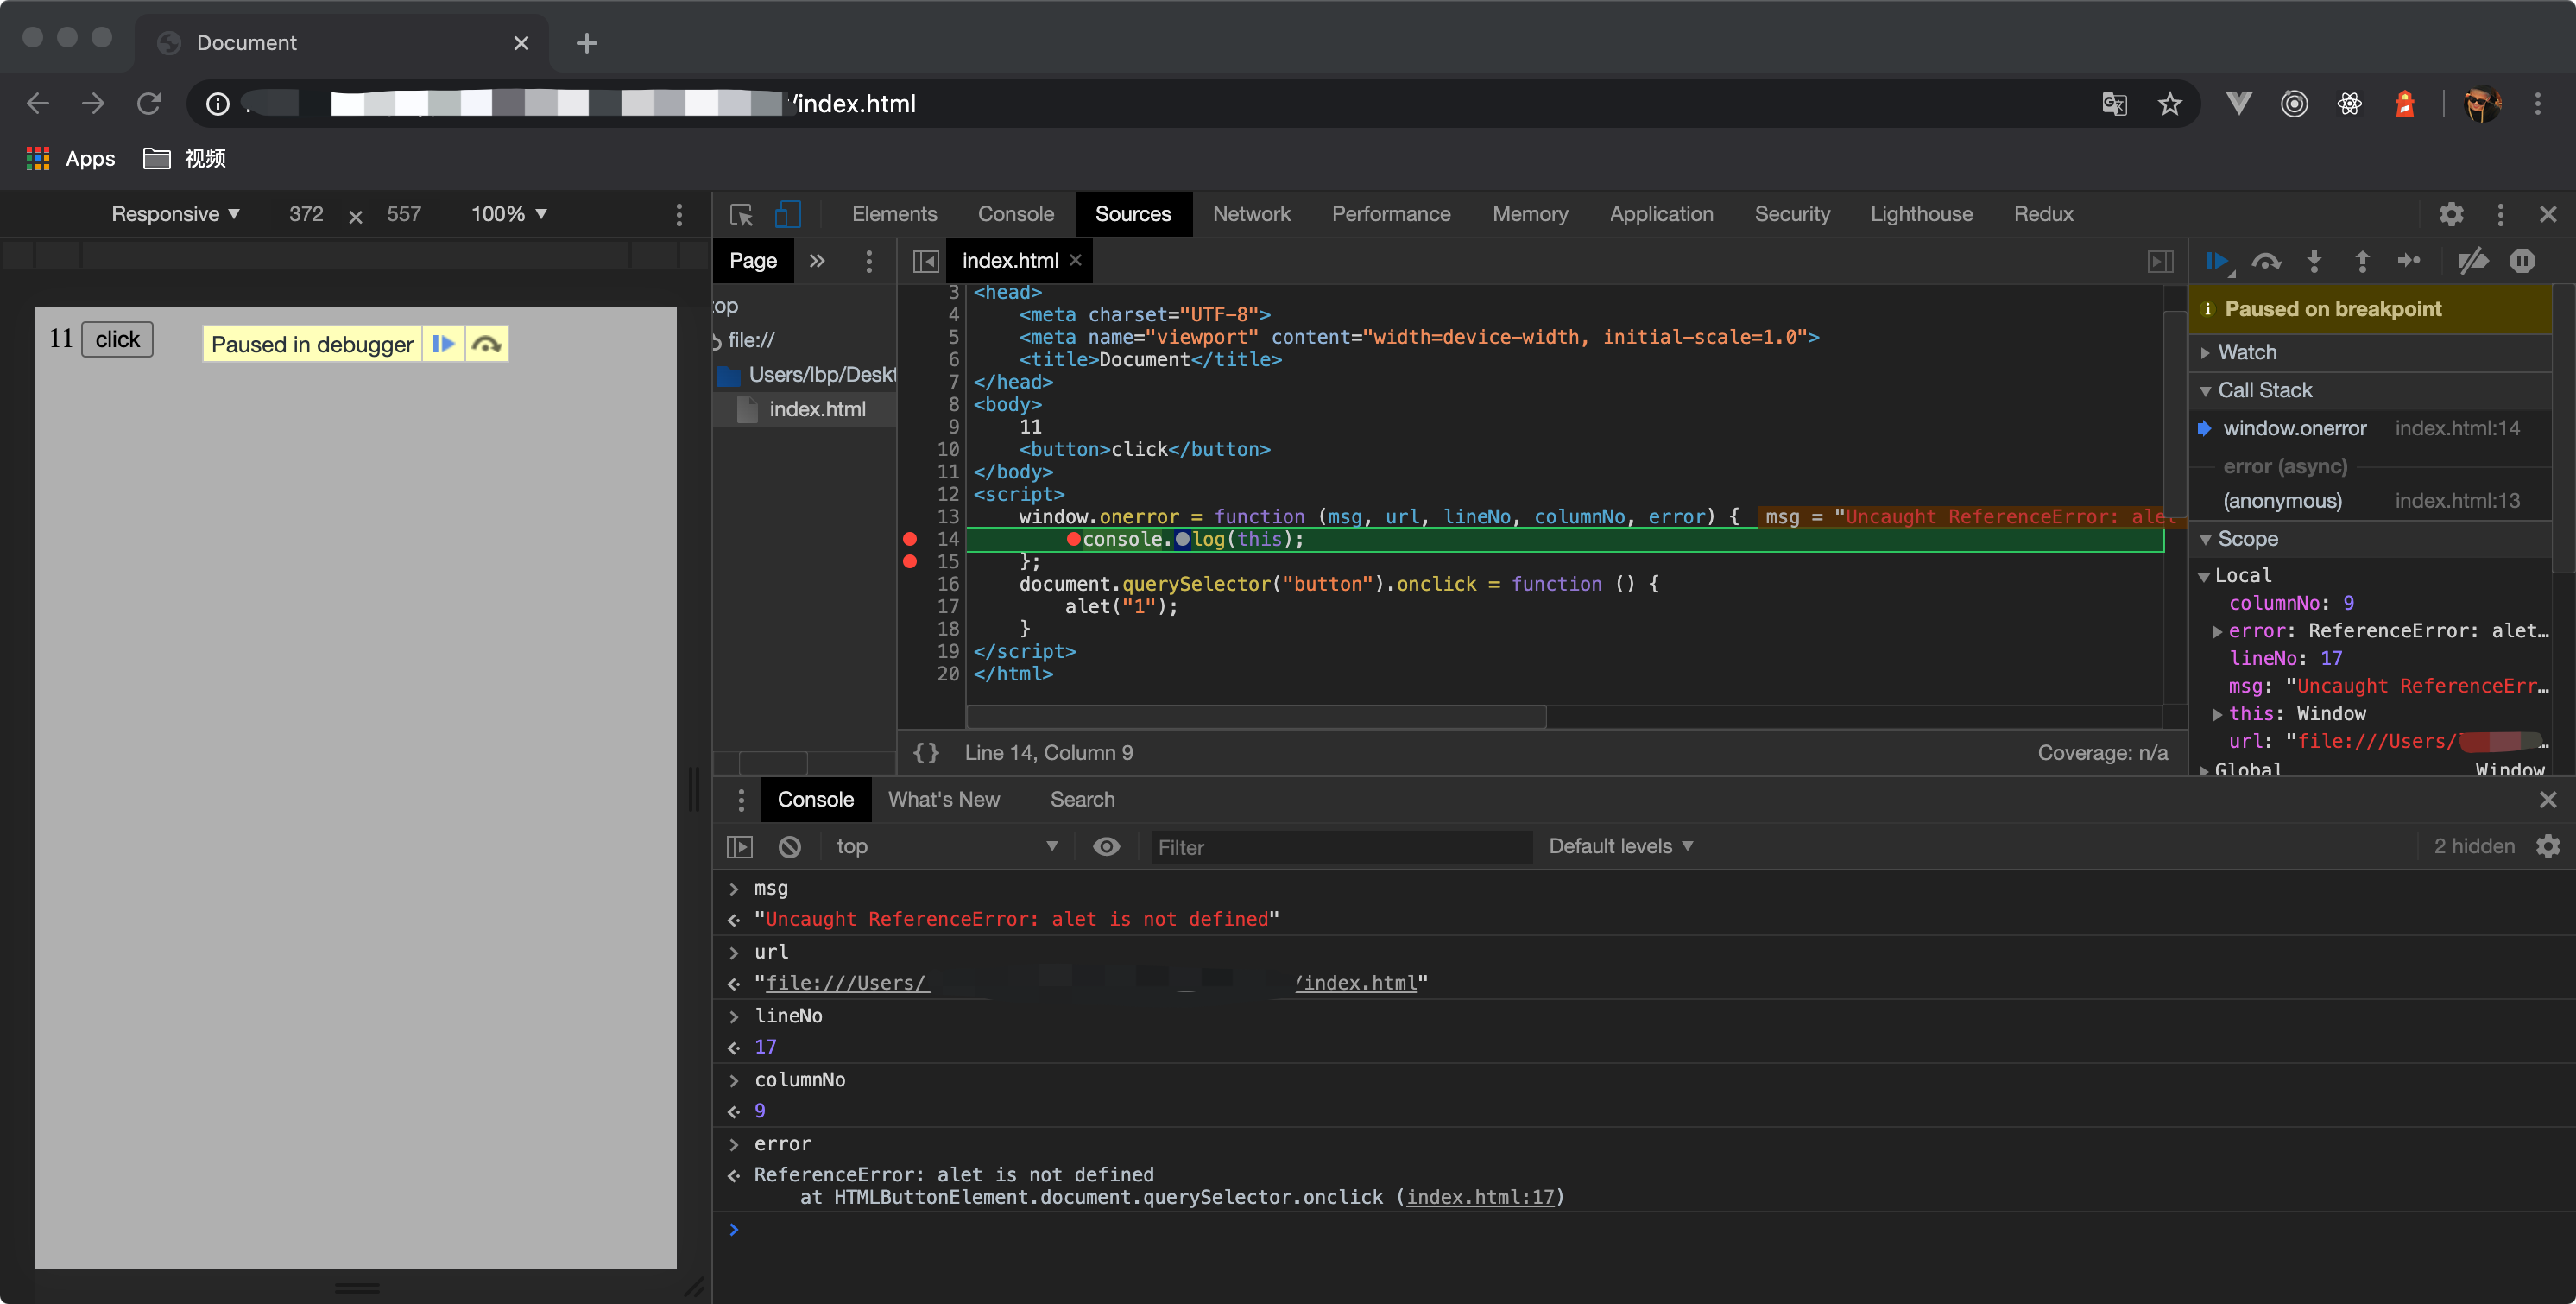
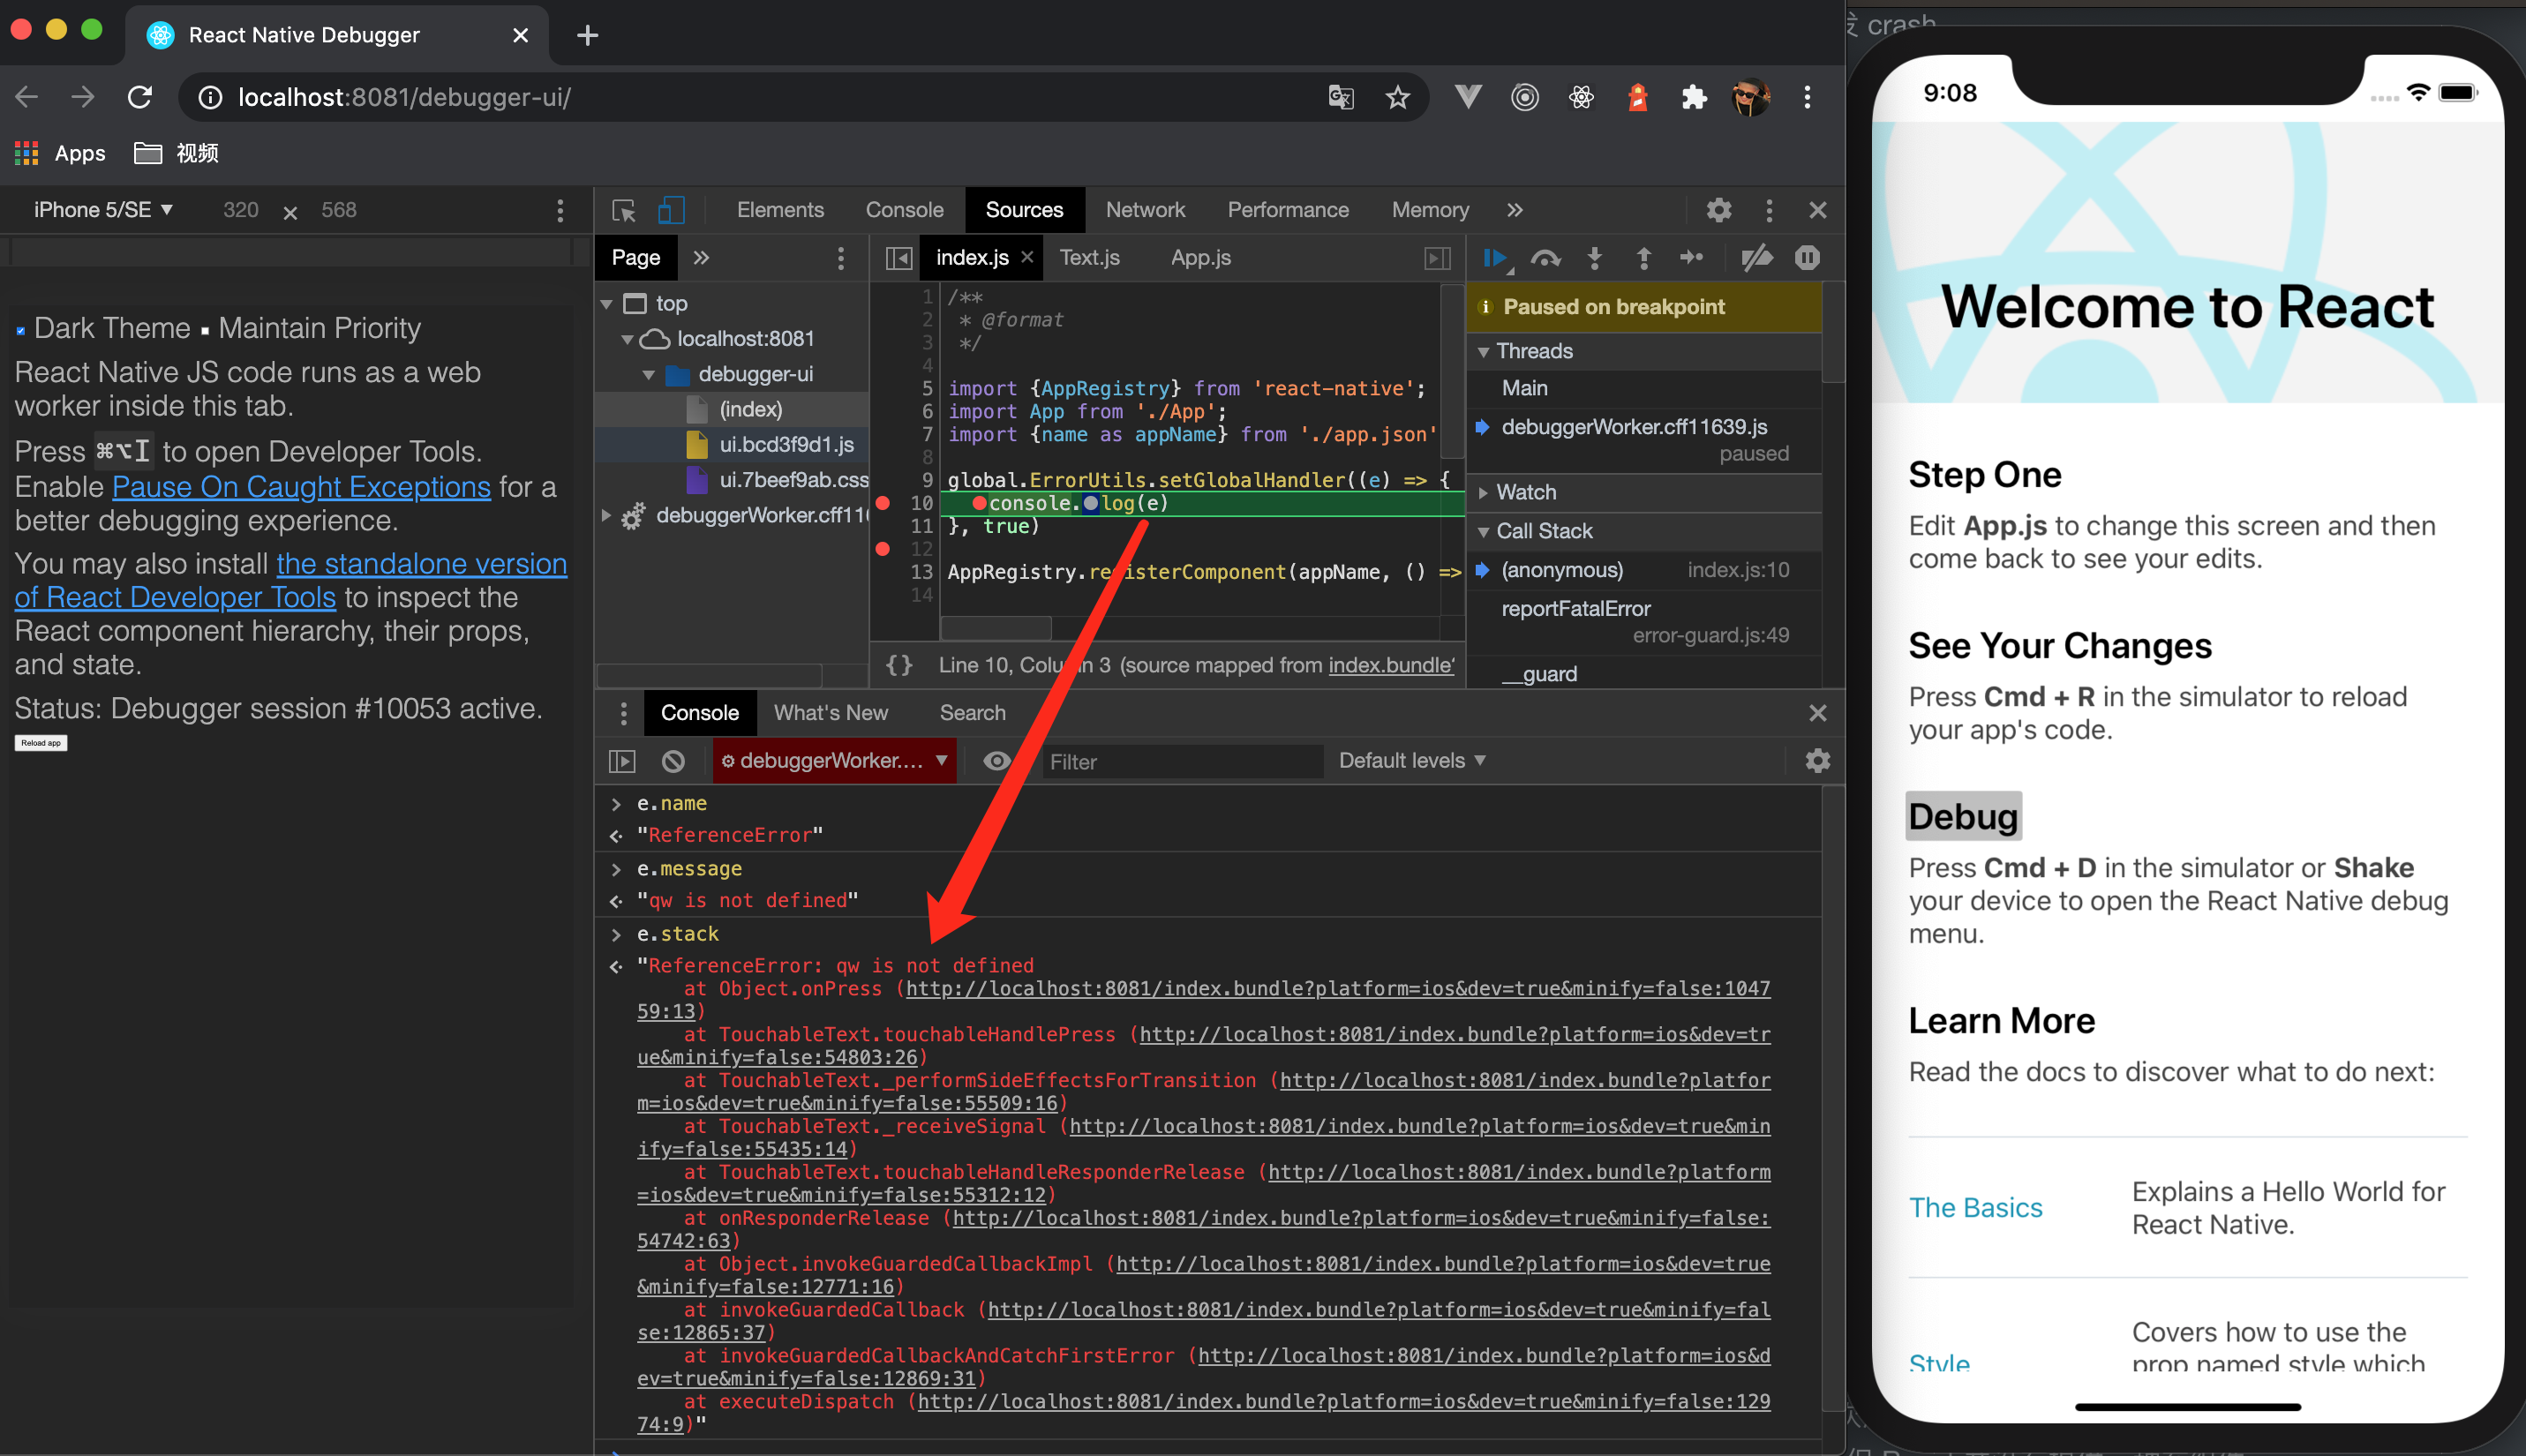
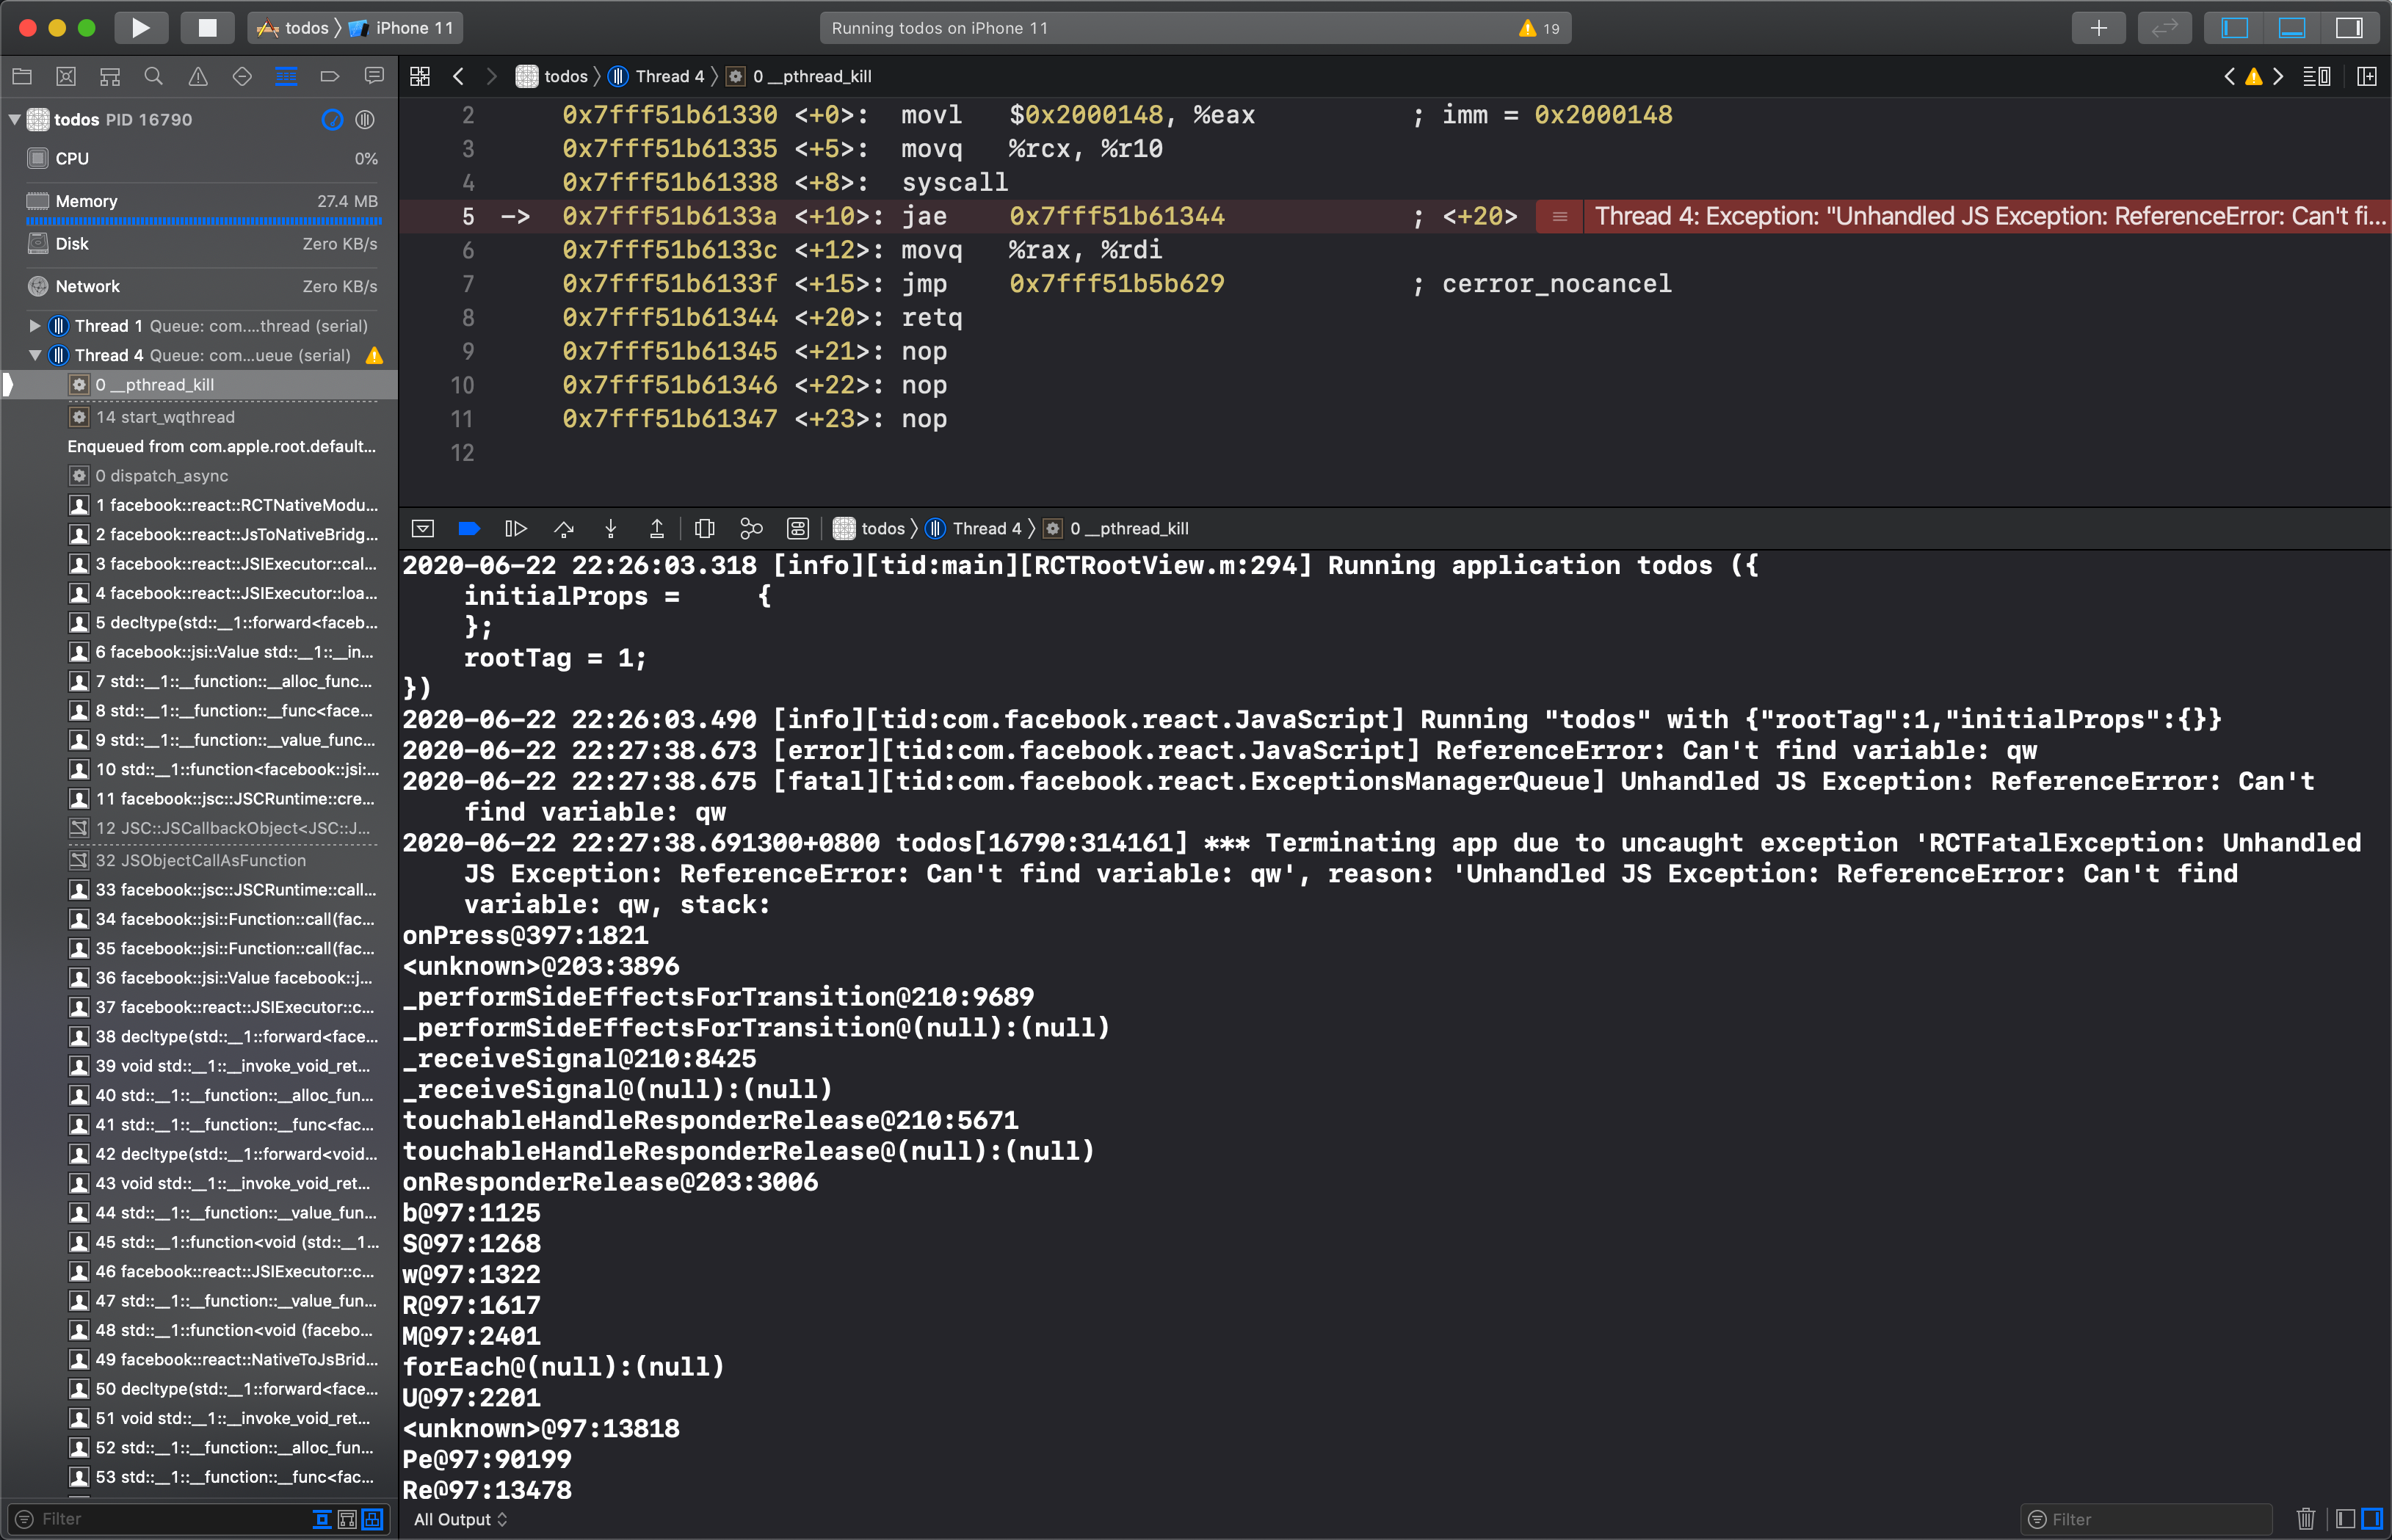
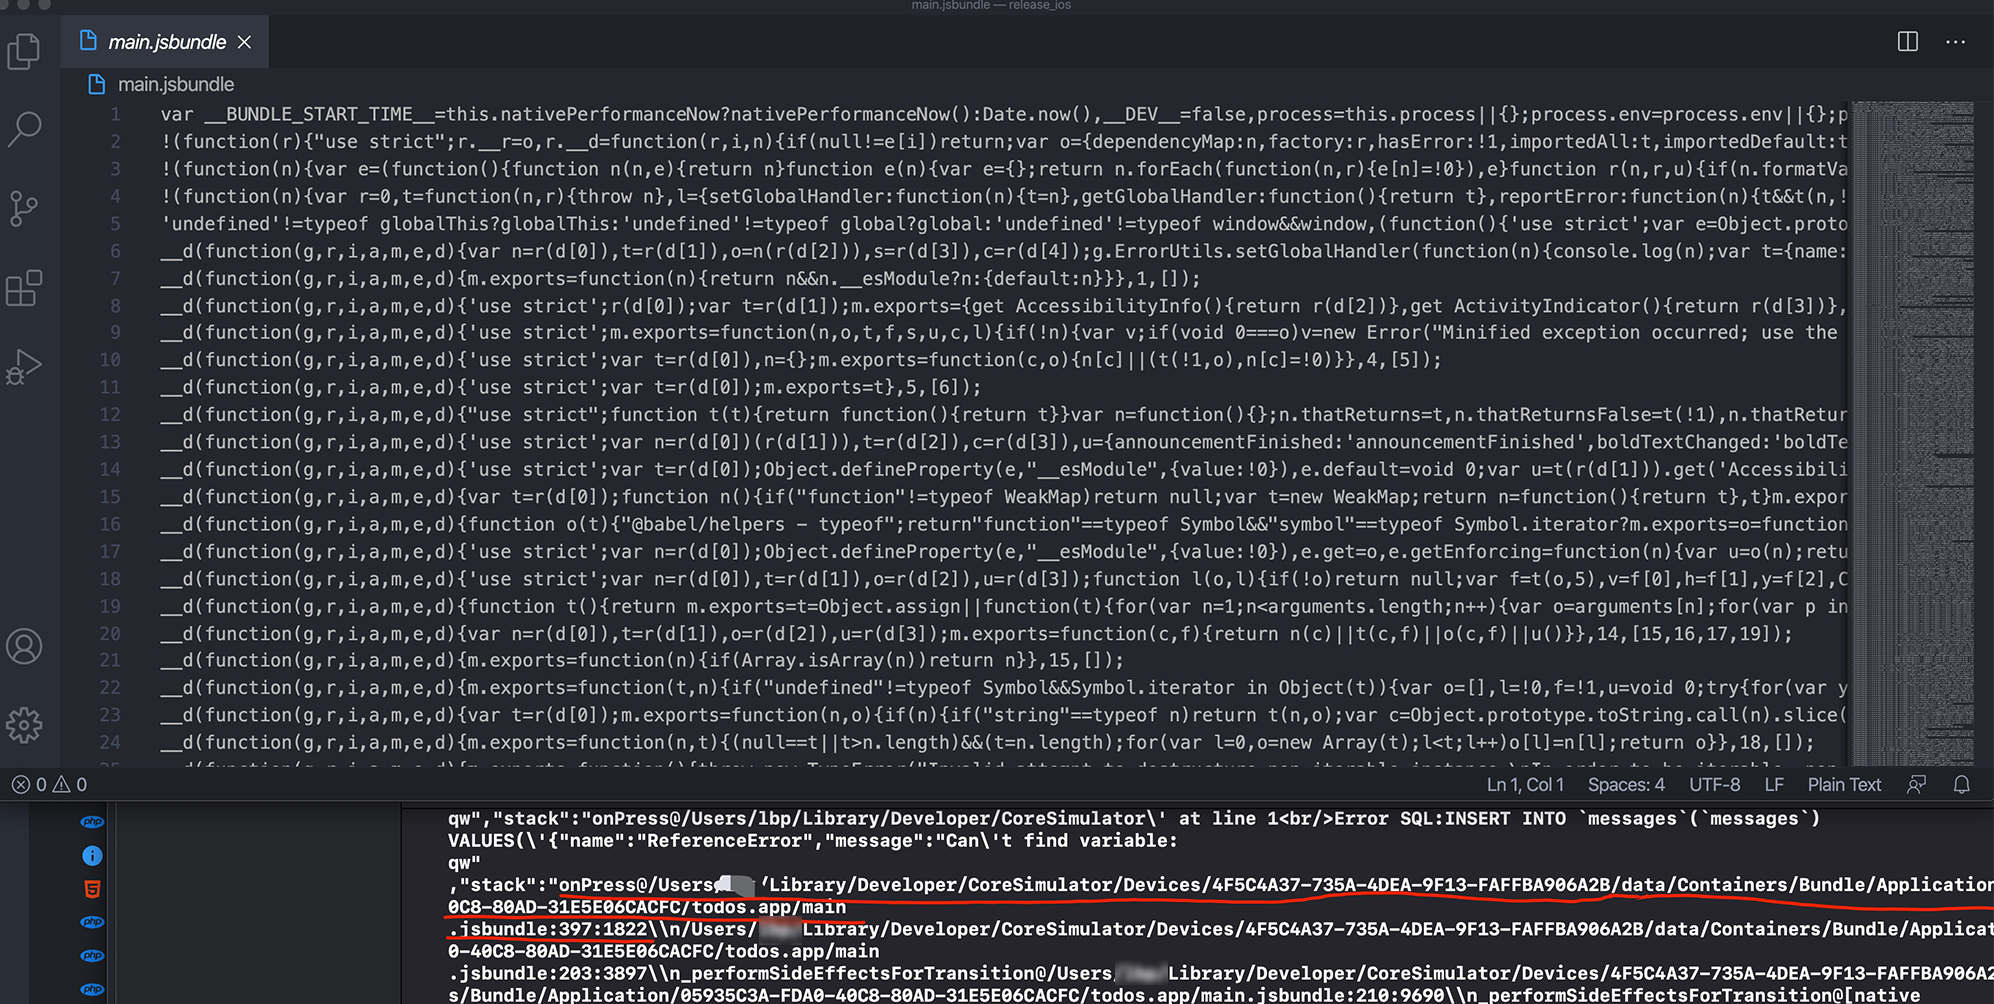
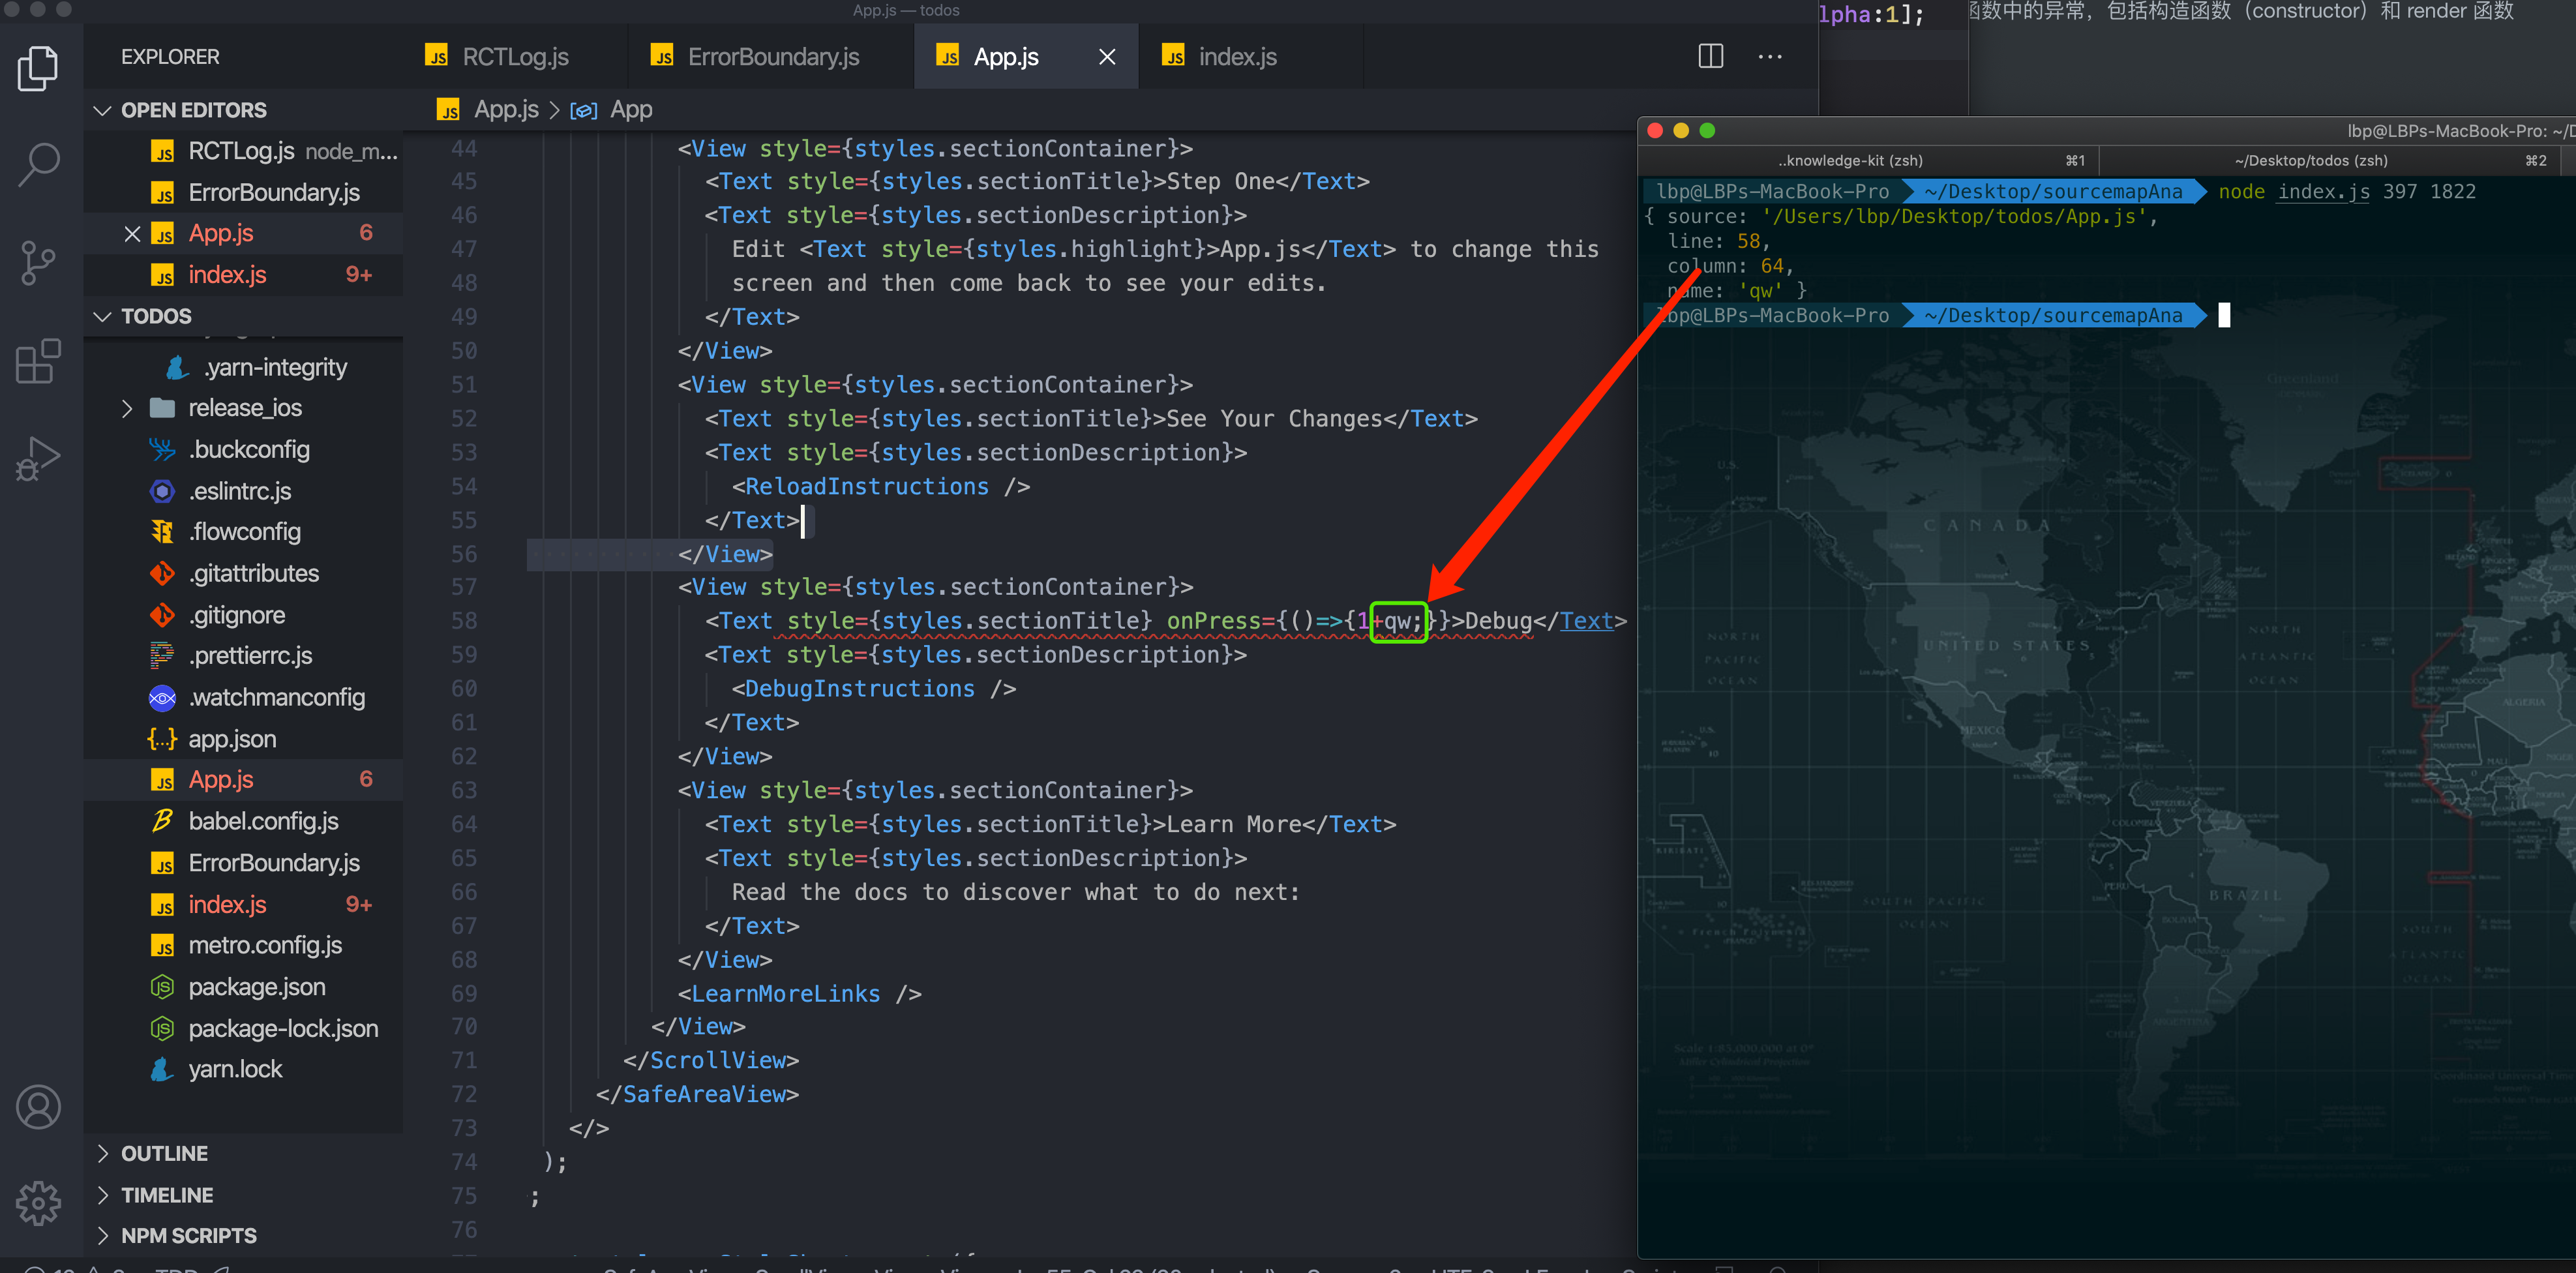
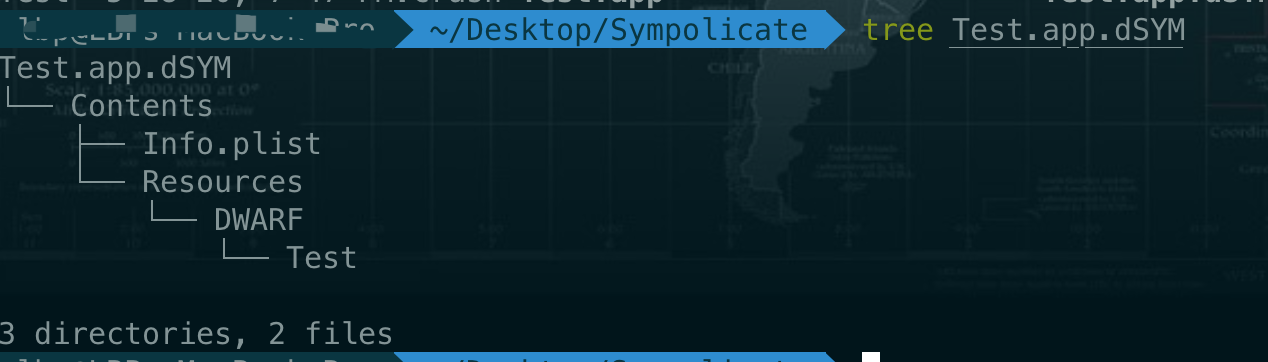
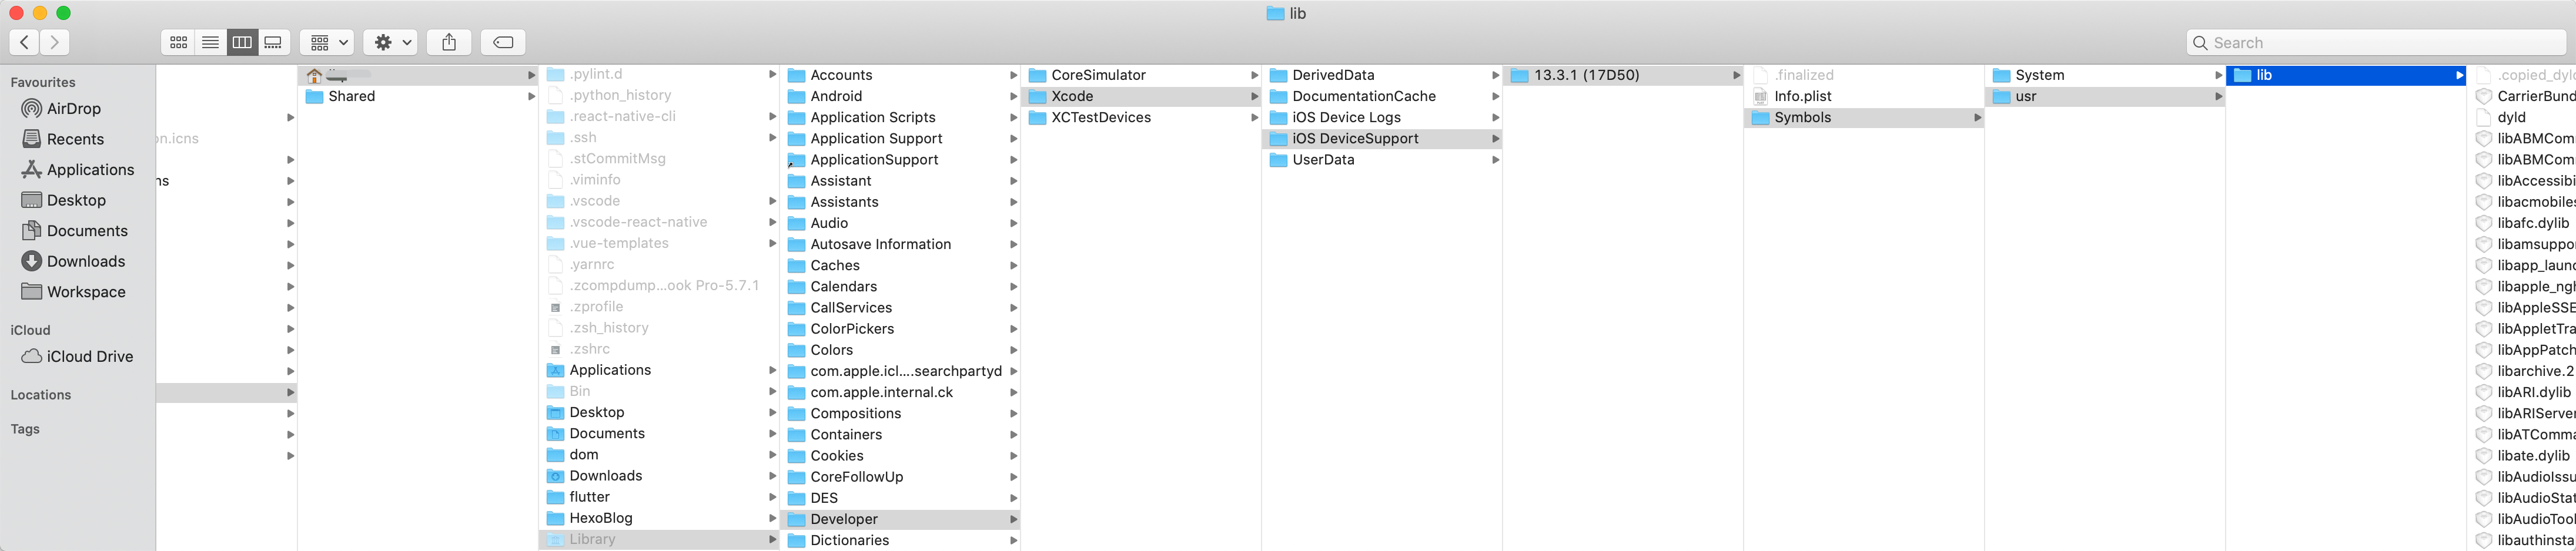
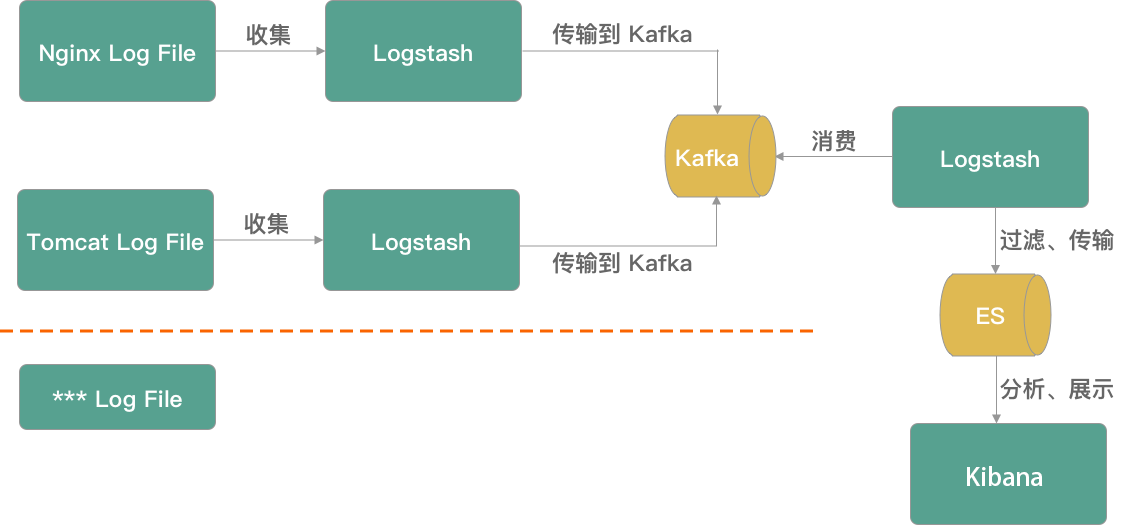
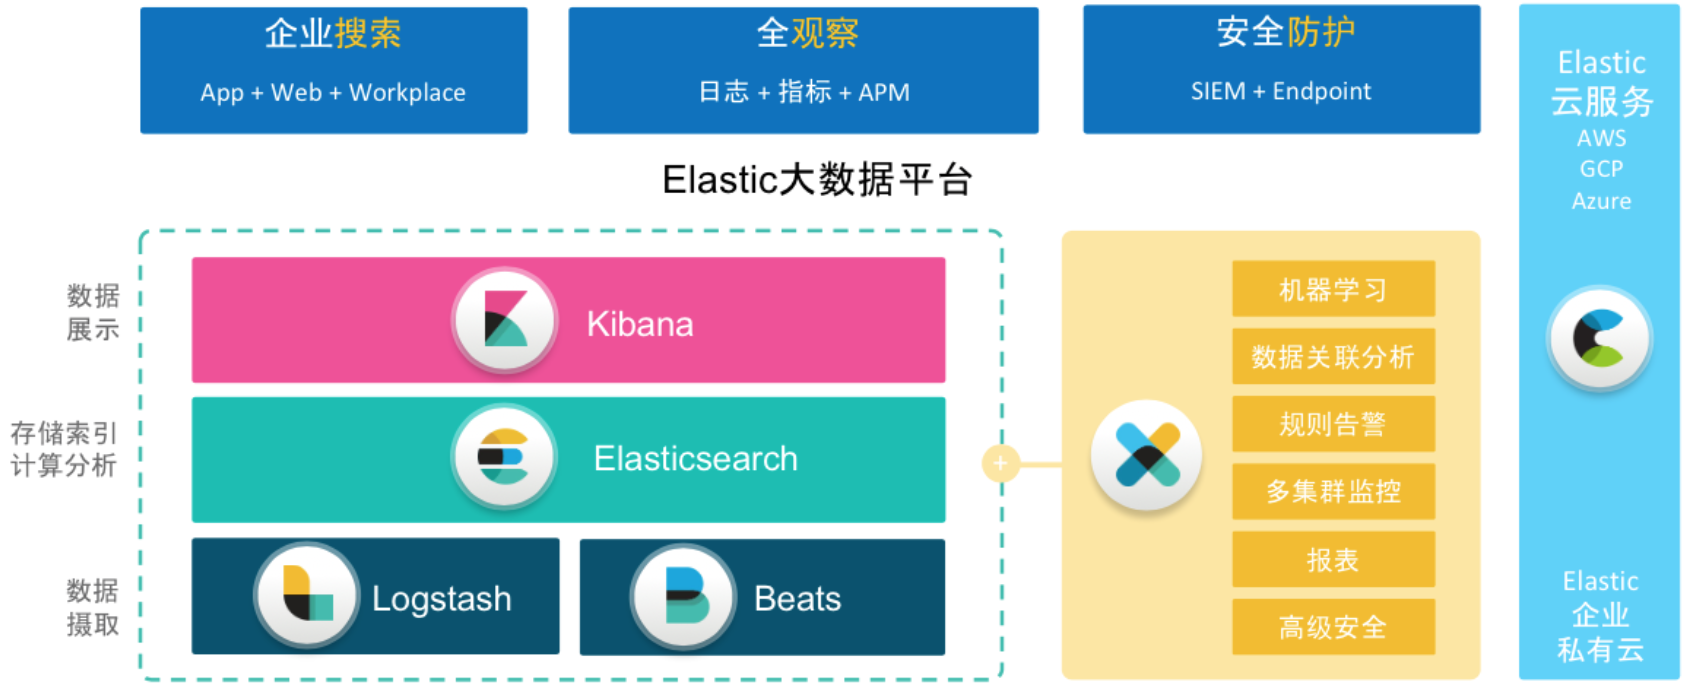
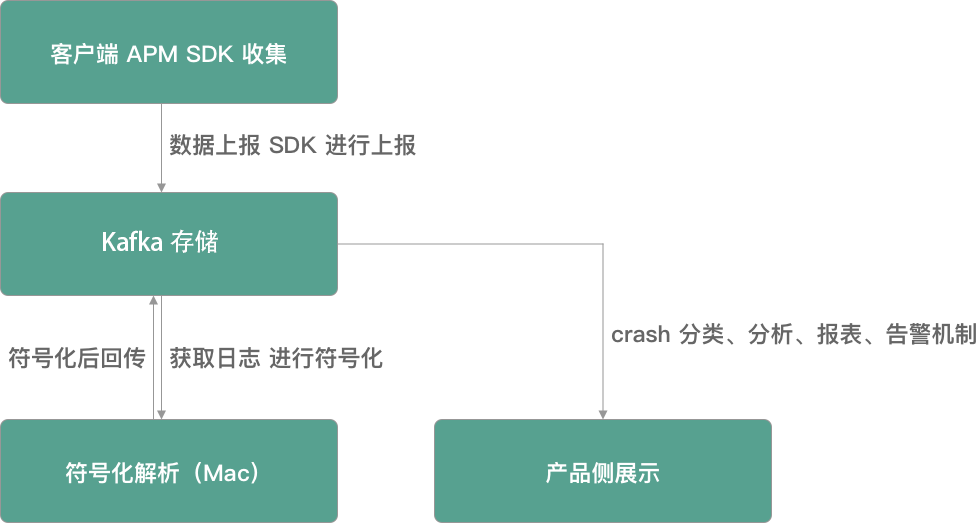
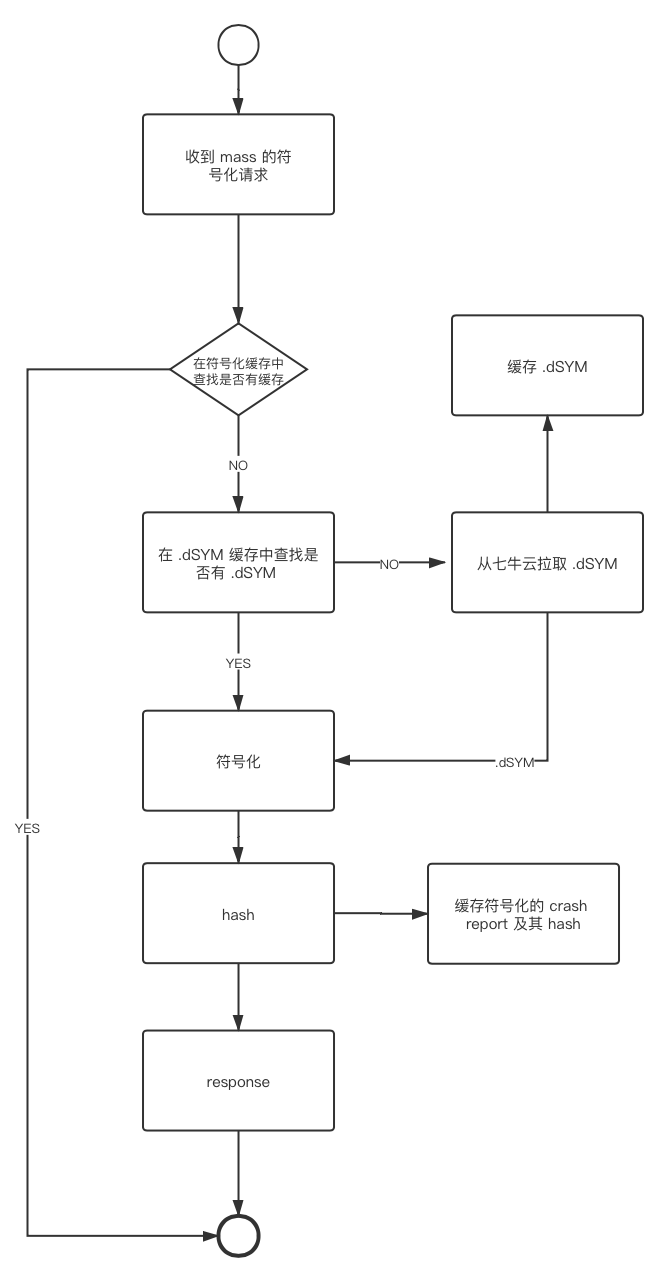 个阶段做能力的插入,所以可以在调用打包后在打包机上传 .dSYM 文件到七牛云存储(规则可以是以 AppName + Version 为 key,value 为 .dSYM 文件)。
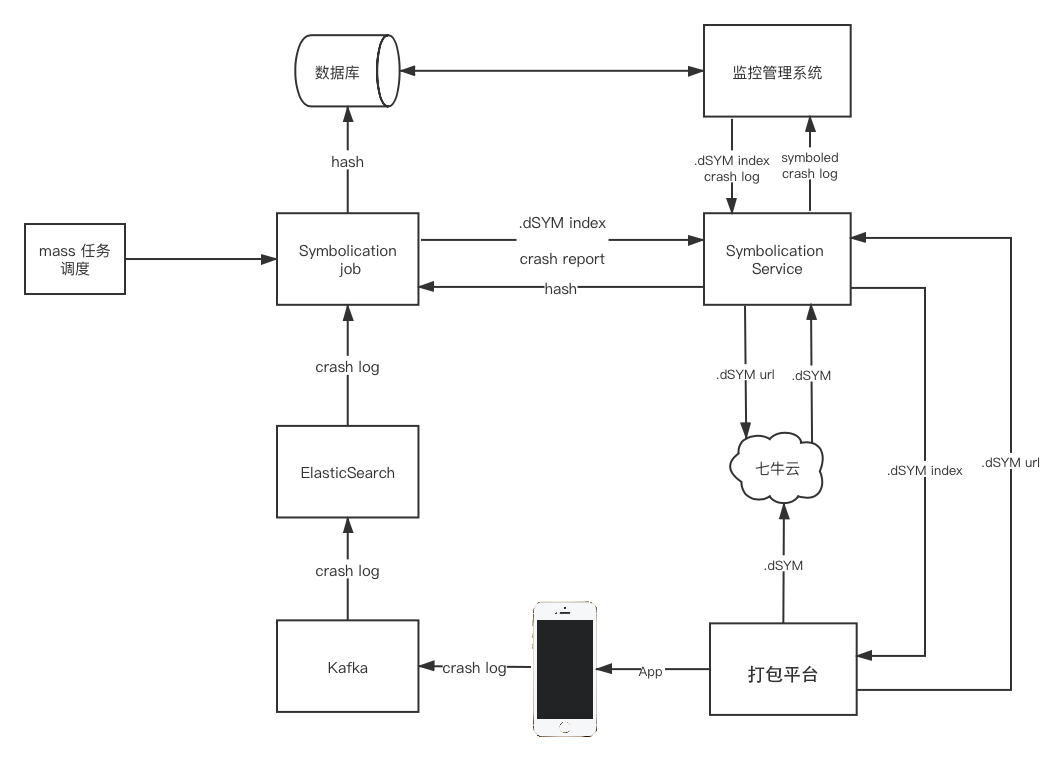 说明:
说明: