作者:来自 Elastic ISHLEEN KAUR
将 OpenTelemetry 与 Elastic Observability 相结合,形成应用程序和基础设施监控解决方案。
![]()
在 Elastic,我们最近决定全面采用 OpenTelemetry 作为首要的数据收集框架。作为一名可观察性工程师,我坚信供应商中立性对于为客户提供最大价值至关重要。通过致力于 OpenTelemetry,我们不仅紧跟技术进步,而且还推动技术进步。这项投资使我们处于行业前沿,倡导更开放、更灵活的可观察性方法。
Elastic 将 Elastic Common Schema (ECS) 捐赠给 OpenTelemetry,并积极致力于将其与语义约定融合。与此同时,我们致力于支持我们的用户,确保他们不必遵循不同的标准。我们的目标是在将 OpenTelemetry 与我们的应用程序和基础设施监控解决方案结合使用时提供无缝的端到端体验。这一承诺使用户能够毫无阻碍地享受两全其美的优势。
在这篇博客中,我们探讨如何使用 OpenTelemetry (OTel) 收集器从各种来源(例如 AWS EC2、Google Compute、Kubernetes 集群以及运行 Linux 或 MacOS 的单个系统)捕获核心系统指标。
使用两种采集路径为基础设施 UI 提供支持
希望使用 OpenTelemetry 作为数据收集机制的 Elastic 用户现在可以使用 Elastic Observability 中提供的主机和库存 UI 来监控部署了 OpenTelemetry 收集器的主机的运行状况。
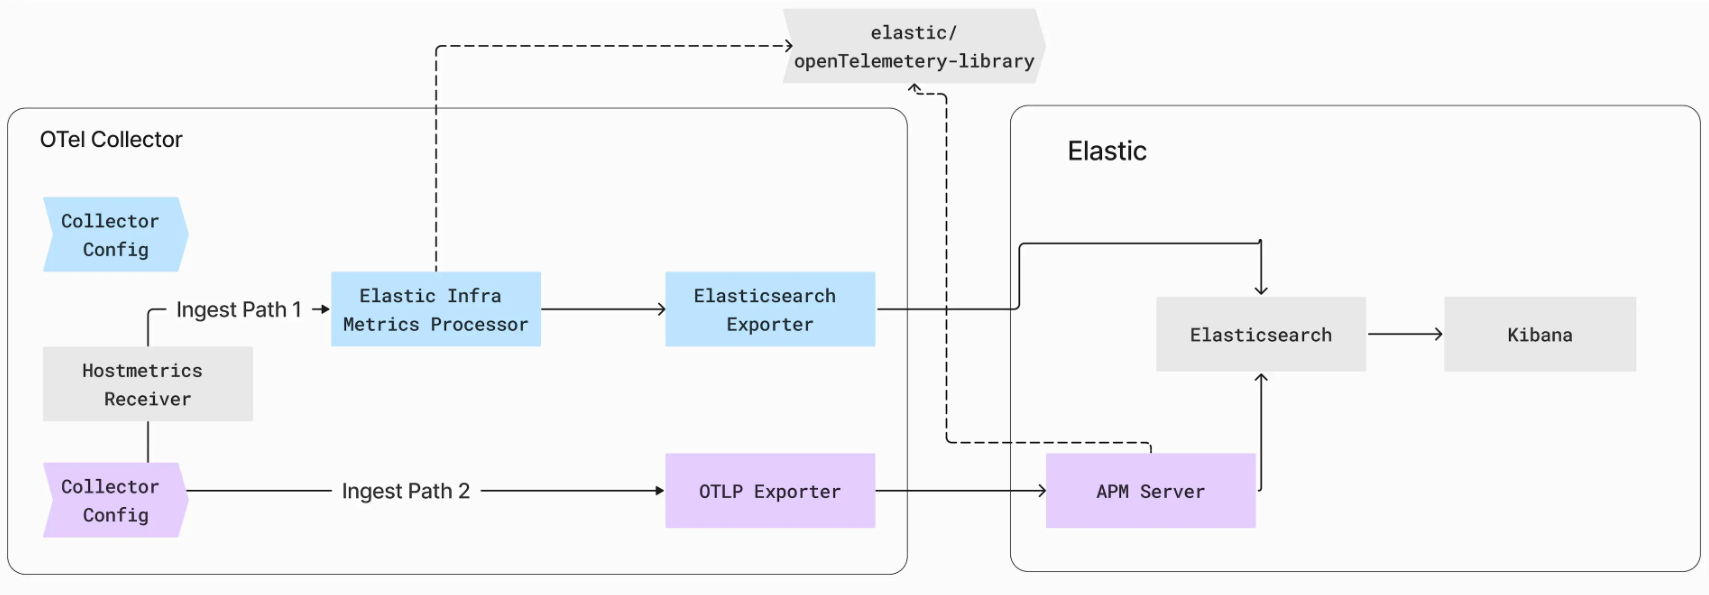
Elastic 提供了两种不同的采集路径来为基础设施 UI 提供支持:ElasticsearchExporter 采集路径和 OTLP Exporter 采集路径。
![]()
ElasticsearchExporter 采集路径:
Opentelmetry 中的 hostmetrics 接收器从 OTel 模式中的主机收集系统级指标,例如 CPU、内存和磁盘使用情况。ElasticsearchExporter 采集路径利用 Hostmetrics 接收器在 OTel 模式中生成主机指标。我们开发了 ElasticInfraMetricsProcesor,它利用 opentlemetry-lib 将这些指标转换为 Elastic UI 可以理解的格式。
例如,system.network.io OTel 指标包含一个 direction 属性,其值为 receive 或 transmit。它们分别对应于 Elastic 中的 system.network.in.bytes 和 system.network.out.bytes。
然后,processor 将这些指标转发到 Elasticsearch Exporter,现在已增强以支持在 ECS 模式下导出指标。导出器将指标发送到 Elasticsearch 端点,用富有洞察力的数据点亮基础设施 UI。
要利用此路径,你可以从此处提供的 Elastic Collector Distro 部署收集器。
此摄取路径的收集器配置示例:
receivers:
  hostmetrics:
    collection_interval: 10s
    scrapers:
      cpu:
        metrics:
          system.cpu.utilization:
            enabled: true
          system.cpu.logical.count:
            enabled: true
      memory:
        metrics:
          system.memory.utilization:
            enabled: true
      process:
        metrics:
          process.open_file_descriptors:
            enabled: true
          process.memory.utilization:
            enabled: true
          process.disk.operations:
            enabled: true
      network:
      processes:
      load:
      disk:
      filesystem:

processors:
  resourcedetection/system:
    detectors: ["system", "ec2"]
  elasticinframetrics:

exporters:
  logging:
    verbosity: detailed
  elasticsearch/metrics:
    endpoints: <elasticsearch_endpoint>
    api_key: <api_key>
    mapping:
      mode: ecs

service:
  pipelines:
    metrics/host:
      receivers: [hostmetrics]
      processors: [resourcedetection/system, elasticinframetrics]
      exporters: [logging, elasticsearch/ metrics]
对于喜欢使用自定义 Elastic Collector Distro 的用户来说,Elastic 导出器路径是理想之选。此路径包括 Elasticinframetrics 处理器,它通过 Elasticsearch 导出器将数据发送到 Elasticsearch。
OTLP 导出器采集路径:
在 OTLP 导出器采集路径中,hostmetrics 接收器以 OTel Schema 从主机收集系统级指标,例如 CPU、内存和磁盘使用情况。这些指标被发送到 OTLP 导出器,后者将它们转发到 APM 服务器端点。APM 服务器使用相同的 opentelemetry-lib 将这些指标转换为与 Elastic UI 兼容的格式。随后,APM 服务器将指标推送到 Elasticsearch,为基础设施 UI 提供支持。
APM 采集路径的示例收集器配置
receivers:
  hostmetrics:
    collection_interval: 10s
    scrapers:
      cpu:
        metrics:
          system.cpu.utilization:
            enabled: true
          system.cpu.logical.count:
            enabled: true
      memory:
        metrics:
          system.memory.utilization:
            enabled: true
      process:
        metrics:
          process.open_file_descriptors:
            enabled: true
          process.memory.utilization:
            enabled: true
          process.disk.operations:
            enabled: true
      network:
      processes:
      load:
      disk:
      filesystem:

processors:
  resourcedetection/system:
    detectors: ["system"]
    system:
      hostname_sources: ["os"]

exporters:
  otlphttp:
    endpoint: <mis_endpoint>
    tls:
      insecure: false
    headers:
      Authorization: <api_key_>
  logging:
    verbosity: detailed

service:
  pipelines:
    metrics/host:
      receivers: [hostmetrics]
      processors: [resourcedetection/system]
      exporters: [logging, otlphttp]
OTLP Exporter Ingest 路径可以帮助已经使用 Elastic APM 并希望看到基础设施 UI 填充的现有用户。这些用户可以使用默认的 OpenTelemetry Collector。
基础设施 UI 概览
基础设施 UI 展示了主机和 Kubernetes 级别的视图。以下是一些 UI 概览
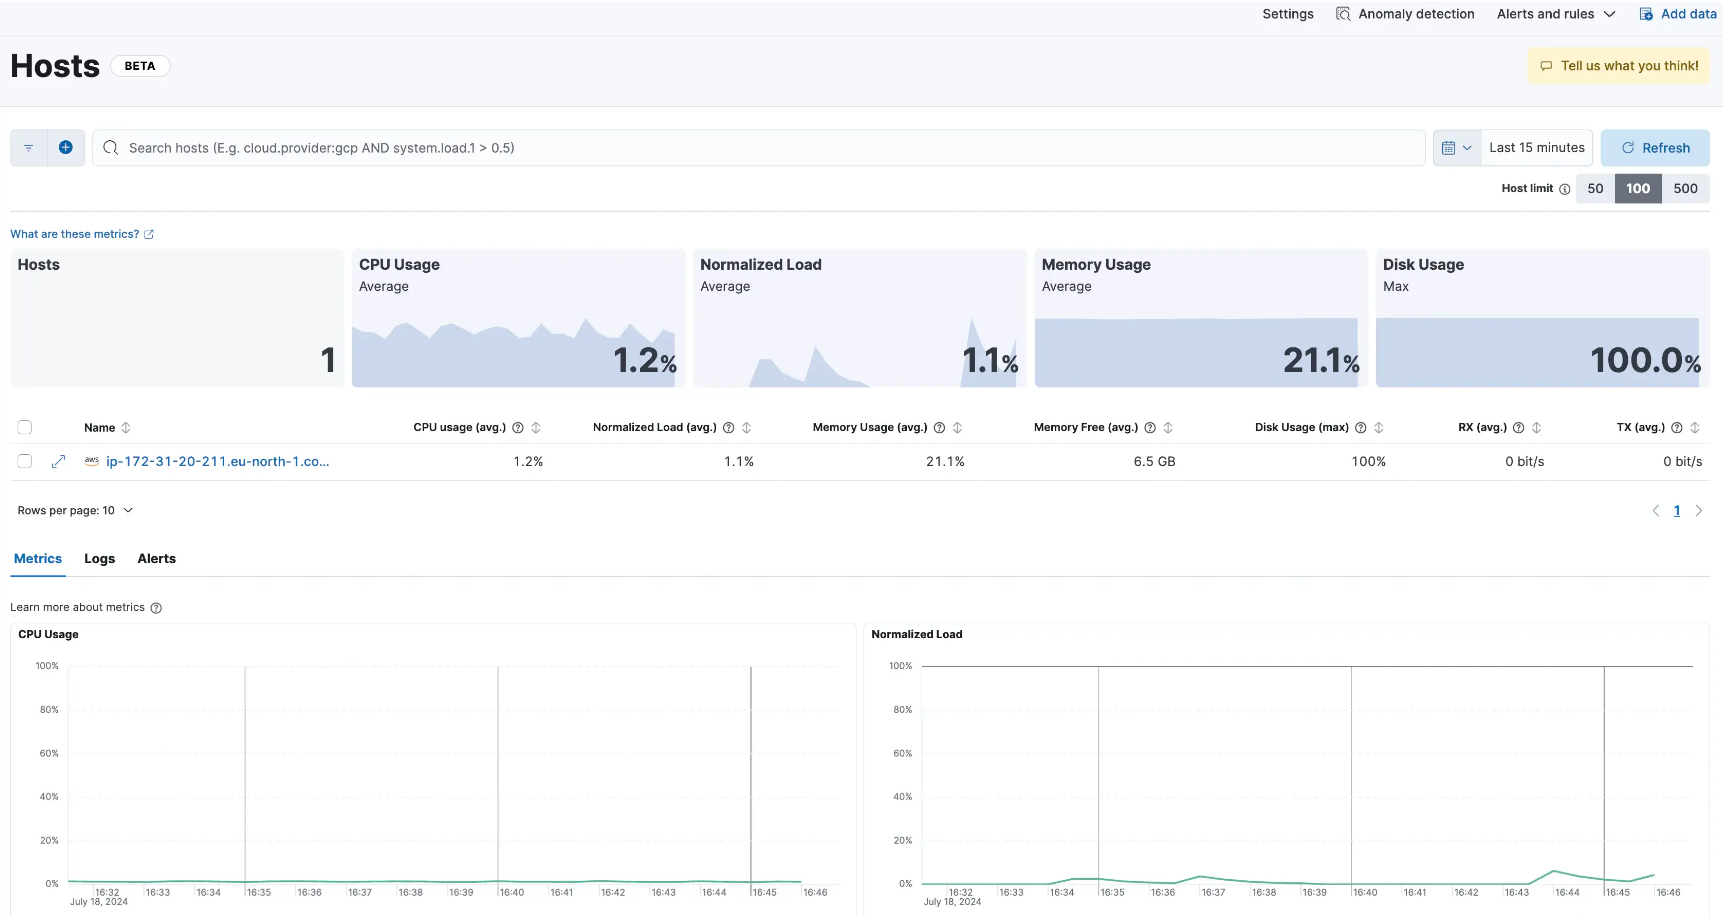
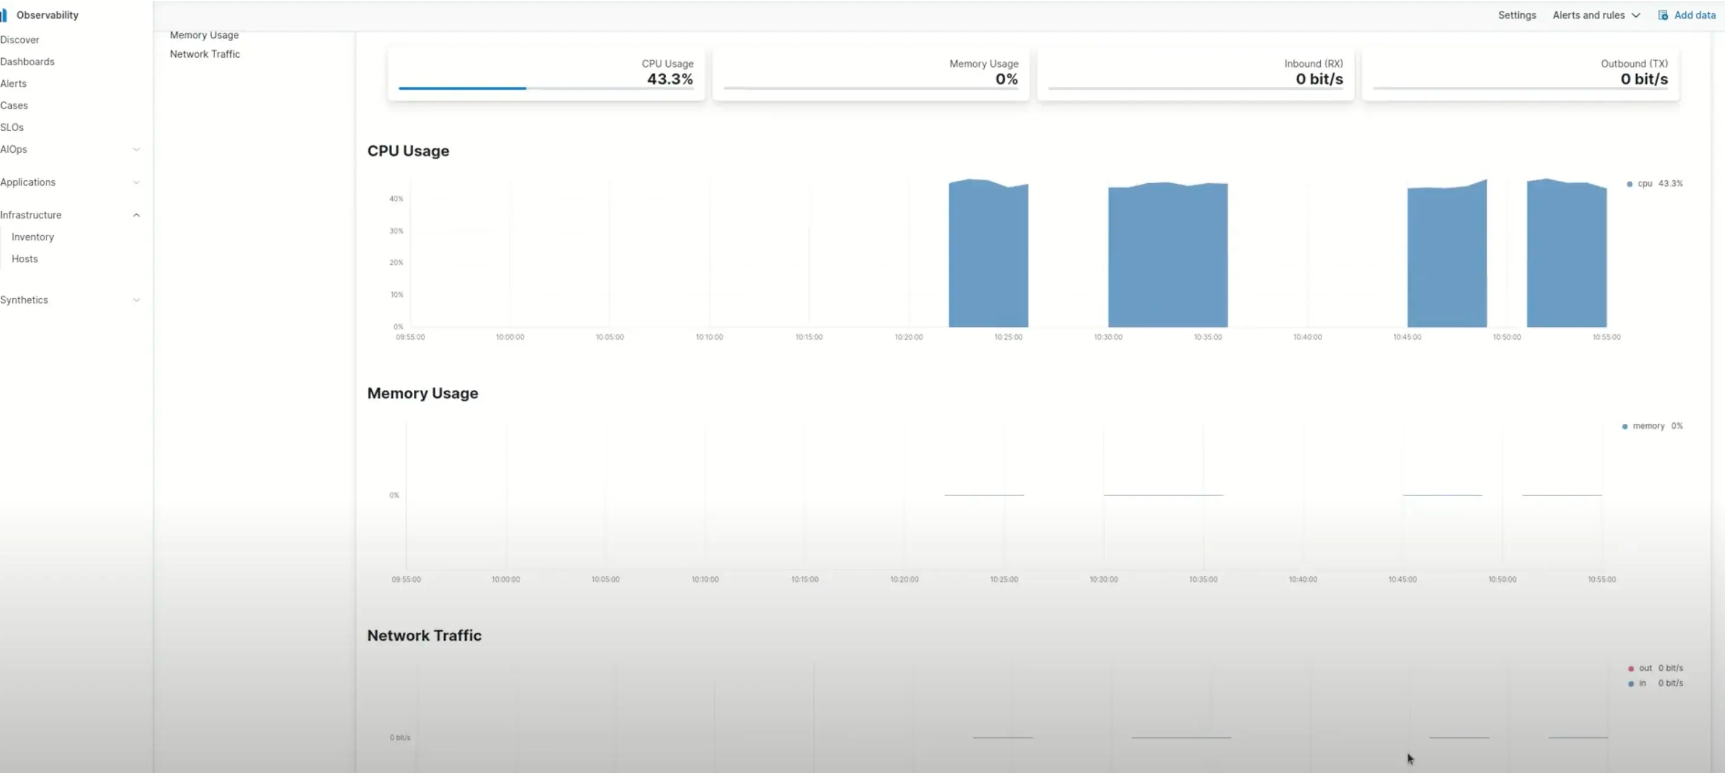
主机概览 UI
![]()
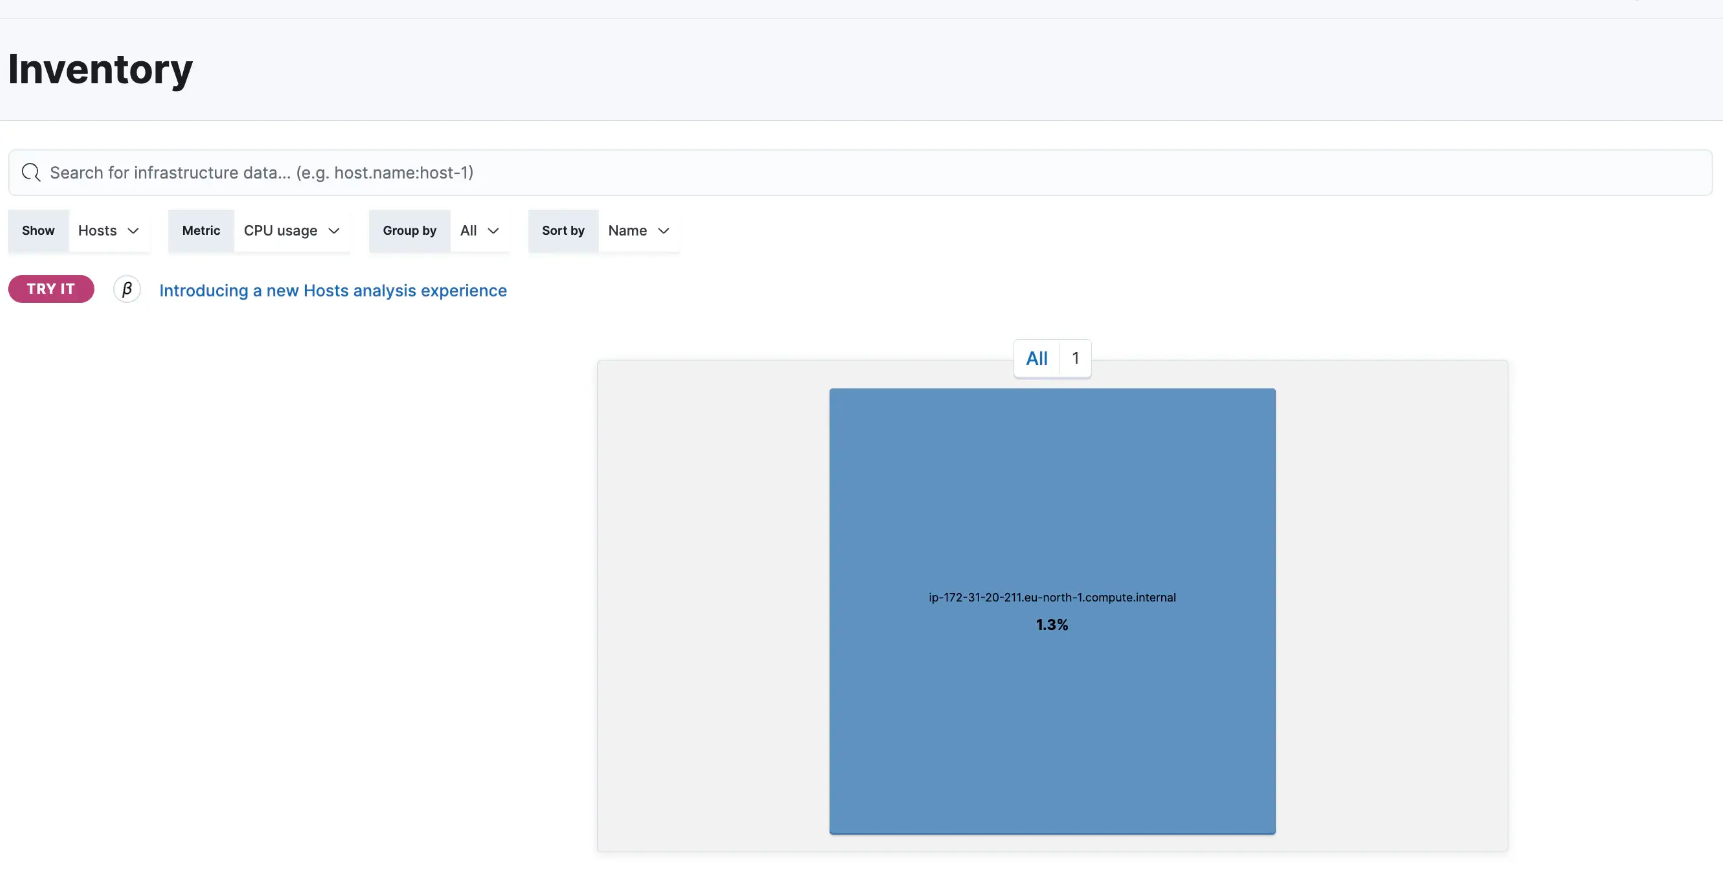
主机库存 UI
![]()
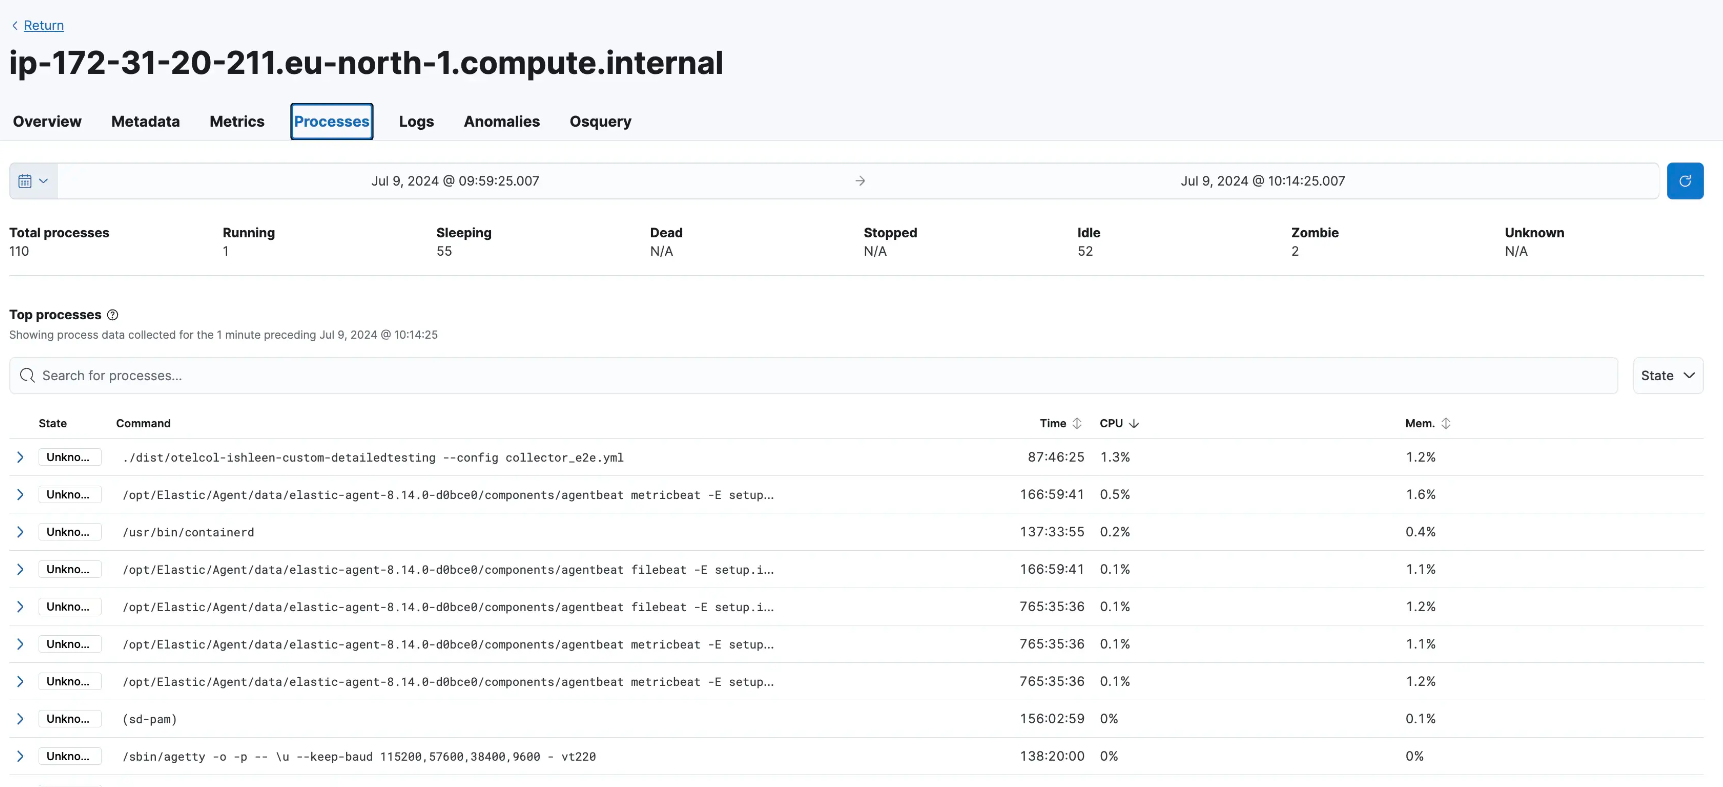
主机进程相关详细信息
![]()
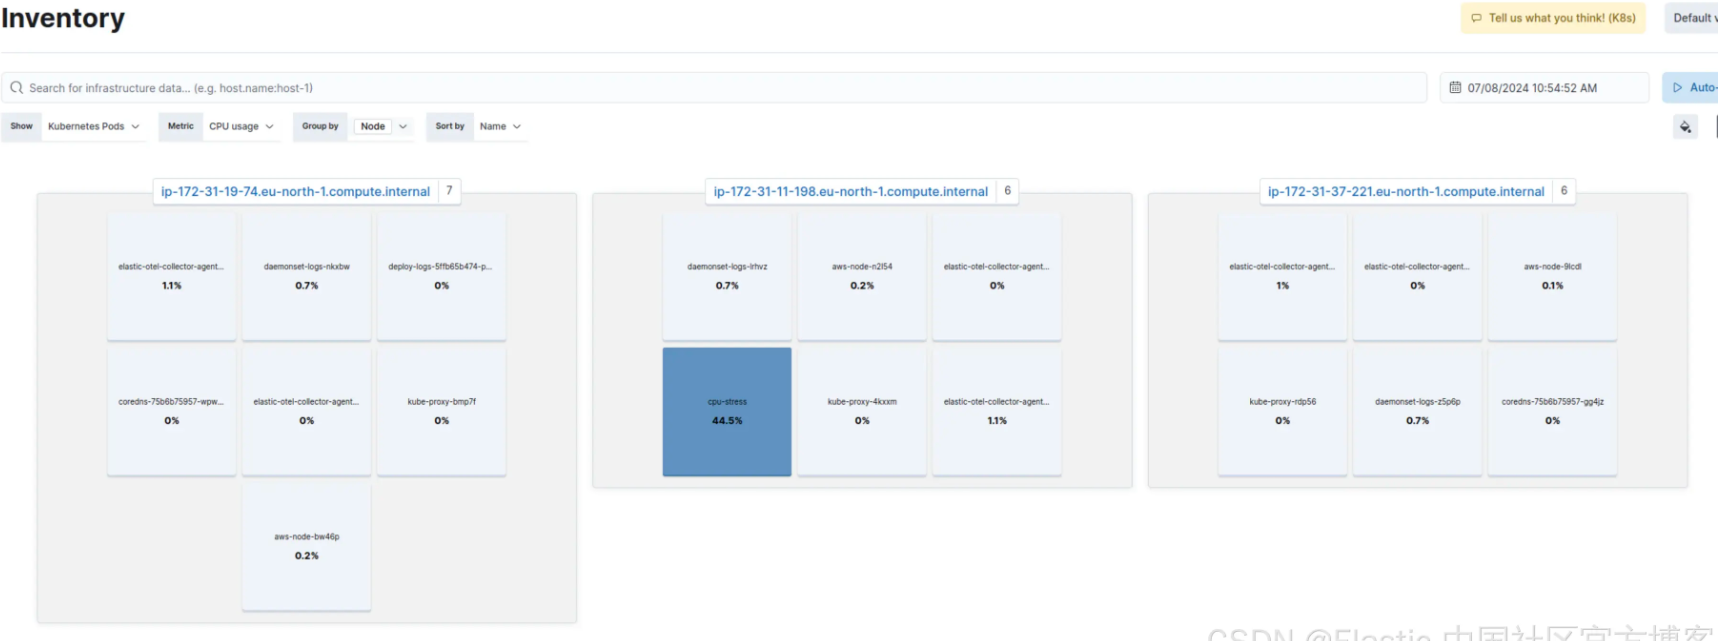
Kubernetes Inventory UI
![]()
Pod 级别指标
![]()
我们的下一步是创建由原生 OTel 数据驱动的基础设施 UI,并使用在此原生数据上运行的专用 OTel 仪表板。
结论
Elastic 与 OpenTelemetry 的集成简化了可观察性环境,虽然我们正在努力使 ECS 与 OpenTelemetry 的语义约定保持一致,但我们的当务之急是通过简化用户体验来支持用户。通过这种额外的支持,我们的目标是为使用 OpenTelemetry 和我们的应用程序和基础设施监控解决方案的用户提供无缝的端到端体验。我们很高兴看到我们的用户将如何利用这些功能来更深入地了解他们的系统。
原文:Infrastructure monitoring with OpenTelemetry in Elastic Observability — Elastic Observability Labs